


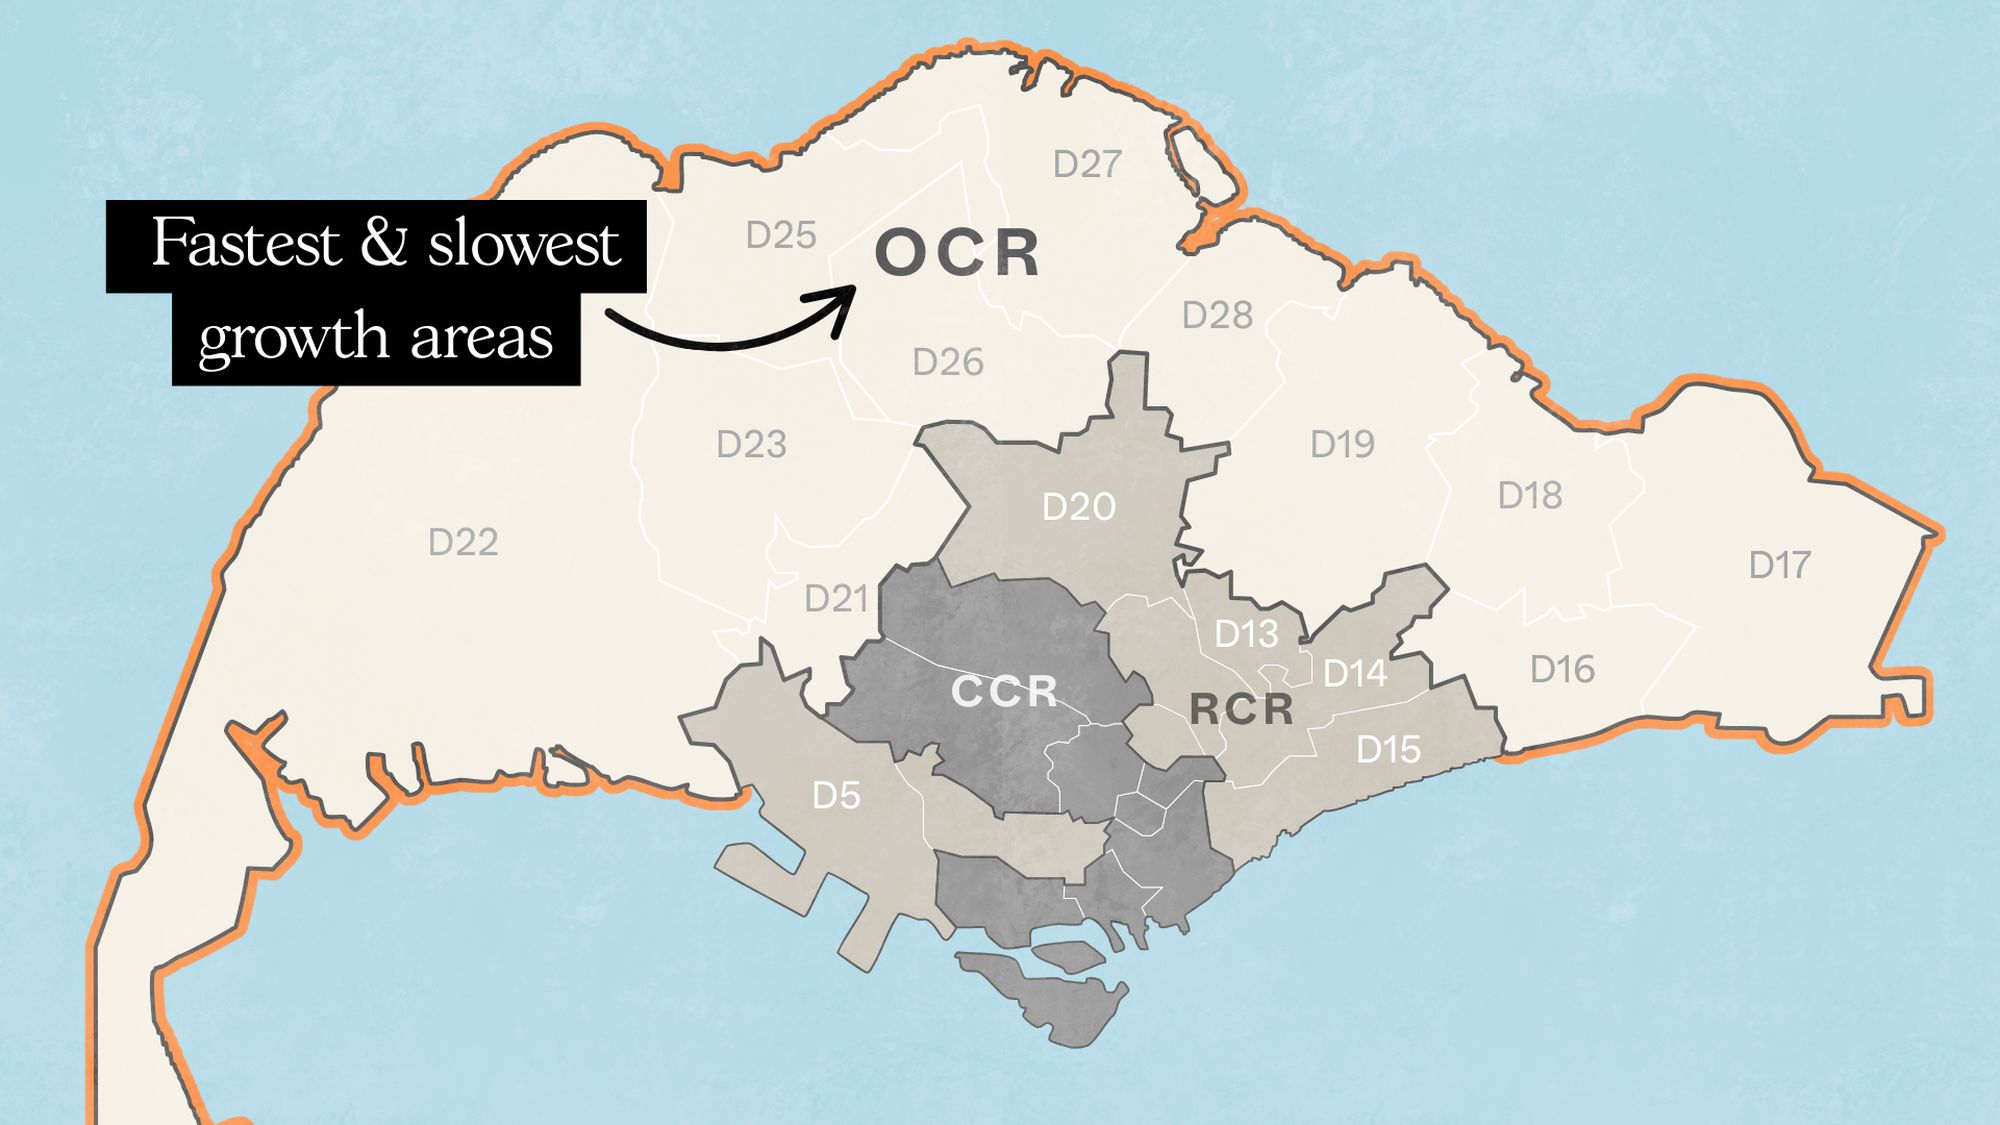
For many Singaporeans, homes in the Outside-Central Region (OCR) have long been the bread-and-butter choice of private property. It’s seen as the sensible, mass-market segment; condos here are defined by practicality, affordability, and the aspirations of HDB upgraders.
But here’s the eyebrow-raiser: the once-distinct price gulf between the OCR and more “prime” areas is disappearing. As we recently noted, properties in fringe districts like Bukit Panjang and Woodlands have surged – some reaching a quantum once reserved for RCR or even CCR neighbourhoods.
In short: the ladder has changed. The OCR is no longer the affordable rung it used to be. For many, the property market is becoming less about region and more about quantum. So what does this mean for Singaporeans who once relied on the OCR as their stepping stone? That’s what we’re peeling back this week, by investigating where prices have risen fastest and slowest across the OCR.
A quick note on methodology:
We should also clarify how we categorise projects into OCR, RCR, and CCR. This isn’t done only by district number, but also by the planning region (North, North East, East, West, Central) and planning area (e.g., Bishan, Bukit Timah, etc.).
For example, District 20 straddles both categories:
- A project in D20 that falls under the planning region Central and the planning area Bishan is classified as RCR.
- But a project in the same district, under the planning region North East and the planning area Ang Mo Kio, is classified as OCR.
So while we’re looking at “OCR districts” in this piece, the analysis is based on the planning region/area framework above, rather than just the district number.
So many readers write in because they're unsure what to do next, and don't know who to trust.
If this sounds familiar, we offer structured 1-to-1 consultations where we walk through your finances, goals, and market options objectively.
No obligation. Just clarity.
Learn more here.
Let’s start with a general look at how prices have risen across the OCR districts
We will use resale and subsale transactions only in this analysis, covering the past 10 years. This is because including new launches will distort the data with developer pricing, which will show disproportionate returns for those who were earlier buyers (you can see more information on this here).
Average price of subsale and resale non-landed private property (includes all bedroom types and tenure)
| Year | District | |||||||||||||||
| 5 | 13 | 14 | 15 | 16 | 17 | 18 | 19 | 20 | 21 | 22 | 23 | 25 | 26 | 27 | 28 | |
| 2014 | $1,459,968 | $1,218,000 | $1,078,942 | $1,292,157 | $1,329,393 | $1,062,761 | $1,093,058 | $1,140,623 | $1,244,184 | $1,452,697 | $1,110,916 | $1,109,419 | $866,226 | $1,356,716 | $941,832 | $1,180,332 |
| 2015 | $1,429,176 | $1,159,000 | $1,135,564 | $1,320,306 | $1,244,688 | $1,004,727 | $1,010,664 | $1,097,710 | $1,302,904 | $1,335,178 | $1,108,065 | $1,087,149 | $826,322 | $1,205,027 | $921,468 | $1,152,000 |
| 2016 | $1,349,170 | $950,692 | $1,007,871 | $1,306,358 | $1,216,313 | $946,281 | $956,838 | $1,074,127 | $1,353,236 | $1,351,897 | $1,072,871 | $1,025,573 | $782,312 | $1,162,962 | $893,028 | $1,113,369 |
| 2017 | $1,328,872 | $1,153,439 | $1,018,154 | $1,320,128 | $1,210,130 | $927,569 | $968,845 | $1,086,820 | $1,281,911 | $1,353,681 | $1,075,029 | $1,036,987 | $772,543 | $1,242,087 | $913,540 | $1,118,421 |
| 2018 | $1,376,466 | $1,357,652 | $1,044,848 | $1,300,221 | $1,293,272 | $989,123 | $1,047,832 | $1,105,844 | $1,430,307 | $1,426,373 | $1,137,199 | $1,085,438 | $840,644 | $1,216,167 | $1,001,433 | $1,070,306 |
| 2019 | $1,410,677 | $865,236 | $1,152,867 | $1,408,918 | $1,272,304 | $964,272 | $1,011,975 | $1,114,845 | $1,332,731 | $1,564,751 | $1,160,879 | $1,125,924 | $813,697 | $1,321,110 | $999,127 | $984,633 |
| 2020 | $1,379,022 | $1,102,750 | $1,080,459 | $1,435,311 | $1,301,015 | $989,432 | $1,016,886 | $1,115,637 | $1,272,253 | $1,529,480 | $1,151,626 | $1,078,067 | $802,818 | $1,261,981 | $966,435 | $1,051,217 |
| 2021 | $1,467,187 | $1,294,779 | $1,086,621 | $1,535,850 | $1,307,651 | $1,015,165 | $1,105,125 | $1,168,272 | $1,503,238 | $1,658,593 | $1,204,215 | $1,119,657 | $924,180 | $1,225,324 | $1,058,632 | $1,129,763 |
| 2022 | $1,462,198 | $1,212,500 | $1,174,706 | $1,587,316 | $1,390,405 | $1,095,518 | $1,187,074 | $1,644,101 | $1,569,372 | $1,949,106 | $2,379,639 | $1,197,697 | $1,080,316 | $1,442,680 | $1,144,361 | $1,194,554 |
| 2023 | $1,602,497 | $1,248,726 | $1,229,826 | $1,716,952 | $1,710,823 | $1,182,907 | $1,288,048 | $1,380,363 | $1,682,448 | $2,030,920 | $1,395,054 | $1,295,856 | $1,161,731 | $1,630,612 | $1,242,595 | $1,277,797 |
| 2024 | $1,688,633 | $1,622,359 | $1,402,092 | $1,859,045 | $1,595,123 | $1,297,876 | $1,398,051 | $1,463,689 | $1,770,887 | $2,103,351 | $1,502,650 | $1,387,013 | $1,198,485 | $1,705,507 | $1,307,462 | $1,358,196 |
| 2025 | $1,702,337 | $1,392,290 | $1,520,536 | $1,795,534 | $1,697,589 | $1,282,327 | $1,463,162 | $1,525,723 | $1,840,172 | $2,185,186 | $1,594,853 | $1,437,824 | $1,269,195 | $1,850,799 | $1,363,789 | $1,432,663 |
| % increase from 2014 to June 2025 | 16.60% | 14.31% | 40.93% | 38.96% | 27.70% | 20.66% | 33.86% | 33.76% | 47.90% | 50.42% | 43.56% | 29.60% | 46.52% | 36.42% | 44.80% | 21.38% |
Here are the notable highlights from the above:
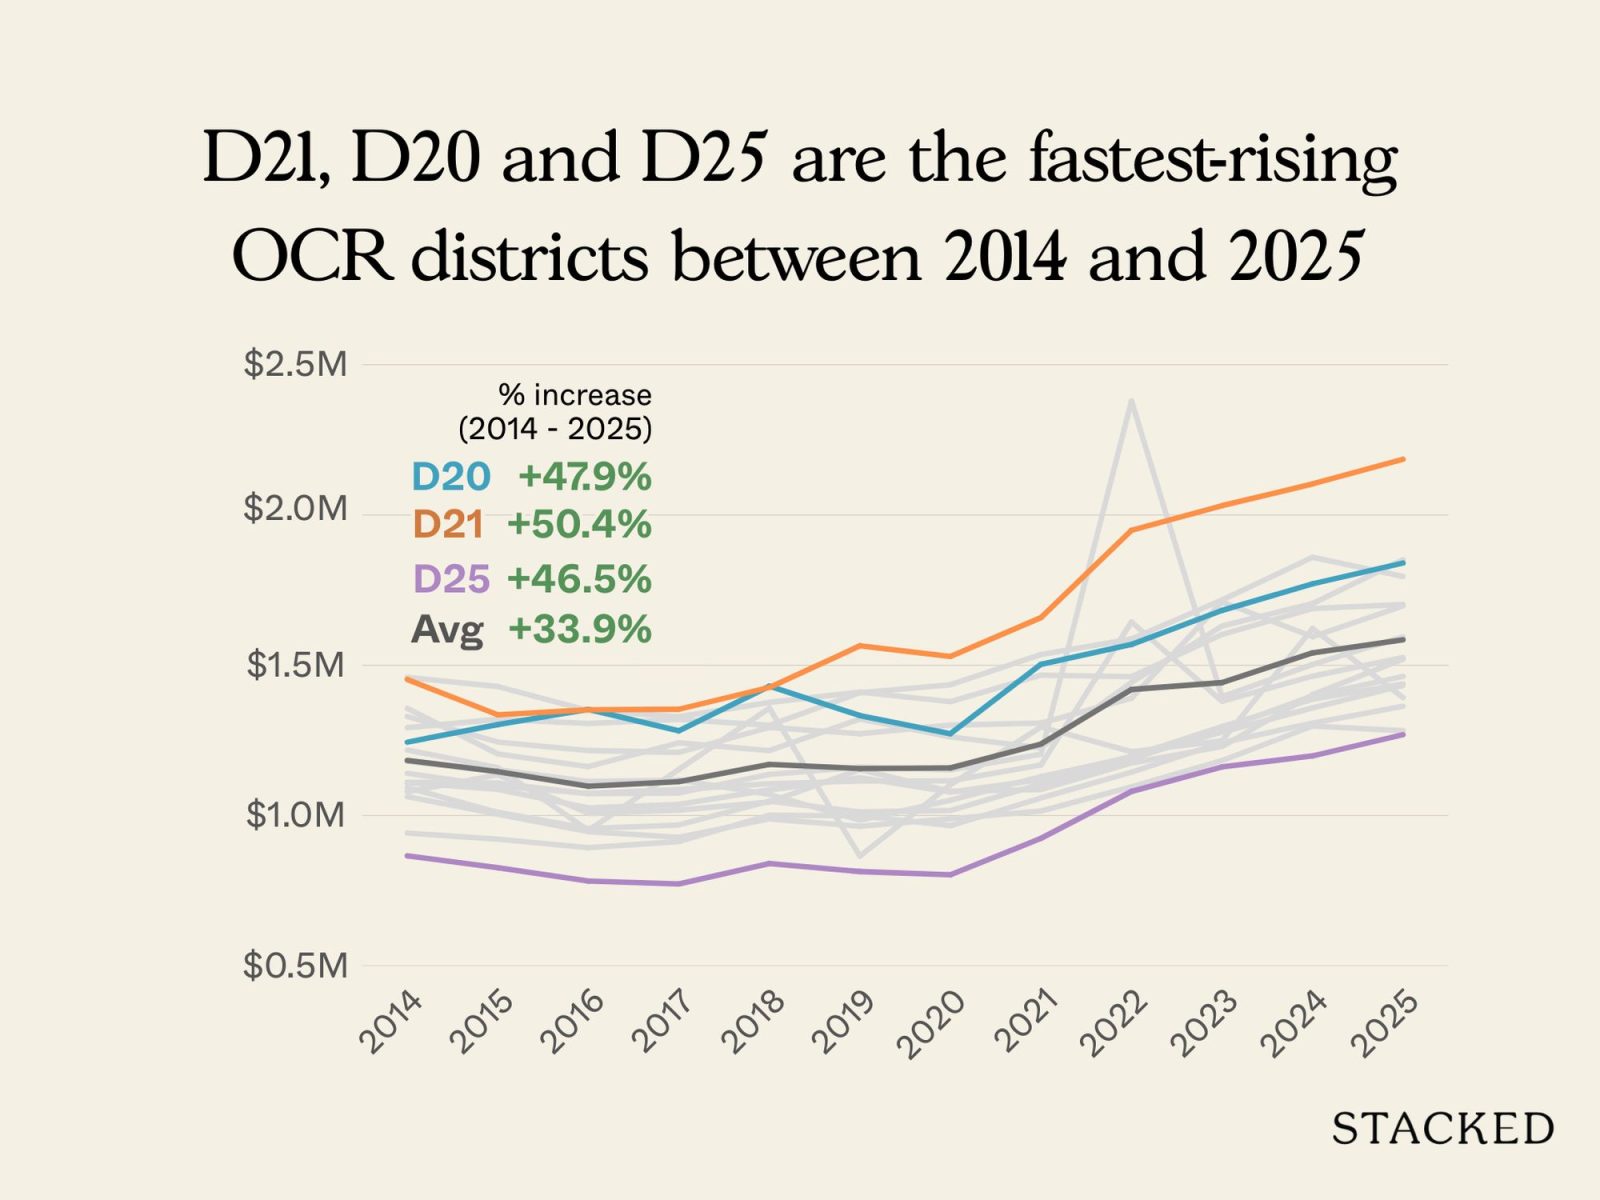
Fastest-Rising OCR Districts (2014–2025)
- District 21 (Upper Bukit Timah, Clementi Park, Ulu Pandan): +50.4%
- District 20 (Bishan, Ang Mo Kio, Thomson): +47.9%
- District 25 (Woodlands, Admiralty, Marsiling): +46.5%
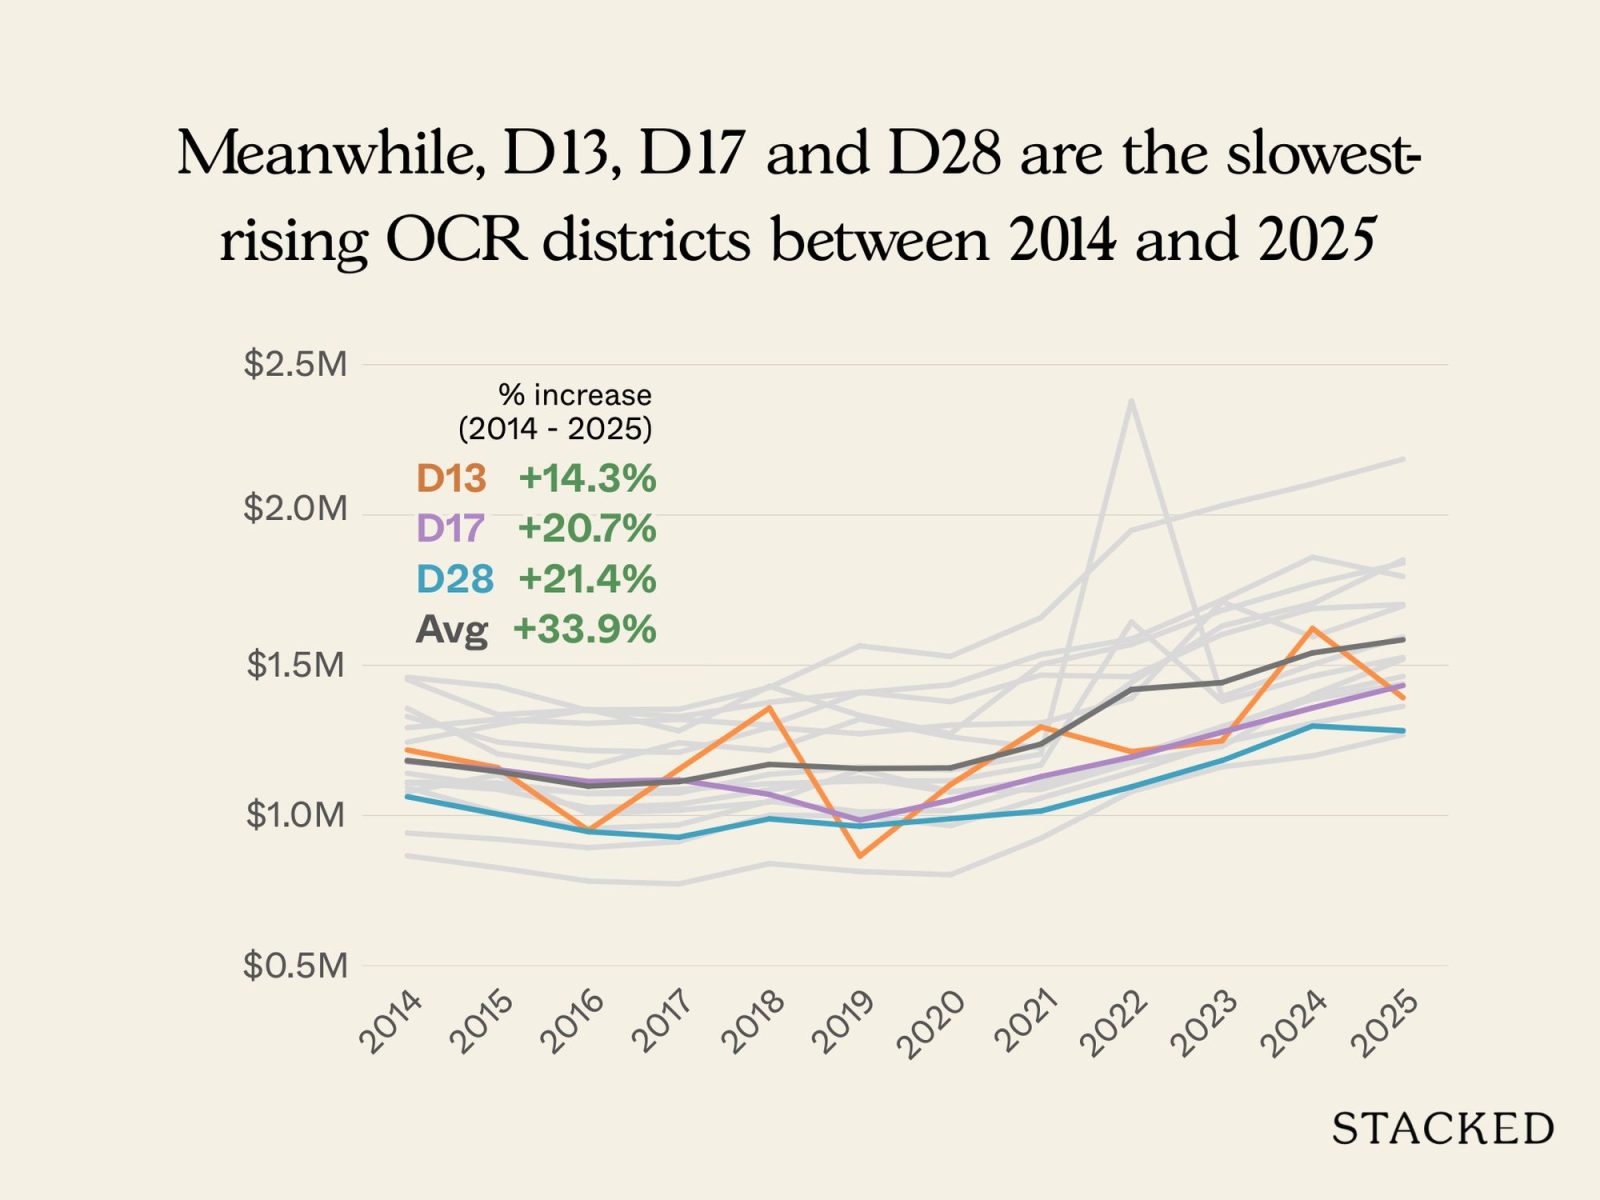
Slowest-Rising OCR Districts (2014–2025)
- District 13 (Potong Pasir, MacPherson, Braddell): +14.3%
- District 17 (Loyang, Changi): +20.7%
- District 28 (Seletar, Yio Chu Kang): +21.4%
We can see that growth has been very unevenly distributed, even if all the districts are within the same broad “heartland” category.
Districts such as 21 and 20 don’t surprise with their performance, as they’re long-established family enclaves, with schools or larger units that continually draw upgrader interest. But the performance of District 25 shows how quickly other areas can catch up: Woodlands and its surrounding towns were once seen as the most affordable end of the private market, yet the promise of cross-border connectivity (i.e., the RTS link) has lifted prices by almost as much as the Bukit Timah belt.
For District 13, we’re also not too surprised by the weaker percentage growth.
D13’s modest growth is due to higher base prices. Parts of the district, such as Potong Pasir and MacPherson, are zoned under the RCR, and projects like The Poiz Residences entered the market at significantly higher price points than OCR condos. Here, the elevated launch prices naturally compressed the percentage gains.
(E.g., buyers who entered at $1,400 to $1,500 psf in Potong Pasir would not see the same percentage uplift as those who bought at $800 to $900 psf in Woodlands or Sembawang, even if both groups walked away with similar quantum profits.)
So D13 isn’t actually a laggard; it just sees lower percentage gains because it dips into the higher-priced RCR in parts.
We can also see that growth in the OCR is closely tied to transformation narratives. Jurong (District 22) has been a long-running example: even before the full Jurong Lake District plans materialise, prices have already climbed strongly on the back of buyer expectations. Likewise, Sembawang and Yishun (District 27) benefited from Canberra’s emergence as a self-contained hub, with a new MRT station, shopping mall, and waterfront housing reshaping the district’s image.
Another point worth noting is that smaller or more peripheral districts, such as Seletar (District 28) and Loyang/Changi (District 17), have not enjoyed the same tailwinds.
Despite big-ticket projects like the Seletar Aerospace Hub or Changi Business Park, these areas continue to feel more like commuter towns, with limited buyer urgency. The uneven growth here shows how “first mover” stories can take a surprisingly long time to come to fruition. This is a 10-year view, so let that serve as a warning as to how long “first mover advantage” in “ulu” areas can take to pay off.
Granted, some districts are now edging close to RCR and even CCR price levels, while others remain stuck with only modest appreciation, but all the districts are seeing a strong pick-up.
This suggests that the OCR won’t be the “cheap region” in the coming decades: at this rate, we may see a day when there’s marginal or no difference between OCR, RCR, and CCR averages; the price differences will be specific to the district but not the region.
Next, let’s take a look at price increases across each district, based on unit size
This distinction matters because demand for compact units like one- and two-bedders is shaped very differently compared to family-sized homes.
One-bedders, for example, are often driven by investors or singles looking for affordability, while three- and four-bedders are the traditional stomping ground of HDB upgraders who want more space for their families.
Looking at price growth by size allows us to see which segments of the OCR were really powering the climb. Was it small-unit buyers chasing rental yields, or were upgrader families driving the strongest appreciation?
Let’s start with the favourites of landlords and singles, the one-bedder unit:
Average price of subsale and resale 1-bedders
| Year | District | |||||||||||||||
| 5 | 13 | 14 | 15 | 16 | 17 | 18 | 19 | 20 | 21 | 22 | 23 | 25 | 26 | 27 | 28 | |
| 2014 | $709,737 | $740,781 | $768,667 | $657,923 | $639,000 | $738,373 | $726,857 | $745,600 | $596,050 | $860,000 | $671,429 | $740,000 | ||||
| 2015 | $775,800 | $698,726 | $689,785 | $744,661 | $630,688 | $611,537 | $665,534 | $690,000 | $701,000 | $603,617 | $804,333 | $631,905 | $634,444 | |||
| 2016 | $725,000 | $610,000 | $663,429 | $684,518 | $696,283 | $606,500 | $601,210 | $651,183 | $778,000 | $683,500 | $700,796 | $563,371 | $669,000 | $610,111 | $679,100 | |
| 2017 | $826,182 | $716,178 | $671,737 | $723,523 | $756,729 | $553,077 | $608,127 | $651,022 | $720,000 | $792,600 | $799,286 | $718,684 | $556,567 | $740,000 | $601,438 | $621,750 |
| 2018 | $778,053 | $906,318 | $695,615 | $709,943 | $764,616 | $559,300 | $638,132 | $689,269 | $716,000 | $855,000 | $782,411 | $735,128 | $556,633 | $825,980 | $629,660 | $606,203 |
| 2019 | $797,818 | $560,963 | $700,600 | $765,598 | $749,118 | $548,789 | $608,779 | $700,153 | $705,625 | $900,000 | $823,492 | $720,952 | $560,423 | $627,600 | $597,105 | |
| 2020 | $747,161 | $644,333 | $655,323 | $706,220 | $751,070 | $551,088 | $609,860 | $673,490 | $680,900 | $960,000 | $740,597 | $692,776 | $546,444 | $732,160 | $601,694 | $610,404 |
| 2021 | $786,563 | $750,773 | $698,192 | $806,664 | $754,730 | $591,227 | $651,478 | $717,574 | $709,694 | $1,001,667 | $800,255 | $722,137 | $567,125 | $805,024 | $632,696 | $653,878 |
| 2022 | $814,710 | $752,667 | $733,224 | $820,404 | $801,560 | $643,959 | $692,004 | $754,169 | $765,455 | $950,000 | $836,817 | $747,503 | $619,359 | $915,578 | $699,841 | $700,043 |
| 2023 | $881,797 | $817,222 | $814,714 | $885,464 | $861,334 | $696,084 | $746,072 | $815,390 | $802,555 | $1,350,000 | $910,957 | $810,183 | $678,195 | $700,000 | $749,471 | $737,704 |
| 2024 | $923,563 | $856,378 | $810,378 | $974,609 | $863,803 | $725,646 | $771,256 | $842,009 | $870,984 | $920,060 | $838,423 | $675,636 | $930,600 | $796,358 | $769,553 | |
| 2025 | $948,099 | $817,333 | $807,878 | $957,667 | $920,957 | $740,620 | $808,991 | $850,699 | $922,400 | $833,694 | $683,074 | $1,055,000 | $867,846 | $767,419 | ||
| % increase from 2014 to June 2025 | 13.83% | 29.28% | 19.81% | 12.57% | 26.60% | 15.21% | 26.90% | 11.82% | 14.60% | 22.67% | 29.25% | 3.71% | ||||
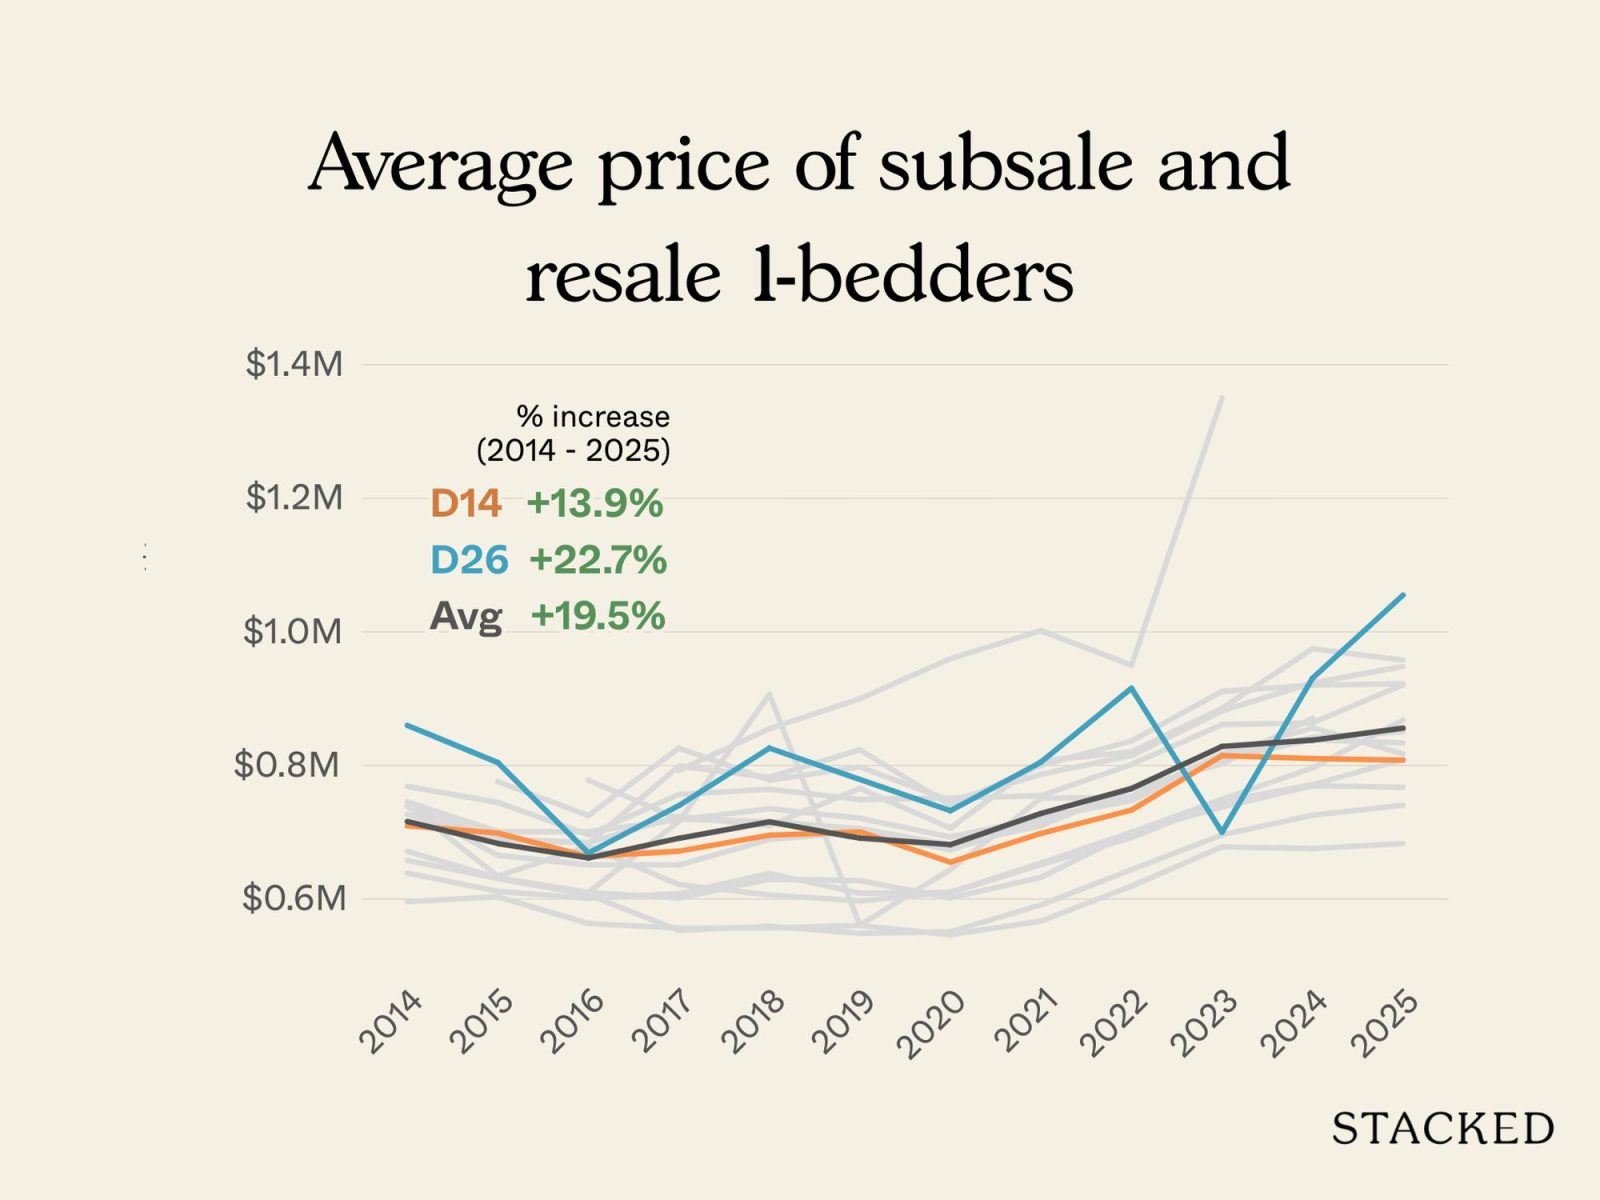
One-bedders have generally seen more muted growth compared to the family-sized units. District 26 and District 14 lead the pack:
District 14 is right on the city fringe, with strong rental demand from nearby business hubs like Paya Lebar Quarter, and a steady stream of tenants who value access to the East-West and Circle Lines. It has also long been an entry point for buyers who want a closer-to-central location at a lower quantum. This aligns well with landlords renting out single-bedder units.
District 26, while not traditionally seen as prime, is gaining a bit of traction because of the Springleaf MRT station on the Thomson-East Coast Line. We would also keep an eye on the immediate surroundings of the MRT station, which has only seen one condo project to date: Springleaf Residence. The strong showing of Springleaf Residence at launch reflects strong fundamental demand in this area.
At the other end, District 27’s one-bedder gains have been slim over the decade. This is because investor demand for one-bedders is virtually absent in areas like Yishun and Sembawang. This was why, when Canberra Crescent Residences launched, the developer only bothered to have three single-bedder units. We don’t foresee any changes here for one-bedders, as this is overwhelmingly a family area.
Now let’s look at two-bedders
Average price of subsale and resale 2-bedders
| Year | District | |||||||||||||||
| 5 | 13 | 14 | 15 | 16 | 17 | 18 | 19 | 20 | 21 | 22 | 23 | 25 | 26 | 27 | 28 | |
| 2014 | $1,152,153 | $910,000 | $997,438 | $1,136,486 | $1,021,418 | $926,300 | $906,661 | $1,081,050 | $1,140,188 | $1,055,936 | $1,013,112 | $897,292 | $796,090 | $982,980 | $823,550 | $960,063 |
| 2015 | $1,042,878 | $878,000 | $967,667 | $1,065,283 | $980,057 | $871,628 | $861,704 | $968,290 | $1,058,250 | $1,034,681 | $994,390 | $928,810 | $805,000 | $946,440 | $828,209 | $879,926 |
| 2016 | $1,013,333 | $880,000 | $959,254 | $1,069,476 | $944,081 | $837,334 | $814,066 | $934,060 | $1,132,778 | $1,017,353 | $951,036 | $844,206 | $753,652 | $1,075,850 | $801,207 | $868,769 |
| 2017 | $1,017,007 | $1,292,689 | $945,695 | $1,076,553 | $969,347 | $808,106 | $828,159 | $940,720 | $1,033,333 | $1,054,163 | $979,701 | $878,686 | $704,608 | $969,407 | $794,409 | $884,633 |
| 2018 | $1,076,090 | $1,436,210 | $921,366 | $1,169,871 | $1,037,160 | $830,086 | $857,305 | $976,181 | $1,049,273 | $1,117,593 | $1,028,723 | $914,579 | $723,621 | $1,023,474 | $796,159 | $907,458 |
| 2019 | $1,085,789 | $935,333 | $975,896 | $1,141,708 | $1,026,744 | $832,500 | $836,448 | $972,105 | $1,118,500 | $1,123,947 | $1,005,490 | $939,997 | $716,459 | $1,031,811 | $822,516 | $826,984 |
| 2020 | $1,048,325 | $1,164,400 | $896,215 | $1,200,030 | $1,065,631 | $855,804 | $827,138 | $969,273 | $1,068,185 | $1,185,660 | $1,042,782 | $936,903 | $691,900 | $977,742 | $807,308 | $835,525 |
| 2021 | $1,135,698 | $1,234,300 | $1,029,541 | $1,265,666 | $1,058,860 | $861,279 | $866,160 | $1,020,515 | $1,159,008 | $1,273,309 | $1,068,617 | $961,954 | $769,646 | $974,839 | $853,177 | $892,951 |
| 2022 | $1,167,351 | $1,180,500 | $1,078,230 | $1,384,060 | $1,140,946 | $956,068 | $958,983 | $1,076,860 | $1,187,292 | $1,488,940 | $1,121,975 | $1,014,607 | $864,407 | $1,188,429 | $946,674 | $985,803 |
| 2023 | $1,281,652 | $1,360,486 | $1,194,391 | $1,464,560 | $1,254,006 | $1,057,679 | $1,055,842 | $1,194,307 | $1,328,670 | $1,608,413 | $1,201,423 | $1,120,859 | $926,229 | $1,370,500 | $1,010,835 | $1,044,765 |
| 2024 | $1,351,227 | $1,572,800 | $1,239,912 | $1,501,973 | $1,288,441 | $1,090,371 | $1,088,750 | $1,242,420 | $1,474,993 | $1,653,710 | $1,289,207 | $1,170,765 | $967,919 | $1,361,808 | $1,050,970 | $1,070,492 |
| 2025 | $1,361,931 | $1,456,296 | $1,266,964 | $1,520,799 | $1,333,215 | $1,137,780 | $1,140,561 | $1,285,874 | $1,410,900 | $1,637,063 | $1,361,064 | $1,209,624 | $950,400 | $1,315,434 | $1,097,398 | $1,107,219 |
| % increase from 2014 to June 2025 | 18.21% | 60.03% | 27.02% | 33.82% | 30.53% | 22.83% | 25.80% | 18.95% | 23.74% | 55.03% | 34.34% | 34.81% | 19.38% | 33.82% | 33.25% | 15.33% |
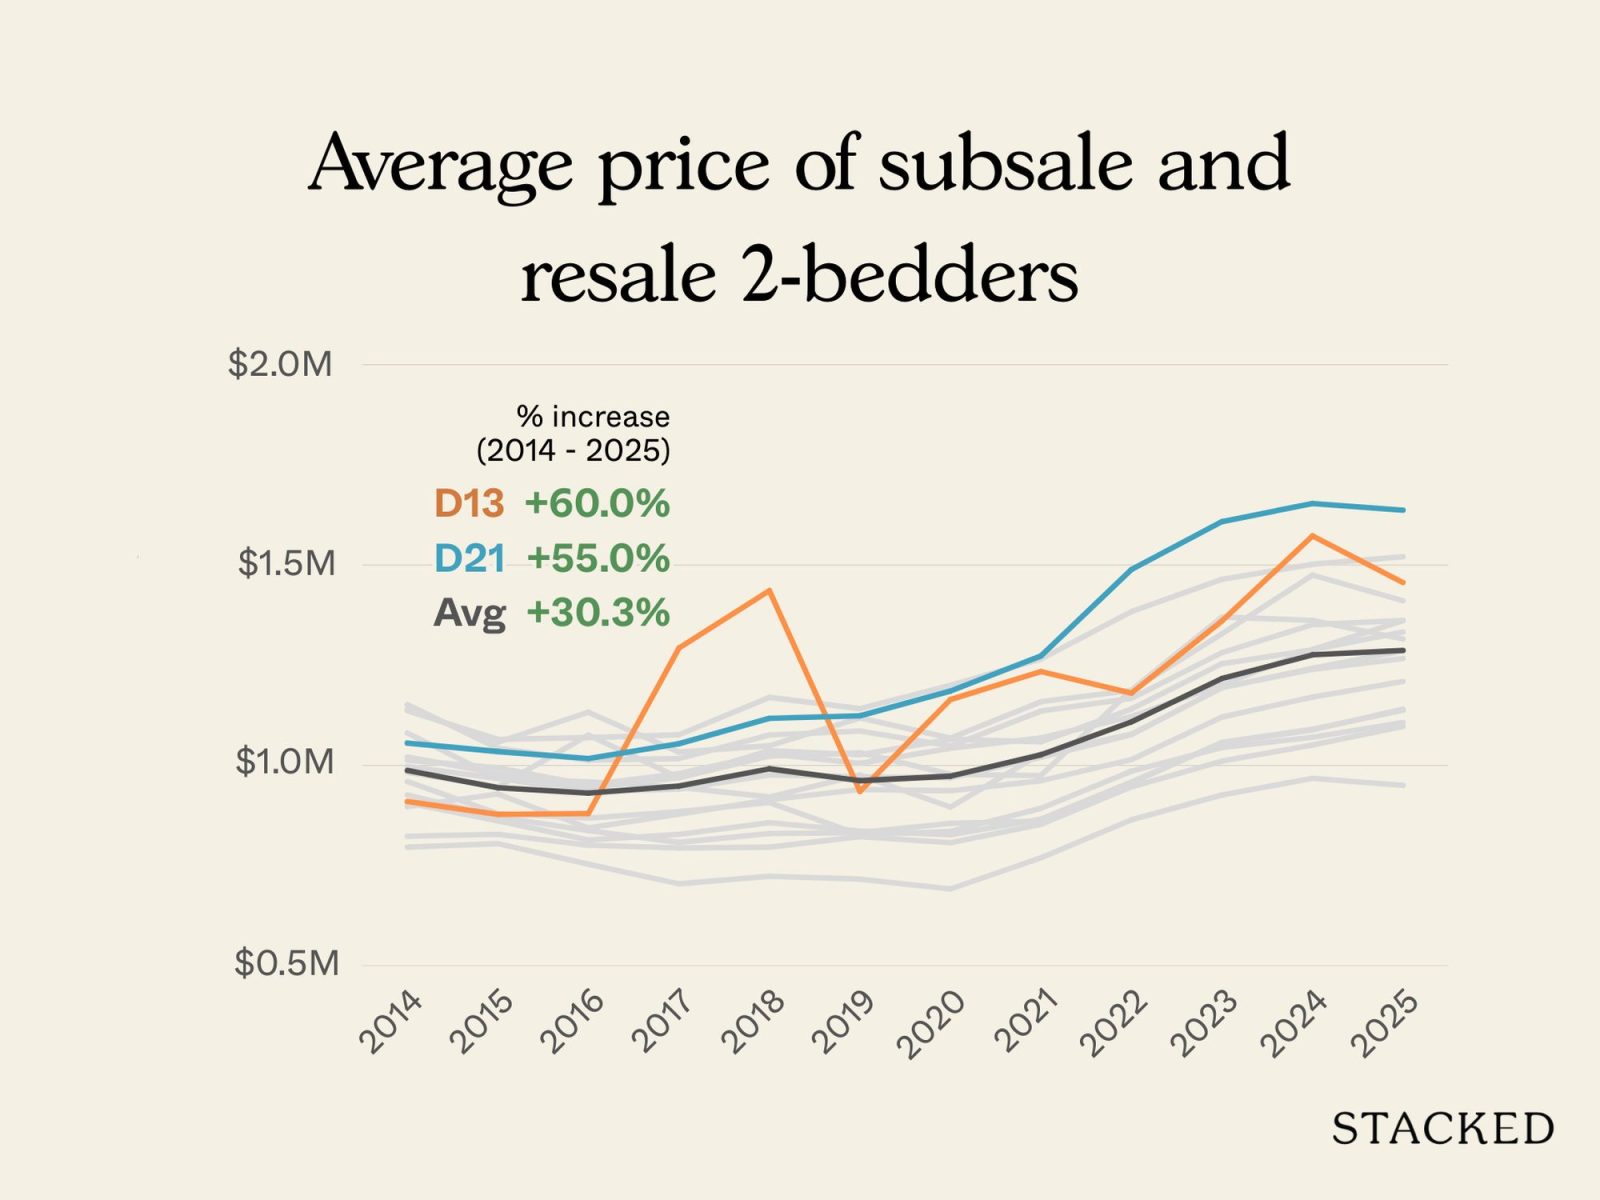
Two-bedders turned out to be a surprising segment. The clear standout is District 13, which saw prices jump by 60 per cent – a sharp contrast with the district’s modest overall growth of just 14.3 per cent.
At first glance, this seems to clash with what we noted earlier, that D13’s higher base prices in RCR projects like The Poiz and Park Colonial compressed percentage gains.
But the distinction lies in unit type: one-bedders in these projects launched at very high psf levels for their time, often above $1,400 psf, which limited their percentage growth even if owners made decent absolute profits. The two-bedders, on the other hand, occupied a safer spot: still expensive by OCR standards, but relatively affordable compared to larger family units in RCR or CCR districts. This still gave them room to appreciate.
In addition, two-bedders can appeal to both upgraders and landlords: upgraders see them as a way to live close to the downtown core while still having residential amenities, while landlords value the higher rentability compared to shoeboxes. That dual demand helped D13’s two-bedders to buck the overall trend.
District 21 was another major performer, with two-bedders rising by 55 per cent. This reflects the upgrader-driven nature of the Bukit Timah and Clementi Park areas. Younger families may not be able to stretch to three-bedders here, but might settle for a two-bedder; a trade-off of space, for the schools and lifestyle of the neighbourhood.
While District 5’s two-bedder growth (+18.2 per cent) is modest, it doesn’t really reflect underperformance. In fact, demand in Clementi is almost always strong: we recently pointed out that new two-bedder condos in Clementi averaged around $2 million in 2024, compared to an already high $1.4 million for resale two-bedders. This also means the established resale units here were already priced high to begin with, thus resulting in lower percentage gains.
District 28 is the underperformer here; simply put, Seletar’s transformation story has yet to be completed, and two-bedders are overshadowed because this isn’t really a “rental asset” type of area. Not for now.
Let’s look at the three-bedders next
Average price of subsale and resale 3-bedders
| Year | District | |||||||||||||||
| 5 | 13 | 14 | 15 | 16 | 17 | 18 | 19 | 20 | 21 | 22 | 23 | 25 | 26 | 27 | 28 | |
| 2014 | $1,465,043 | $1,295,000 | $1,216,310 | $1,440,712 | $1,315,251 | $1,178,176 | $1,092,718 | $1,213,710 | $1,242,751 | $1,480,699 | $1,146,399 | $1,128,877 | $929,588 | $1,313,818 | $983,586 | $1,170,700 |
| 2015 | $1,437,591 | $1,205,833 | $1,214,563 | $1,380,069 | $1,336,291 | $1,093,512 | $1,028,138 | $1,151,798 | $1,318,609 | $1,350,643 | $1,106,217 | $1,093,975 | $873,179 | $1,260,973 | $967,011 | $1,194,109 |
| 2016 | $1,402,739 | $1,223,885 | $1,176,222 | $1,321,082 | $1,279,023 | $1,056,222 | $1,023,590 | $1,108,700 | $1,298,141 | $1,369,891 | $1,094,788 | $1,078,960 | $882,811 | $1,166,336 | $954,658 | $1,142,500 |
| 2017 | $1,358,255 | $1,337,333 | $1,225,875 | $1,401,984 | $1,274,600 | $1,053,469 | $995,012 | $1,161,164 | $1,352,071 | $1,415,064 | $1,073,240 | $1,091,137 | $868,049 | $1,247,879 | $956,173 | $1,135,978 |
| 2018 | $1,479,808 | $1,522,000 | $1,276,410 | $1,483,258 | $1,387,276 | $1,110,851 | $1,065,952 | $1,188,699 | $1,467,942 | $1,488,396 | $1,165,445 | $1,134,874 | $881,525 | $1,284,050 | $1,005,458 | $1,210,905 |
| 2019 | $1,506,244 | $1,216,500 | $1,281,750 | $1,526,732 | $1,392,034 | $1,133,821 | $1,041,558 | $1,194,133 | $1,399,088 | $1,625,915 | $1,205,196 | $1,176,946 | $875,791 | $1,392,757 | $1,020,858 | $1,135,658 |
| 2020 | $1,480,289 | $1,278,200 | $1,297,294 | $1,566,394 | $1,390,376 | $1,140,705 | $1,037,328 | $1,162,460 | $1,431,376 | $1,557,247 | $1,153,262 | $1,118,610 | $862,544 | $1,385,262 | $1,019,332 | $1,169,394 |
| 2021 | $1,615,747 | $1,732,818 | $1,380,513 | $1,772,383 | $1,454,886 | $1,193,982 | $1,126,033 | $1,236,251 | $1,531,854 | $1,712,307 | $1,245,655 | $1,212,793 | $977,554 | $1,372,922 | $1,080,669 | $1,195,118 |
| 2022 | $1,725,429 | $1,704,333 | $1,588,554 | $1,872,437 | $1,583,692 | $1,284,137 | $1,258,581 | $1,368,834 | $1,712,001 | $1,972,627 | $1,372,400 | $1,360,422 | $1,111,427 | $1,590,789 | $1,176,567 | $1,310,030 |
| 2023 | $1,873,788 | $1,559,750 | $1,625,928 | $2,007,713 | $1,710,179 | $1,373,056 | $1,423,607 | $1,545,653 | $1,858,666 | $2,116,531 | $1,459,021 | $1,485,492 | $1,202,213 | $1,685,854 | $1,271,930 | $1,426,541 |
| 2024 | $2,005,054 | $2,240,286 | $1,781,623 | $2,090,574 | $1,881,748 | $1,472,775 | $1,496,114 | $1,630,522 | $1,931,869 | $2,134,280 | $1,582,650 | $1,547,830 | $1,262,414 | $1,953,400 | $1,339,034 | $1,500,853 |
| 2025 | $2,091,781 | $1,727,500 | $1,737,776 | $2,073,935 | $1,963,892 | $1,504,775 | $1,570,042 | $1,711,650 | $1,946,897 | $2,272,784 | $1,632,846 | $1,550,108 | $1,300,738 | $2,069,729 | $1,367,223 | $1,515,378 |
| % increase from 2014 to June 2025 | 42.78% | 33.40% | 42.87% | 43.95% | 49.32% | 27.72% | 43.68% | 41.03% | 56.66% | 53.49% | 42.43% | 37.31% | 39.93% | 57.54% | 39.00% | 29.44% |
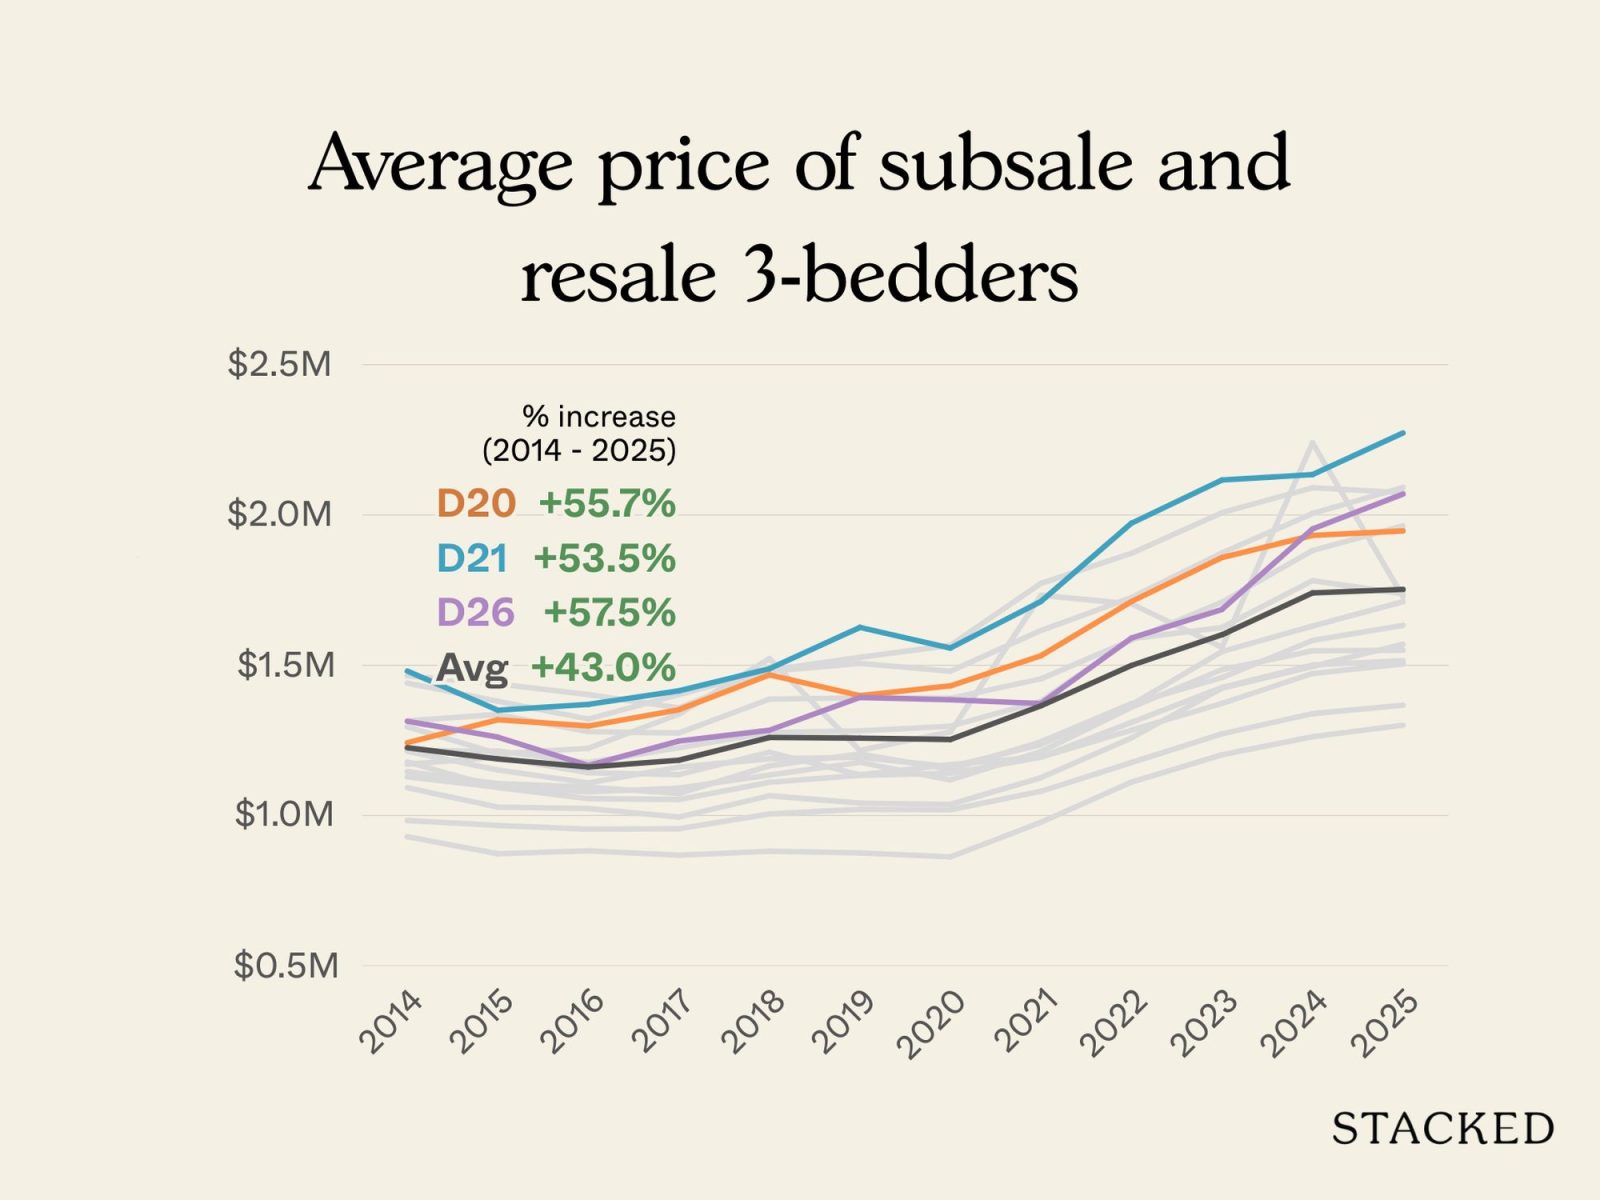
Three-bedders show the clearest divide in the OCR: these are the units most tied to upgrader families. Districts 20 and 21 have long been regarded as the “heartland premium” areas.
In Bishan and Ang Mo Kio (District 20), three-bedders are heavily supported by proximity to top primary schools such as Catholic High, Ai Tong, and CHIJ St. Nicholas, as well as MRT interchanges like Bishan (North-South and Circle Line) and Ang Mo Kio (North-South Line, with the Thomson-East Coast Line now coming through).
District 21’s Upper Bukit Timah and Clementi Park stretch has the same kind of entrenched appeal: it combines access to good schools like Pei Hwa Presbyterian and Methodist Girls’, larger unit layouts dating back to the 1980s–1990s condo stock, and connectivity via the Downtown Line and Clementi MRT.
As we explained in this article, areas like D21 (Upper Bukit Timah/Clementi Park) have seen resale three-bedder units creeping past the $2 million mark, and this is one of the districts where the line between OCR and RCR prices has blurred significantly.
District 26 (Upper Thomson, Springleaf, Lentor) stands out with the highest increase at about 57.5 per cent. Improved connectivity from the TEL, especially the Springleaf and Lentor stations, might have lifted demand for three-bedders in the area. Older homes in the Upper Thomson corridor also remain popular, because these tend to be more spacious than newer counterparts.
District 27 (Sembawang/Yishun/Canberra) also saw notable gains of about 39 per cent. The addition of Canberra MRT (NSL) in 2019, the development of Bukit Canberra (a large integrated hub with sports, food, and community facilities), and Canberra Plaza have made the area more convenient. These upgrades are helping condo in Canberra to shed the “ulu” image once attached to the area, and the prices charged at the recently launched Canberra Crescent Residences reflect this confidence.
On the lower end, Districts 28 (Seletar/Yio Chu Kang) saw just 29.4 per cent growth, followed by District 17 (Loyang/Changi) at 27.7 per cent. These areas remain somewhat limited in their amenities, and some would consider areas like Changi and Seletar to have niche appeal. Further development is needed in these neighbourhoods before we can see more dramatic numbers.
Finally, let’s look at the four-bedders
Average price of subsale and resale 4-bedders
| Year | District | |||||||||||||||
| 5 | 13 | 14 | 15 | 16 | 17 | 18 | 19 | 20 | 21 | 22 | 23 | 25 | 26 | 27 | 28 | |
| 2014 | $1,908,842 | $2,060,000 | $2,107,667 | $1,944,893 | $1,511,000 | $1,375,234 | $1,602,280 | $1,527,480 | $1,768,846 | $1,420,056 | $1,459,192 | $1,085,000 | $2,105,470 | $1,090,629 | $1,522,492 | |
| 2015 | $1,892,127 | $2,109,714 | $2,293,940 | $1,771,684 | $1,536,300 | $1,354,917 | $1,487,873 | $1,525,543 | $1,932,200 | $1,482,309 | $1,411,189 | $1,062,571 | $1,577,667 | $1,302,952 | $1,479,929 | |
| 2016 | $1,831,923 | $2,061,000 | $2,123,091 | $1,845,118 | $1,315,769 | $1,331,353 | $1,398,459 | $1,872,875 | $1,740,223 | $1,369,462 | $1,373,376 | $996,667 | $1,385,299 | $1,271,263 | $1,536,188 | |
| 2017 | $1,890,672 | $1,594,000 | $2,029,143 | $1,639,155 | $1,352,000 | $1,337,349 | $1,482,156 | $1,558,750 | $1,813,071 | $1,439,263 | $1,404,538 | $1,130,429 | $1,788,000 | $1,190,010 | $1,558,308 | |
| 2018 | $1,926,444 | $1,700,000 | $1,818,300 | $2,158,844 | $1,836,487 | $1,374,057 | $1,374,585 | $1,513,101 | $1,904,311 | $2,005,813 | $1,570,737 | $1,463,739 | $1,044,391 | $1,777,833 | $1,247,438 | $1,587,042 |
| 2019 | $2,132,351 | $2,110,000 | $2,376,920 | $1,749,864 | $1,412,287 | $1,368,675 | $1,494,712 | $1,585,429 | $1,992,333 | $1,458,409 | $1,522,317 | $1,149,714 | $1,745,150 | $1,369,606 | $1,575,647 | |
| 2020 | $1,983,489 | $1,500,000 | $2,027,889 | $2,267,034 | $1,892,227 | $1,490,792 | $1,364,640 | $1,478,405 | $1,525,456 | $1,909,857 | $1,502,150 | $1,449,118 | $1,117,300 | $1,928,300 | $1,227,423 | $1,453,531 |
| 2021 | $2,035,325 | $1,960,556 | $2,602,388 | $1,923,313 | $1,525,858 | $1,547,517 | $1,517,453 | $2,137,538 | $2,240,000 | $1,735,636 | $1,593,070 | $1,249,319 | $2,135,833 | $1,408,254 | $1,499,413 | |
| 2022 | $2,305,646 | $1,978,148 | $3,040,888 | $2,253,849 | $1,713,654 | $1,691,448 | $1,712,916 | $2,726,667 | $3,048,444 | $1,589,202 | $1,656,925 | $1,380,099 | $2,034,364 | $1,474,348 | $1,637,346 | |
| 2023 | $2,449,855 | $1,750,000 | $2,507,500 | $2,861,346 | $2,311,677 | $1,829,733 | $1,823,006 | $1,897,935 | $2,063,289 | $2,529,000 | $1,651,815 | $1,861,262 | $1,473,945 | $2,041,965 | $1,545,033 | $1,859,389 |
| 2024 | $2,621,665 | $2,853,625 | $3,241,648 | $2,461,302 | $1,885,172 | $1,981,463 | $2,011,329 | $2,463,429 | $2,887,727 | $1,877,450 | $1,927,819 | $1,631,571 | $1,971,984 | $1,622,598 | $2,097,456 | |
| 2025 | $2,664,061 | $2,383,436 | $3,067,876 | $2,821,765 | $2,050,500 | $2,094,667 | $2,094,467 | $2,069,333 | $2,930,000 | $1,968,755 | $2,101,311 | $1,666,536 | $2,400,600 | $1,718,153 | $2,112,163 | |
| % increase from 2014 to June 2025 | 39.56% | 15.70% | 45.56% | 45.09% | 35.70% | 52.31% | 30.72% | 35.47% | 65.64% | 38.64% | 44.01% | 53.60% | 14.02% | 57.54% | 38.73% | |
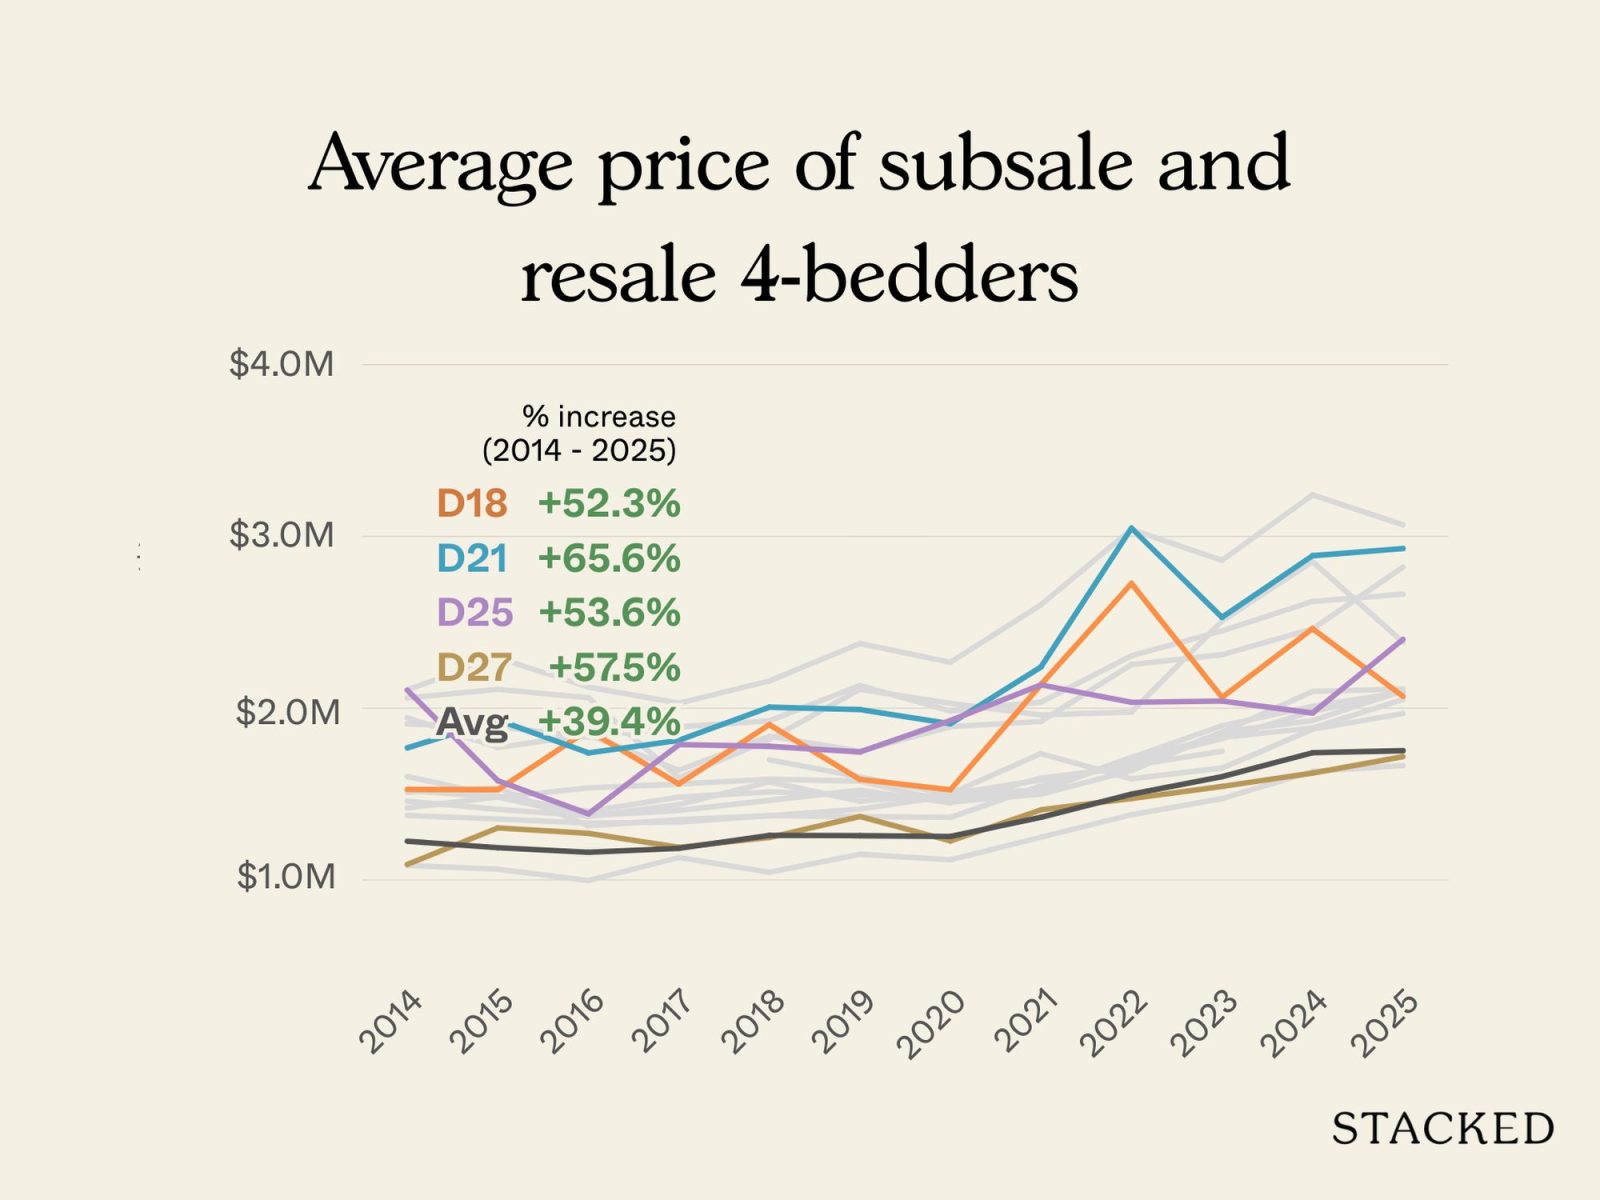
Four-bedders are among the priciest properties; so for many “average” upgraders, the OCR remains the place where such a move is most plausible. We can see that in the rather strong percentage gains, despite the already high base prices of these bigger units.
Take District 20 (Bishan, Ang Mo Kio, Thomson) as an example: four-bedders here appreciated saw prices rise by 65.6 per cent between 2014 and mid-2025; a rise from about $1.53 million to $2.93 million on average. That’s an increase of roughly $1.4 million in around a decade, and family buyers may still consider that a good deal, given that four-bedder prices can hit amounts like $4 million in other regions.
Similarly, District 27 (Sembawang/Yishun) clocked in a 57.5 per cent rise, and District 25 (Woodlands/Admiralty) wasn’t far behind with 53.6 per cent. These districts, once on the affordability fringe of the market, have seen four-bedders move from “budget family option” to genuine upgrader target.
We’ve already noted the key reasons: in District 27, Canberra’s steady upgrades – from its own MRT station to Canberra Plaza and the Bukit Canberra hub – have repositioned the area as a viable, self-sufficient township. In District 25, the promised RTS link and northern redevelopment plans have reshaped buyer expectations.
Couple this with the lower existing resale prices, compared to other regions: D27’s four-bedders are still at around $2.1 million, and D25’s are at just $1.67 million over the same period. This is still a much lower quantum for a four-bedder compared to RCR/CCR prices, and these are areas with a lot of promise for future growth.
The weakest growth was in districts where four-bedders are not a natural fit for the buyer demographic. In District 14 (Geylang, Paya Lebar), appreciation was just 15.7 per cent. These are more built-up areas that appeal more to young couples, landlords, or those who don’t mind the lack of green spaces. Those types of buyers, however, are not typically the ones who gravitate toward larger four-bedders.
Bukit Batok, in certain breakdowns of District 25, fared even worse at just 14 per cent; despite being a tranquil enclave, the area lacks the transformational pull of Woodlands or the established reputation of Bishan, leaving large units with weaker demand.
Conclusion
In general, we can see that the biggest gains have gone to areas with either (1) entrenched family appeal like Bishan or Upper Bukit Timah, or (2) strong transformation narratives like Canberra and Woodlands. If you’re buying for your own stay, these are the districts where demand resilience has been proven, and where your exit options may remain strongest.
At the same time, weaker performers like Seletar, Loyang show the limits of the “first-mover” story. If you’re planning to stretch for a larger unit, ask yourself whether the district truly matches a family profile, or if you’re relying on transformation plans that may take decades to play out.
On the flip side, certain OCR areas already have high resale prices; areas like Paya Lebar, Clementi, or Potong Pasir. For these locations, you’re no longer buying when prices are low. That doesn’t mean there isn’t still room for appreciation, but you may need to temper your expectations for gains.
Finally, remember the OCR may not stay the “cheap rung” of the property ladder in the future. Prices in the stronger districts are already brushing up against RCR levels. If you currently live in the heartlands, and you want to upgrade to a private home in a familiar neighbourhood, it’s best not to assume the move will stay affordable, not for too long.
At Stacked, we like to look beyond the headlines and surface-level numbers, and focus on how things play out in the real world.
If you’d like to discuss how this applies to your own circumstances, you can reach out for a one-to-one consultation here.
And if you simply have a question or want to share a thought, feel free to write to us at stories@stackedhomes.com — we read every message.
3 Comments
“District 27 (Sembawang/Yishun) stands out with the highest increase at about 57.5 per cent. The addition of Canberra MRT (NSL) in 2019, the development of Bukit Canberra (a large integrated hub with sports, food, and community facilities), and the new Canberra Plaza are reshaping perceptions of the area. These upgrades are helping three-bedders in Canberra to shed the “budget” image once attached to Yishun, and the prices charged at the recently launched Canberra Crescent Residences reflect this confidence. “
It should be District 26 instead of District 27, as reflected from the table
I’m referring to the section under “ Average price of subsale and resale 3-bedders”
Thank you so much for pointing this out, Pebble! Really appreciate you catching that — apologies for the oversight on our part. We’ll make the correction shortly!