

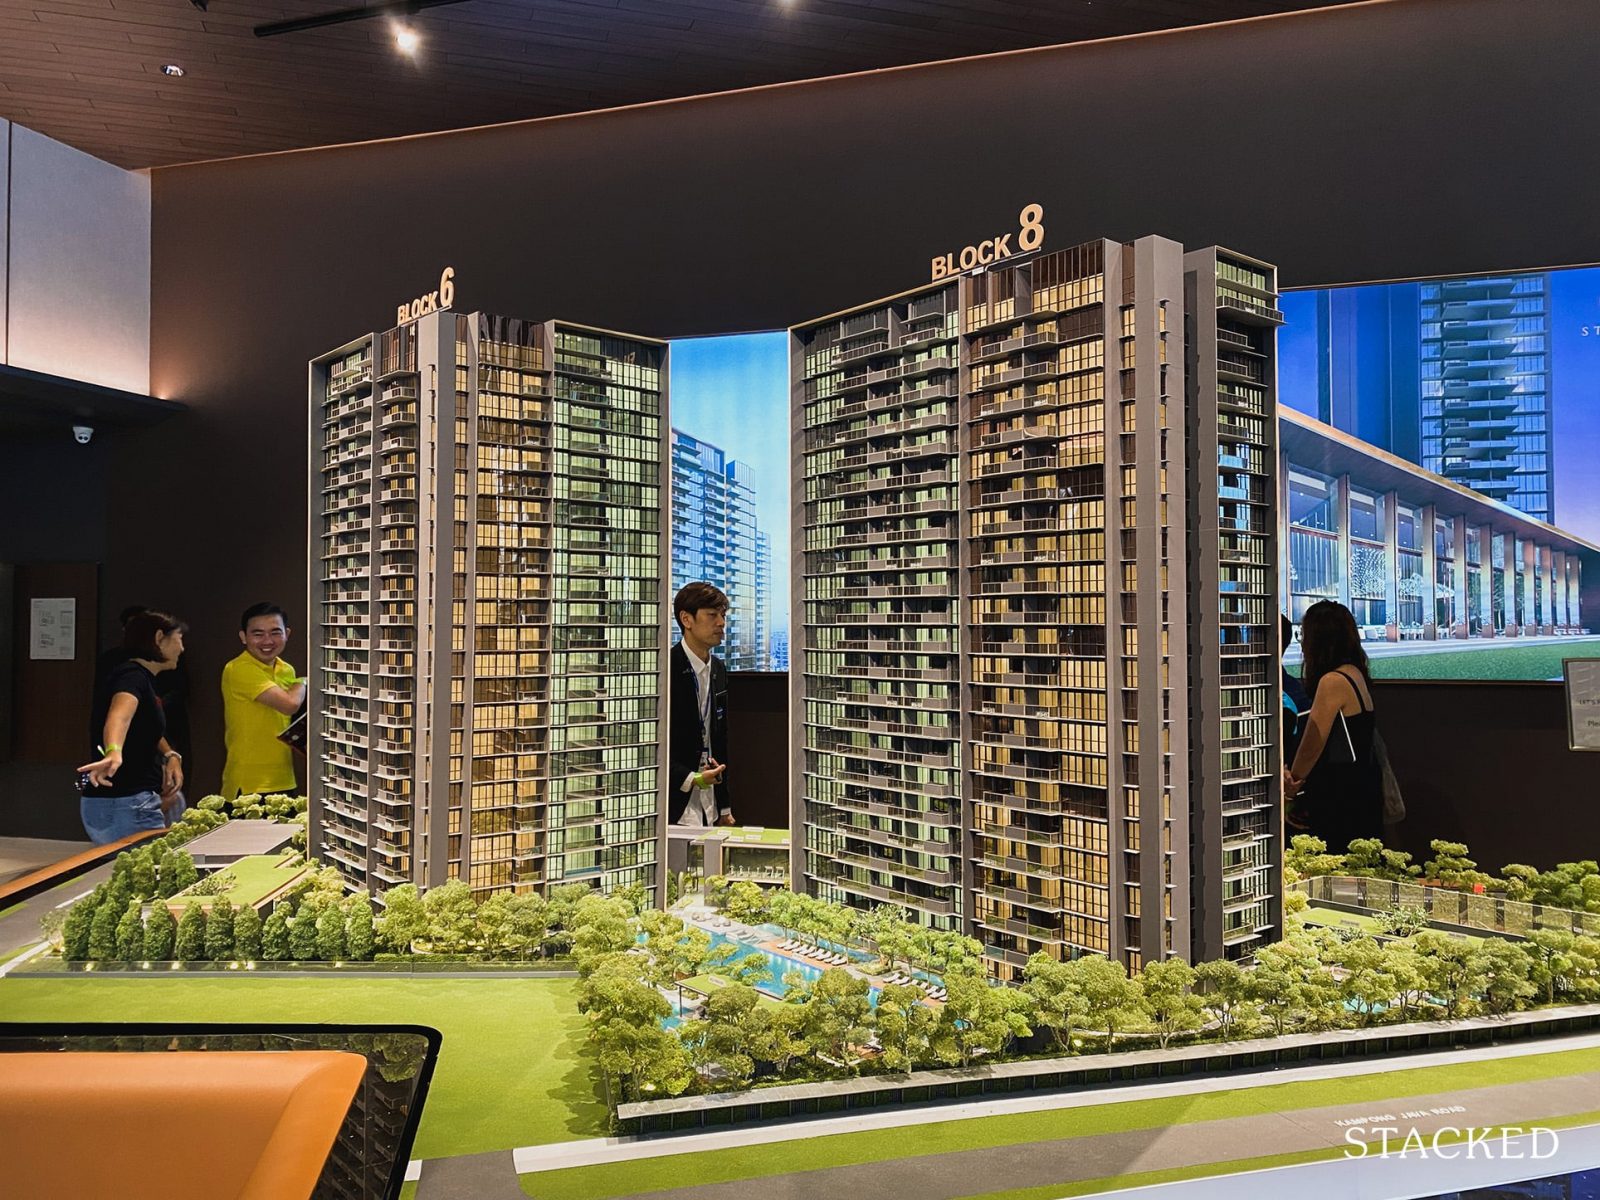
For new homeowners, singles, and investors, a one-bedroom condo is still the most popular unit type to look at. In a property market where price is a concern, and given higher stamp duties and a lower quantum, some buyers still believe in these smaller units.
However, whichever property agent that you bump into seems to be singing the same tune: if you are looking to invest in a one-bedder, buy a new launch condo.
So this week, we took a look at the gains of one-bedder condos of late; and tried to determine if it’s better to buy them as new or resale properties:
Note: For the following, we consider units of 600 sq. ft. and below to be one-bedders. While some developers have marketed 500 to 600 sq. ft. units as two-bedders, the market consensus on these units is that they’re suited to singles.
We will also be treating new-to-subsale units as being the same as resale. The sub sale distinction is less relevant as it is still a unit being sold on the secondary market.
The challenge for many buyers today isn't access to information.
It's interpreting that information in a way that makes sense for their finances, goals, and stage of life.
Over time, that's also why we decided to work with agents who shared the same data-driven and advisory-led approach behind our editorial, consultants who could help readers think through decisions more objectively, rather than simply push transactions.
Today, the team has worked with more than 2,000 clients across over $5B in property transactions.
One-bedder transactions since 2013
| Type of Transaction | Average Gains ($) | Average Gains (%) | Average ROI (%) | Average Holding Period | Volume |
| New Sale to Resale | $85,191 | 12.7% | 2.2% | 6.1 | 4,098 |
| Resale to Resale | $54,552 | 8.6% | 2.0% | 4.9 | 1,320 |
| Grand Total | 77,726 | 11.70% | 2.1% | 5.8 | 5,418 |
In a general sense, we can see an ROI of 2.1 per cent over a 5.8 year holding period. However, new-to-resale units seemed to perform significantly better in general, with higher gains over a shorter period.
But there are a few quirks to note. First, sellers in the new-to-resale category appear to have held on for longer than those in the resale-to-resale group. They also make up the vast majority of transactions, almost three times more than the resale-to-resale group. These sorts of details tend to hint at more complex issues, so we took a closer look again.
This time, we broke it down by specific year of purchase:
| Year bought | New Sale to Resale | Resale to Resale | Grand Total | Proportion New |
| 2013 | 1,132 | 83 | 1,215 | 93.17% |
| 2014 | 573 | 69 | 642 | 89.25% |
| 2015 | 559 | 98 | 657 | 85.08% |
| 2016 | 529 | 166 | 695 | 76.12% |
| 2017 | 444 | 283 | 727 | 61.07% |
| 2018 | 367 | 296 | 663 | 55.35% |
| 2019 | 346 | 148 | 494 | 70.04% |
| 2020 | 132 | 129 | 261 | 50.57% |
| 2021 | 16 | 48 | 64 | 25.00% |
| Grand Total | 4,098 | 1,320 | 5,418 |
Now some things become clearer. Most of the new-to-resale buyers here made their initial purchase in 2013 to 2014. Note that 2013 was the last market peak, and prices had only started to taper off the year after.
This explains why so many of the new-to-resale group had longer holding periods: they had bought at a high, and subsequently ran into a downturn. They then held and waited out the downturn, thus selling much later. Moreover, having bought in 2013 does skew the data as there's just more runway for them to hold onto it longer compared to someone who bought in 2020.
By contrast, the resale-to-resale buyers mostly made their purchases in 2017/18. This was during a trough period, by which time repeated cooling measures had lowered prices. In light of this, we should compare transactions by their year of purchase as well as holding period - this would also take into account market conditions.
| Gains (%) | ROI (%) | Volume | Holding Period (Years) | |||||
| Year | New Sale to Resale | Resale to Resale | New Sale to Resale | Resale to Resale | New Sale to Resale | Resale to Resale | New Sale to Resale | Resale to Resale |
| 2013 | 6.7% | -4.5% | 0.8% | -0.7% | 1132 | 83 | 7.7 | 7.9 |
| 2014 | 11.3% | 0.5% | 1.6% | -0.1% | 573 | 69 | 6.9 | 6.8 |
| 2015 | 17.9% | 4.2% | 2.8% | 0.5% | 559 | 98 | 6.1 | 6.5 |
| 2016 | 15.9% | 7.6% | 2.5% | 1.1% | 529 | 166 | 5.8 | 5.8 |
| 2017 | 14.1% | 8.4% | 2.5% | 1.7% | 444 | 283 | 5.2 | 4.7 |
| 2018 | 15.3% | 8.6% | 3.2% | 1.7% | 367 | 296 | 4.5 | 4.4 |
| 2019 | 16.3% | 12.9% | 3.8% | 3.0% | 346 | 148 | 4.1 | 3.7 |
| 2020 | 14.2% | 19.5% | 3.8% | 5.7% | 132 | 129 | 3.5 | 3.2 |
| 2021 | 11.4% | 14.8% | 3.7% | 5.1% | 16 | 48 | 2.9 | 2.7 |
| Grand Total | 12.7% | 8.7% | 2.2% | 2.0% | 3044 | 1327 | 6.1 | 4.9 |
From the above, you can see the holding period between new-to-resale and resale-to-resale is similar when you compare purchases within a particular year, so we can conclude it isn’t the holding period that’s affecting the gains.
Rather, it’s the new launch one-bedders between 2013 to 2019 that outperformed in terms of gains and ROI. Conversely, new launch one-bedders in 2020 to 2021 underperformed. You can also see that in 2020 and 2021, transaction volumes fell, showing 132 transactions and 16 transactions respectively.
To get a sense of why, we looked at the various projects involved. Let’s compare the new launches in 2020 to 2021, versus resale units:
New launch sales from 2020 to 2021
| Project | District | Average % | Average ROI | Volume |
| ONE BERNAM | 2 | 14.50% | 4.50% | 1 |
| STIRLING RESIDENCES | 3 | 17.70% | 4.70% | 7 |
| CLAVON | 5 | 18.2% | 4.9% | 1 |
| KENT RIDGE HILL RESIDENCES | 5 | 13.4% | 3.2% | 1 |
| NORMANTON PARK | 5 | 23.70% | 6.90% | 3 |
| PARC CLEMATIS | 5 | 20.30% | 5.30% | 2 |
| WHISTLER GRAND | 5 | 15.40% | 4.80% | 8 |
| MIDTOWN MODERN | 7 | 7.2% | 2.8% | 2 |
| THE M | 7 | 17.30% | 4.00% | 4 |
| KOPAR AT NEWTON | 9 | 12.7% | 3.0% | 2 |
| FOURTH AVENUE RESIDENCES | 10 | 0.2% | 0.1% | 1 |
| LEEDON GREEN | 10 | 2.4% | 1.4% | 1 |
| PULLMAN RESIDENCES NEWTON | 11 | 9.90% | 2.80% | 1 |
| VERTICUS | 12 | 3.30% | 1.00% | 1 |
| THE TRE VER | 13 | 8.90% | 5.60% | 2 |
| THE WOODLEIGH RESIDENCES | 13 | 19.00% | 5.50% | 3 |
| PARC ESTA | 14 | 11.70% | 3.20% | 5 |
| PENROSE | 14 | 11.40% | 3.20% | 4 |
| REZI 24 | 14 | 4.30% | 1.20% | 1 |
| 77 @ EAST COAST | 15 | 18.3% | 5.4% | 1 |
| AMBER PARK | 15 | 11.7% | 3.6% | 1 |
| COASTLINE RESIDENCES | 15 | 12.3% | 3.6% | 1 |
| NYON | 15 | 10.70% | 3.00% | 1 |
| SEASIDE RESIDENCES | 15 | 15.40% | 4.40% | 3 |
| THE TAPESTRY | 18 | 9.20% | 2.70% | 2 |
| TREASURE AT TAMPINES | 18 | 14.00% | 3.60% | 25 |
| AFFINITY AT SERANGOON | 19 | 9.5% | 2.5% | 8 |
| RIVERFRONT RESIDENCES | 19 | 15.50% | 4.30% | 11 |
| SENGKANG GRAND RESIDENCES | 19 | 15.90% | 4.20% | 1 |
| THE FLORENCE RESIDENCES | 19 | 10.50% | 2.70% | 16 |
| THE GARDEN RESIDENCES | 19 | 7.20% | 1.90% | 5 |
| JADESCAPE | 20 | 18.3% | 4.5% | 10 |
| FORETT AT BUKIT TIMAH | 21 | 2.0% | 0.7% | 1 |
| MAYFAIR MODERN | 21 | 17.5% | 4.7% | 4 |
| THE LINQ @ BEAUTY WORLD | 21 | 26.90% | 8.70% | 2 |
| VERDALE | 21 | 13.30% | 3.60% | 2 |
| BUKIT 828 | 23 | 8.9% | 2.2% | 1 |
| MIDWOOD | 23 | 20.1% | 6.6% | 3 |
Resale units from 2020 to 2021
| Projects | Gains (%) | ROI (%) | Volume |
| RIPPLE BAY | 36.9% | 10.6% | 2 |
| EMPRADO SUITES | 36.7% | 15.3% | 1 |
| THE MILTONIA RESIDENCES | 33.0% | 6.9% | 1 |
| VENTURA VIEW | 32.8% | 14.5% | 1 |
| PARC ROSEWOOD | 30.6% | 8.2% | 2 |
| THE ESTUARY | 29.7% | 8.2% | 5 |
| SUITES @ TOPAZ | 27.4% | 7.4% | 1 |
| PALM ISLES | 27.4% | 9.4% | 4 |
| NATURA@HILLVIEW | 26.5% | 8.1% | 1 |
| NESS | 26.0% | 8.0% | 1 |
| SEASTRAND | 25.3% | 7.8% | 2 |
| THE INFLORA | 25.2% | 7.2% | 5 |
| PRESTIGE LOFT | 25.2% | 10.8% | 1 |
| MELOSA | 25.1% | 7.5% | 1 |
| RIVERBANK @ FERNVALE | 24.0% | 6.5% | 2 |
| SUITES @ SIMS | 23.6% | 7.9% | 1 |
| SKIES MILTONIA | 23.6% | 6.9% | 2 |
| AIRSTREAM | 23.1% | 6.5% | 1 |
| SUITES 123 | 23.0% | 6.1% | 1 |
| SEAHILL | 22.8% | 8.1% | 2 |
| SPAZIO @ KOVAN | 22.8% | 6.6% | 1 |
| SUITES @ PAYA LEBAR | 22.7% | 6.6% | 3 |
| STRATUM | 22.3% | 6.2% | 2 |
| COCO PALMS | 22.0% | 6.0% | 1 |
| HIGH PARK RESIDENCES | 21.8% | 5.7% | 3 |
| THE ODEON KATONG | 21.8% | 5.6% | 1 |
| ONE DUSUN RESIDENCES | 21.8% | 6.2% | 2 |
| 28 IMPERIAL RESIDENCES | 21.8% | 6.2% | 3 |
| THE POIZ RESIDENCES | 20.9% | 6.1% | 1 |
| VIENTO | 20.9% | 7.2% | 2 |
| D'NEST | 20.5% | 6.0% | 2 |
| PARC ELEGANCE | 20.4% | 5.6% | 1 |
| LA FIESTA | 20.0% | 5.2% | 1 |
| KINGSFORD WATERBAY | 19.9% | 5.5% | 2 |
| REZI 26 | 19.7% | 5.3% | 1 |
| TREASURES @ G20 | 19.6% | 8.1% | 1 |
| THE SANTORINI | 19.4% | 5.6% | 2 |
| VIBES @ EAST COAST | 19.3% | 7.3% | 1 |
| RIVERSAILS | 19.3% | 5.7% | 1 |
| NAUNG RESIDENCE | 19.2% | 4.5% | 1 |
| PAVILION SQUARE | 19.0% | 5.4% | 1 |
| TERRENE AT BUKIT TIMAH | 19.0% | 5.1% | 1 |
| THE VERVE | 18.7% | 5.9% | 1 |
| LE REGAL | 18.6% | 4.7% | 1 |
| SKY VUE | 18.5% | 5.6% | 1 |
| SIMS URBAN OASIS | 18.4% | 5.3% | 9 |
| BOTANIQUE AT BARTLEY | 18.4% | 5.6% | 1 |
| THE MINTON | 18.0% | 4.9% | 3 |
| SKYSUITES17 | 18.0% | 5.5% | 1 |
| STADIA | 18.0% | 5.2% | 1 |
| THOMSON V TWO | 17.8% | 4.4% | 1 |
| THE MEZZO | 17.2% | 4.8% | 1 |
| THE HILLFORD | 17.2% | 5.7% | 6 |
| EUHABITAT | 17.0% | 5.2% | 7 |
| VACANZA @ EAST | 16.9% | 5.3% | 1 |
| THE CASCADIA | 16.5% | 5.1% | 1 |
| HILLSTA | 16.4% | 5.7% | 4 |
| EASTWOOD REGENCY | 16.4% | 4.7% | 1 |
| THE CLIFT | 16.1% | 4.6% | 1 |
| EDENZ SUITES | 16.1% | 4.8% | 1 |
| COMMONWEALTH TOWERS | 16.0% | 4.6% | 4 |
| RIVERBAY | 15.9% | 4.3% | 1 |
| URBAN VISTA | 15.9% | 4.8% | 3 |
| JEWEL @ BUANGKOK | 15.7% | 4.9% | 2 |
| THE PALETTE | 15.7% | 4.8% | 1 |
| RIVERTREES RESIDENCES | 15.6% | 4.9% | 1 |
| EIGHT RIVERSUITES | 15.5% | 4.5% | 2 |
| SPACE @ KOVAN | 15.0% | 4.6% | 1 |
| JUPITER 18 | 15.0% | 4.1% | 1 |
| THE GLADES | 15.0% | 4.1% | 3 |
| ONE SHENTON | 14.9% | 5.6% | 3 |
| RESIDENCES 88 | 14.8% | 4.6% | 2 |
| PINNACLE 16 | 14.7% | 4.5% | 1 |
| WATERTOWN | 14.6% | 5.0% | 3 |
| CENTRA RESIDENCE | 14.4% | 4.4% | 1 |
| Q BAY RESIDENCES | 14.3% | 6.9% | 1 |
| FORESQUE RESIDENCES | 13.9% | 3.9% | 1 |
| ONE-NORTH RESIDENCES | 13.8% | 4.0% | 1 |
| THE PANORAMA | 13.5% | 4.2% | 1 |
| VIBES @ KOVAN | 13.3% | 4.0% | 1 |
| NOTTINGHILL SUITES | 13.2% | 3.9% | 2 |
| CARDIFF RESIDENCE | 13.0% | 3.9% | 1 |
| SKY GREEN | 12.7% | 4.1% | 1 |
| SOLEIL @ SINARAN | 12.6% | 3.5% | 1 |
| THE NAUTICAL | 12.3% | 5.2% | 1 |
| SPOTTISWOODE 18 | 12.0% | 3.7% | 2 |
| CENTRA LOFT | 11.6% | 3.7% | 1 |
| SUITES @ KOVAN | 11.4% | 3.7% | 1 |
| # 1 SUITES | 10.8% | 3.5% | 1 |
| SKYSUITES@ANSON | 10.5% | 3.3% | 1 |
| 38 I SUITES | 10.4% | 2.7% | 1 |
| STRATA | 10.4% | 2.6% | 1 |
| CENTRA HEIGHTS | 10.3% | 3.3% | 1 |
| PARC IMPERIAL | 10.2% | 4.1% | 1 |
| VIVACE | 10.1% | 4.3% | 1 |
| HILLION RESIDENCES | 9.6% | 3.1% | 1 |
| THE HILLIER | 9.1% | 3.3% | 2 |
| HERITAGE EAST | 8.1% | 4.0% | 1 |
| GUILLEMARD EDGE | 7.9% | 5.9% | 2 |
| RV EDGE | 5.7% | 1.6% | 1 |
| ROBERTSON EDGE | 4.0% | 2.0% | 1 |
| THE SHORE RESIDENCES | 3.4% | 2.5% | 1 |
| J GATEWAY | 2.7% | 1.1% | 1 |
| EIS RESIDENCES | 1.7% | 2.8% | 1 |
| SKYLINE RESIDENCES | 1.0% | 0.3% | 1 |
| THE FORESTA @ MOUNT FABER | -14.7% | -13.4% | 1 |
The average gain of new sale condos is 13.9 per cent. Among resale condos, there were a lot more transactions (143 out of 177 transactions were resale) that outperformed the new sale condos average. Speculatively, this could be due to new launch prices spiking from 2020 to 2021, in the aftermath of Covid. This could have made older and more affordable resale condos more attractive.
To determine this, we looked at the price breakdown:
| New Sale to Resale | Resale to Resale | ||||||
| Year Bought | Average Buy Price | Average Sell Price | Difference | Average Buy Price | Average Sell Price | Deviation between resale to new | |
| 2013 | $719,746 | $758,216 | 5.3% | $846,574 | $805,876 | -4.8% | 6.29% |
| 2014 | $653,379 | $720,757 | 10.3% | $771,684 | $773,707 | 0.3% | 7.35% |
| 2015 | $654,035 | $761,913 | 16.5% | $723,371 | $753,788 | 4.2% | -1.07% |
| 2016 | $707,973 | $816,186 | 15.3% | $770,972 | $814,851 | 5.7% | -0.16% |
| 2017 | $782,162 | $886,306 | 13.3% | $732,140 | $785,113 | 7.2% | -11.42% |
| 2018 | $763,706 | $876,709 | 14.8% | $725,905 | $784,300 | 8.0% | -10.54% |
| 2019 | $790,593 | $917,097 | 16.0% | $688,819 | $770,792 | 11.9% | -15.95% |
| 2020 | $848,773 | $970,698 | 14.4% | $653,987 | $777,268 | 18.9% | -19.93% |
| 2021 | $1,038,663 | $1,153,188 | 11.0% | $697,956 | $795,264 | 13.9% | -31.04% |
| Average | $722,065 | $807,256 | 11.8% | $730,499 | $785,051 | 7.5% | |
Notice that the price gap saw the biggest deviations between 2019 to 2021 (last column to the right). Higher new launch prices tend to mean less room for appreciation. Resale prices, on the other hand, look as if they may even have been undervalued if they were purchased at the time.
This may be related to pandemic restrictions, which could have an impact on resale viewings. Buyers of resale units typically want to inspect the place first, but the ability to do this was significantly hampered by Covid controls. The new launch segment, however, managed to shrug this off as new launches would have a lot more marketing material to view online beyond the physical show flat.
Could there have been more distressed sellers of new launch properties?
The pandemic period (2020 to 2021) could also have seen a greater number of fire sales. These are sellers offloading their properties due to the fear of what may happen in the market, along with the other usual reasons such as a change in financial situation, mortgagee sales, re-investment plans, etc.
In some of these cases, the seller may have liquidated their unit within the first three years of purchasing it. This would trigger an added tax, in the form of the Sellers Stamp Duty (SSD).
From 2016 onward, the SSD was 12 per cent if you sell within one year of buying, eight per cent in the second year, and four per cent in the third year. However, note that the SSD was 14, 12, 8, and 4 per cent respectively between 2013 to 2016.
Logically, someone who sells within the SSD period must be doing so out of urgency since nobody wants to pay this tax.
To determine if new launch buyers in 2020-21 fell in this category, we took a look at the transactions that took place within the SSD period and compared it with those that took place outside of it - for both new and resale:
| For new to resale | ||
| SSD Period | Average of % | Volume |
| After SSD | 14.3% | 125 |
| Within SSD | 11.2% | 7 |
| Grand Total | 14.2% | 132 |
For new-to-resale, only seven transactions occurred within the SSD period; unsurprising as we also saw above that longer holding periods were common among this group.
Now, let’s look at the count for resale-to-resale transactions:
| SSD Period | Average of % | Volume |
| After SSD | 19.3% | 147 |
| Within SSD | 12.8% | 30 |
| Grand Total | 18.2% | 177 |
There’s a greater proportion of resale-to-resale transactions which occurred within the SSD period; and the impact on gains is even more substantial versus the new-to-resale crowd. Even so, the resale-to-resale crowd still saw better overall returns, despite more of them being affected by the SSD. This is likely due to resale units simply being bought at a lower quantum, and having more room for gains.

Overall, there’s a tendency for those who buy new launch one-bedders to hold for longer periods (about two years longer on average). And we should point out that, for those who were patient enough to keep waiting (the market started to bounce back after 2016), the longer wait would have resulted in better gains. For this group, it’s the holding period - and not so much buying new - that accounted for their better results.
The results suggest that the idea of buying new isn’t in itself a sure-win formula for investing in one-bedders. Buying a resale unit at a lower quantum may balance this out, or even result in better savings, if the price disparity between new launches and resale units are at a peak.
For more on the property market, and its common beliefs and misconceptions, follow us on Stacked.
At Stacked, we like to look beyond the headlines and surface-level numbers, and focus on how things play out in the real world.
If you'd like to discuss how this applies to your own circumstances, you can reach out for a one-to-one consultation here.
And if you simply have a question or want to share a thought, feel free to write to us at stories@stackedhomes.com. We read every message.





1 Comments
Keep up the good analysis and insight — one bedder thesis !