


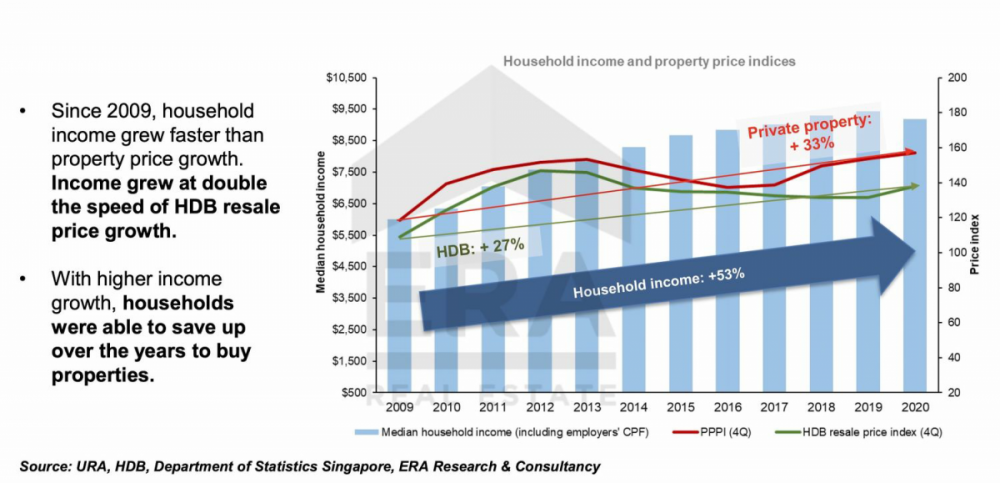
A post on Reddit reported that since 2009, household income has outpaced the rise in property prices, which precipitated rave online comments on the credibility of the report.
It’s an intriguing stat, isn’t it? Does this explain why property prices have risen the way they have despite the pandemic?
After all, property prices have been soaring since late last year and have not shown signs of abating. The recent bullish land bids arising from developers’ dwindling land bank and land scarcity are likely to push prices further north in the coming years. Yet, demand from home buyers remains robust as evidenced by the strong sales from the new launches. To some, this is surprising and even generated rife speculation of fresh cooling measures on the ground.
Naturally, I was curious too if this meant more Singaporeans have really become “crazy rich Asians” overnight, especially those in the lower-income deciles as well. So today, my aim is to explore whether the growth in household income really has been supporting the rise in property prices:
So many readers write in because they're unsure what to do next, and don't know who to trust.
If this sounds familiar, we offer structured 1-to-1 consultations where we walk through your finances, goals, and market options objectively.
No obligation. Just clarity.
Learn more here.
Notes on this review
Before I present the findings, let me highlight a few points on how this study was conducted.
- The average household income (HHI) / HHI per household member was used, as it gives a more precise value by taking into account every value in the sample group, as compared to median values.
- The private property price index (PPI) from 2010 to 2020 was adopted, with data from 1Q 2009 as the base (i.e. 100).
- Data for the analyses were sourced from SingStat Table Builder and “Singapore Key Household Income Trends, 2020” that was published by the Department of Statistics.
Key findings
I’ve gathered some key findings based on the insights that I gleaned from the data and have summarised them as follows:
- Over the past decade from 2010 to 2020, the average HHI from work and HHI per member have outpaced the growth in property prices, although the pace of increase was marginal for those in the lower deciles (1st to 40th deciles) as compared to those in the higher deciles.
- In 2020, resident employed households in all income groups saw declines in average HHI from work per household member amidst the economic downturn caused by the COVID-19 pandemic. Thus, the year 2020’s price affordability ratio stands out as it captures the first decline in household income in over a decade.
- Private properties (excluding executive condominiums) are large ticket items and a few percentage growth could mean an increase of tens or hundreds of thousands of dollars. Further, as they constitute around 25% of the total residential stock in Singapore, they may have only been accessible to the top 30% of earners.
Average HHI and HHI per household member saw decent growth over the past 10 years
“Money no enough” is a colloquial grouse amongst Singaporeans made popular by Jack Neo’s titular hit comedy in the late 90s, which resonated with most of us as it fittingly portrayed the ever-rising cost of living that we are constantly grappling with.
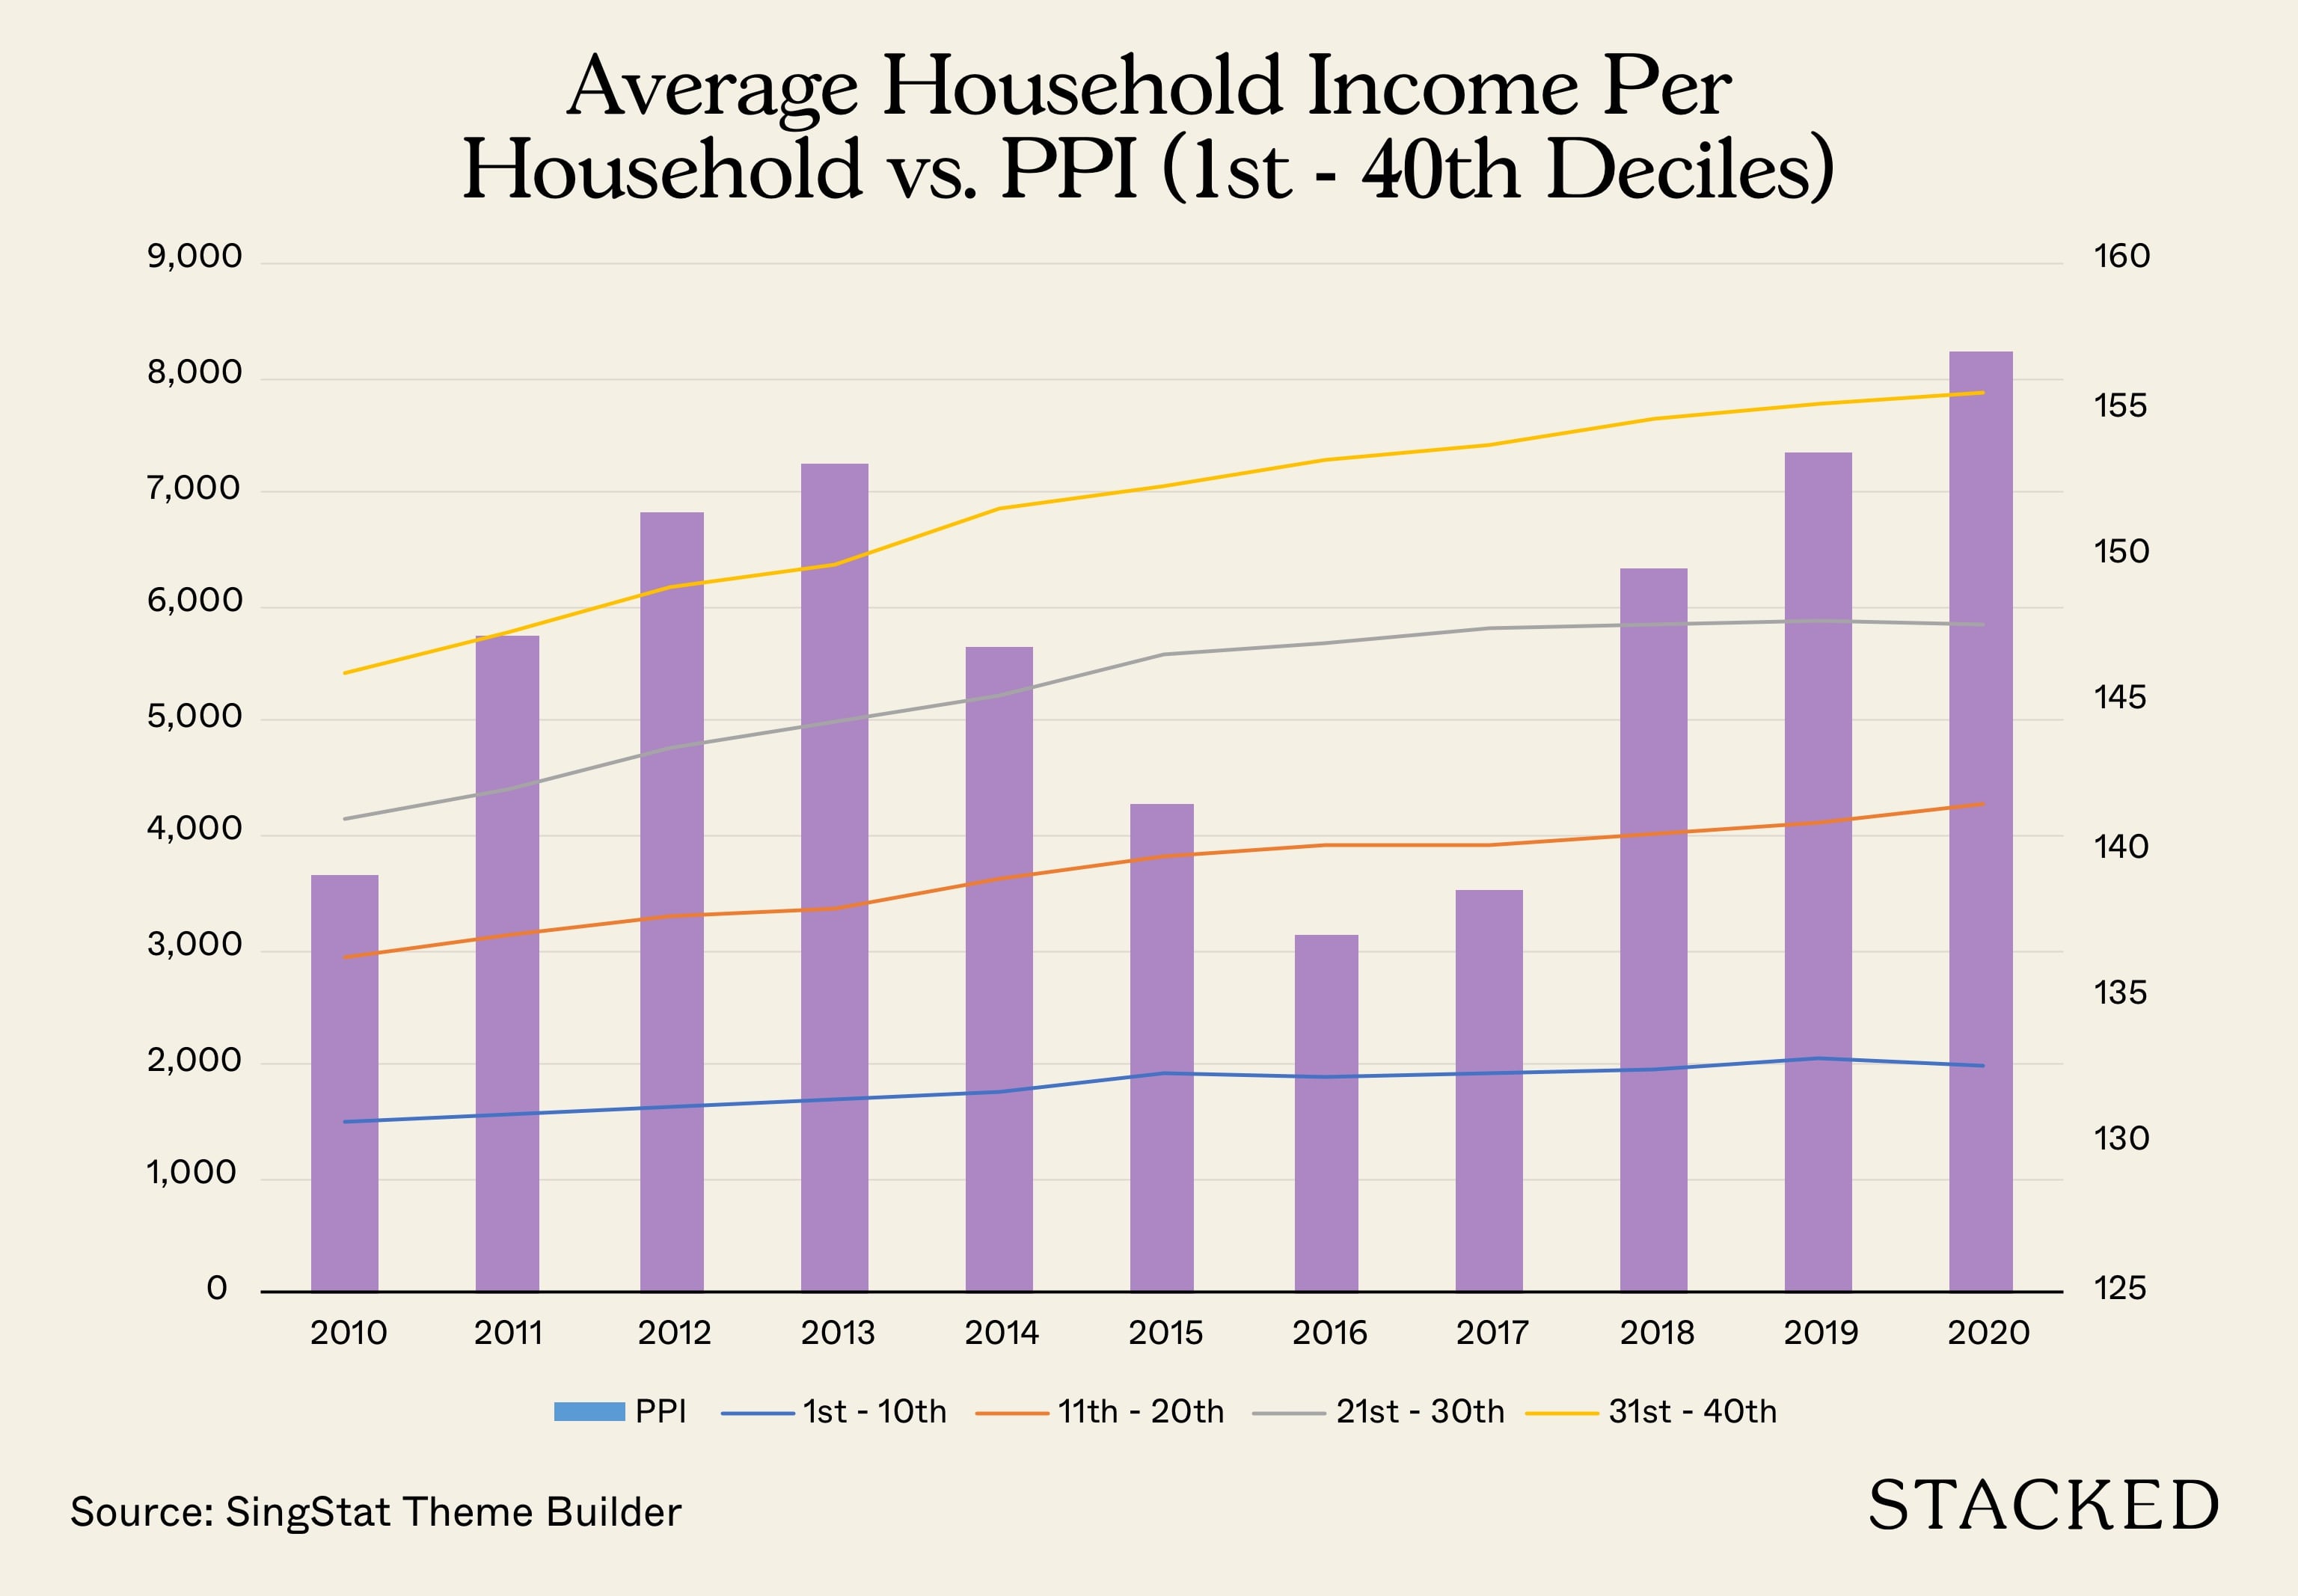
While this is the prevailing sentiment, the numbers do paint a different picture as shown by Figure 1, which shows the average HHI and average HHI per household member climbing steadily across all deciles between 2010 and 2019 (except 2020, which saw a decline), in line with property price growth (i.e. the yellow bars).
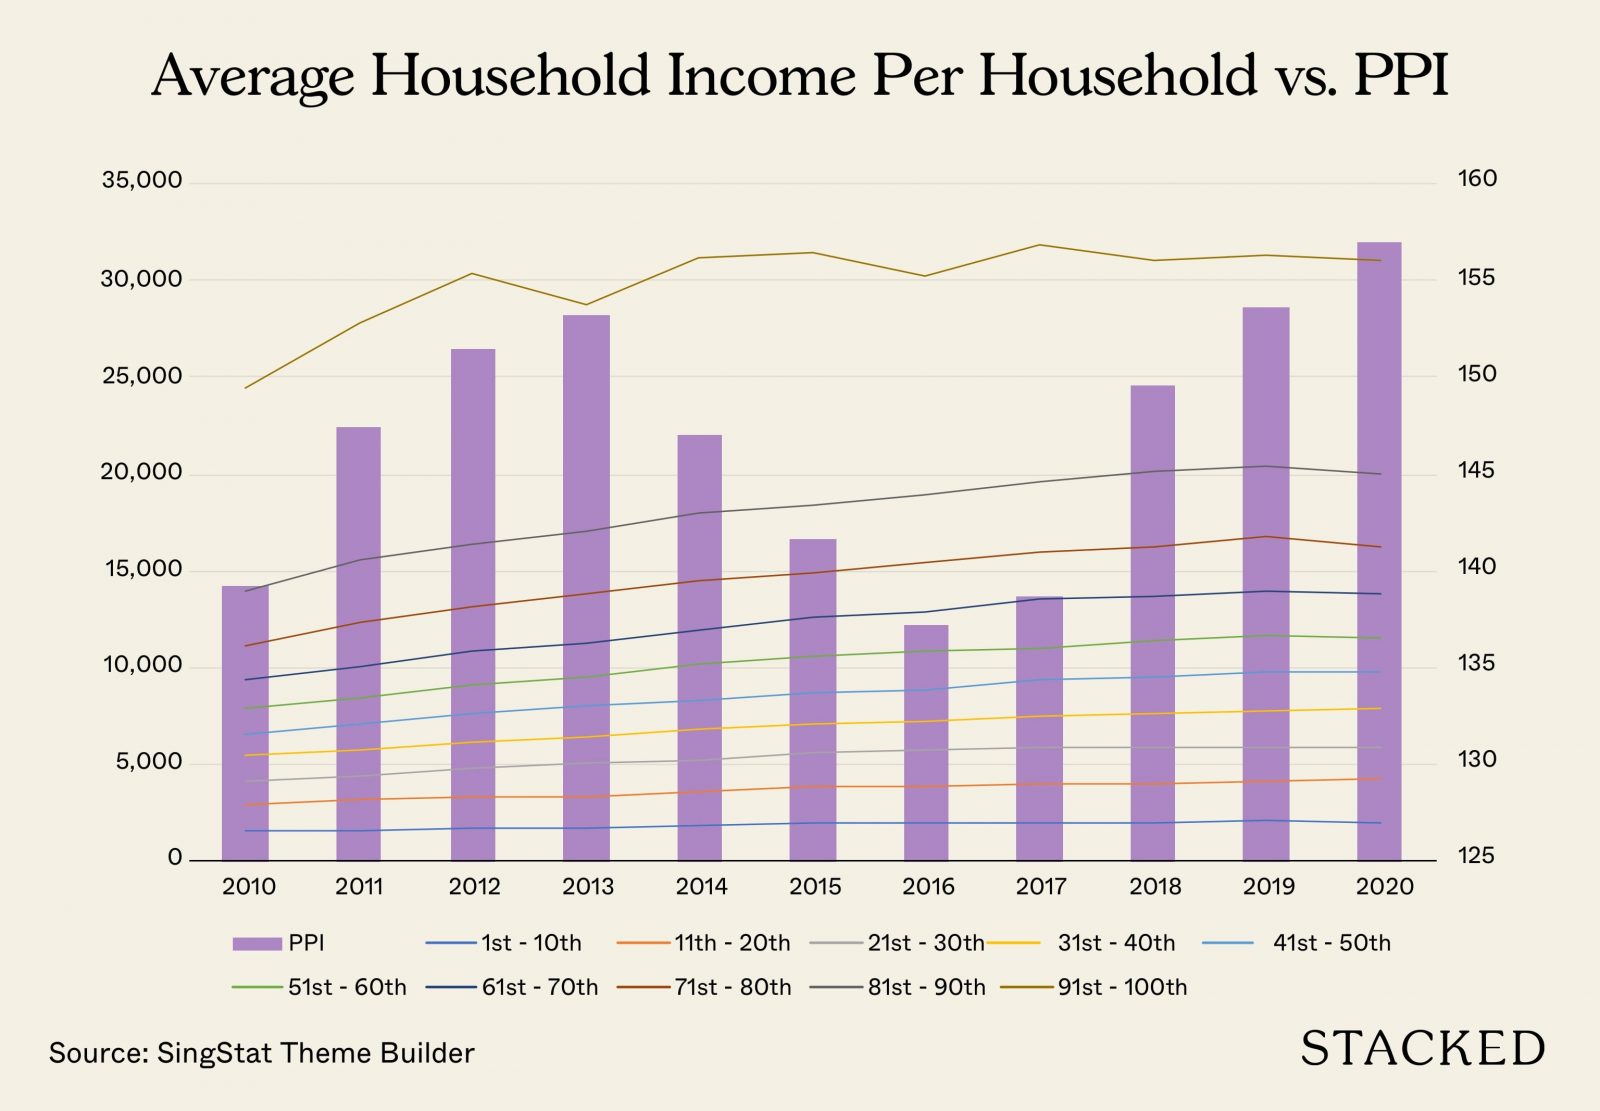
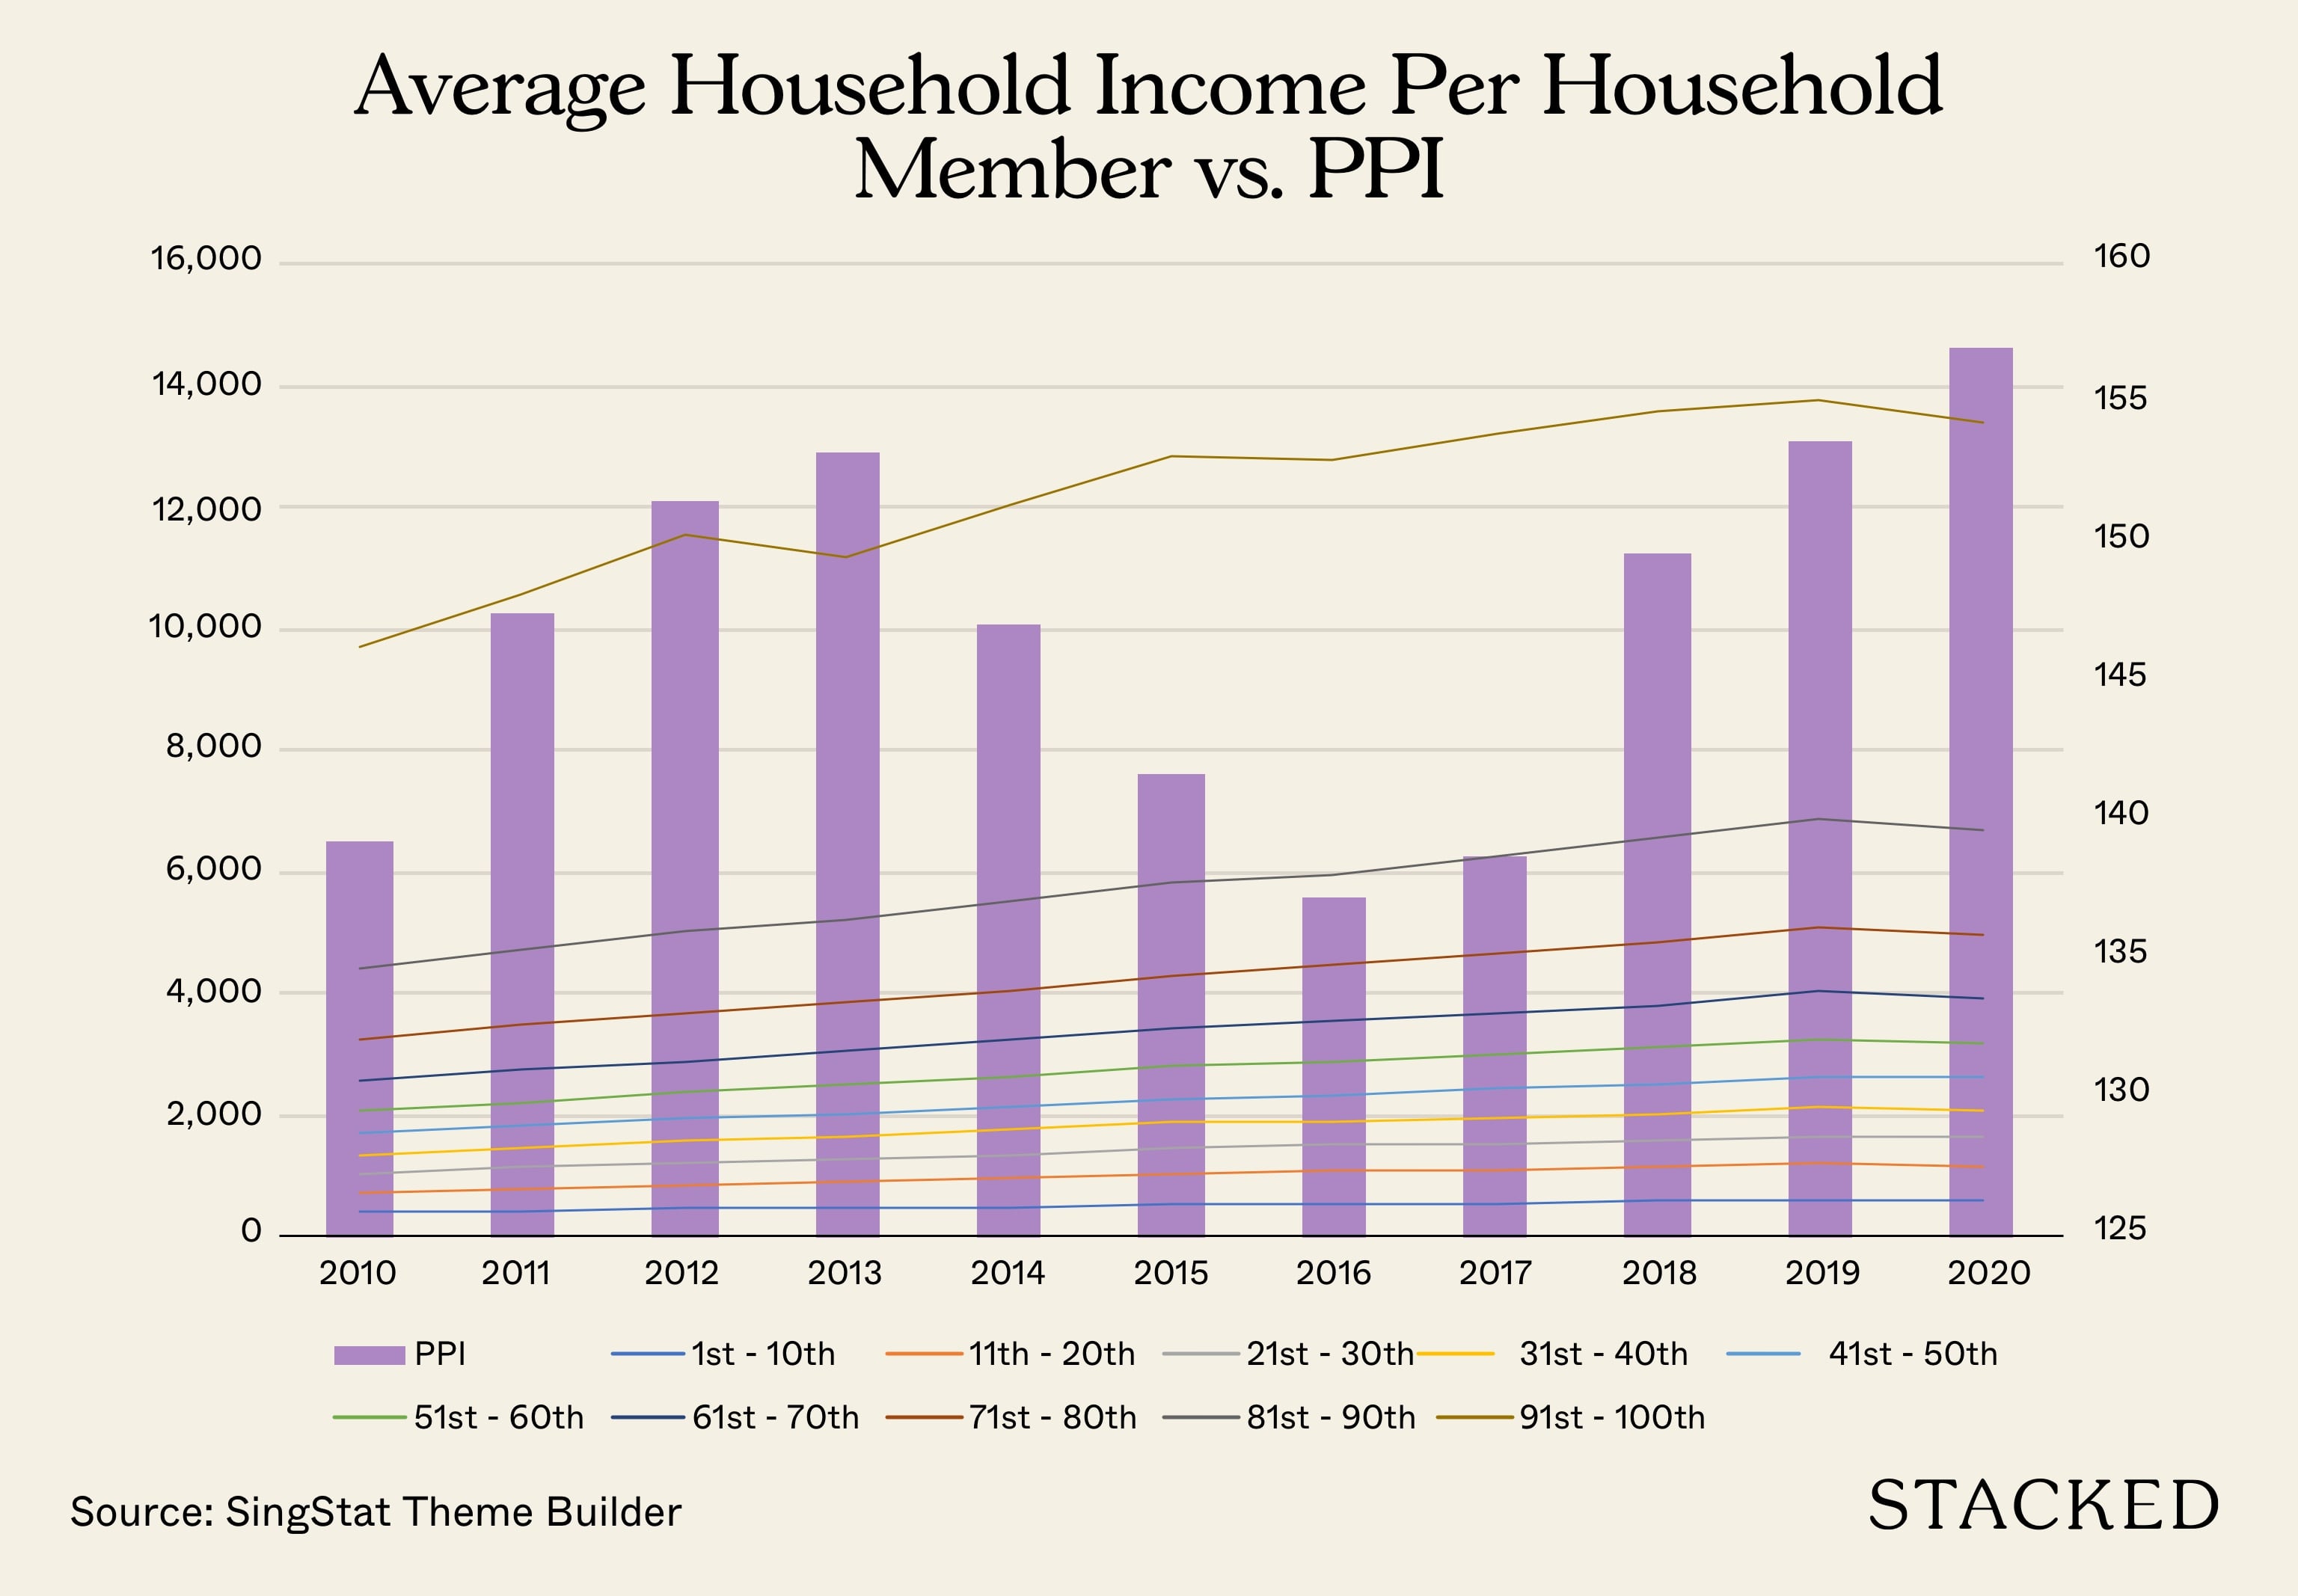
(Source: SingStat Table Builder, Tables 14A and 15A)
However, you can see that the rate of increase for household income and household income per household member is modest for those in the lower-income deciles (i.e. 1st to 40th deciles) as compared to those in the higher income deciles. In fact, the gradient for these groups was almost flat for those in the 1st to 20th deciles (please see Figure 2 below). While there have been generous government transfers especially for last year, the trend suggests that there are still segments in our society where their aspirations for private homeownership remain a distant goal.
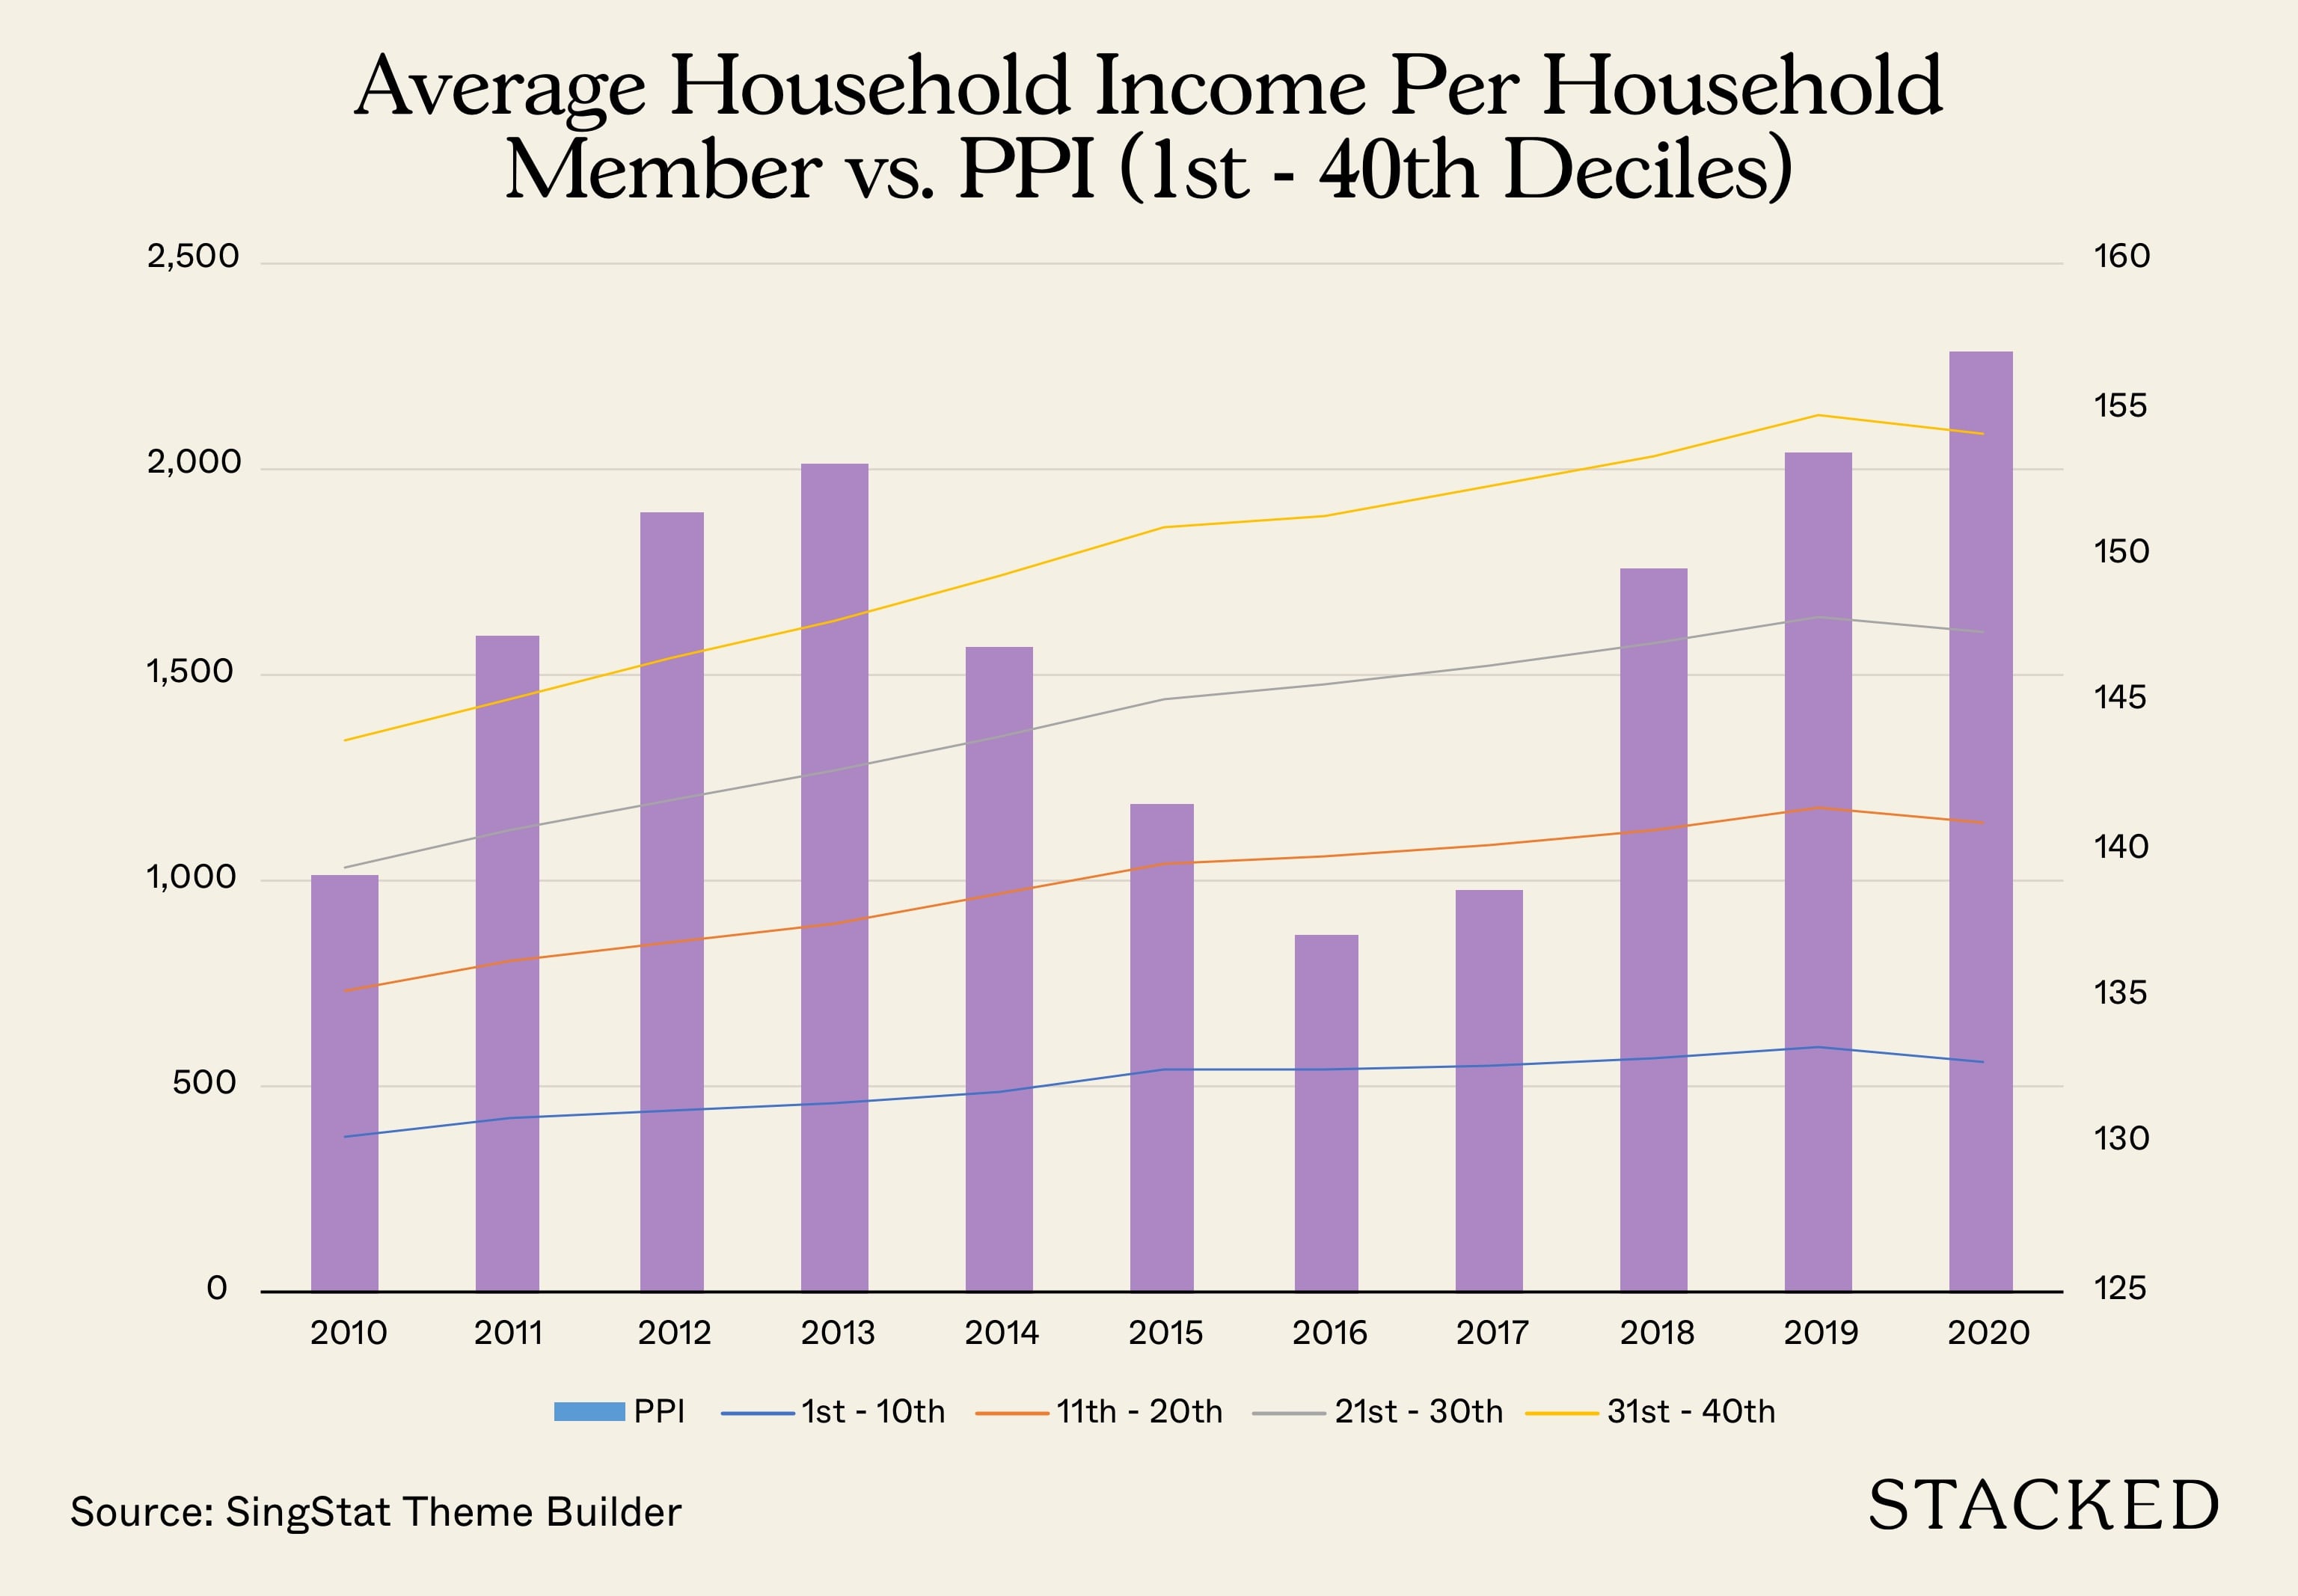
(Source: SingStat Table Builder, Tables 14A and 15A)
The first decline in household income puts the price affordability ratio in the spotlight
2020 was a watershed moment in our nation’s history and perhaps the world as well. Jobs were displaced and corporations wounded up in a span of months, which triggered an unprecedented series of budget stimulus measures from our Government in a single year to keep our economy afloat.
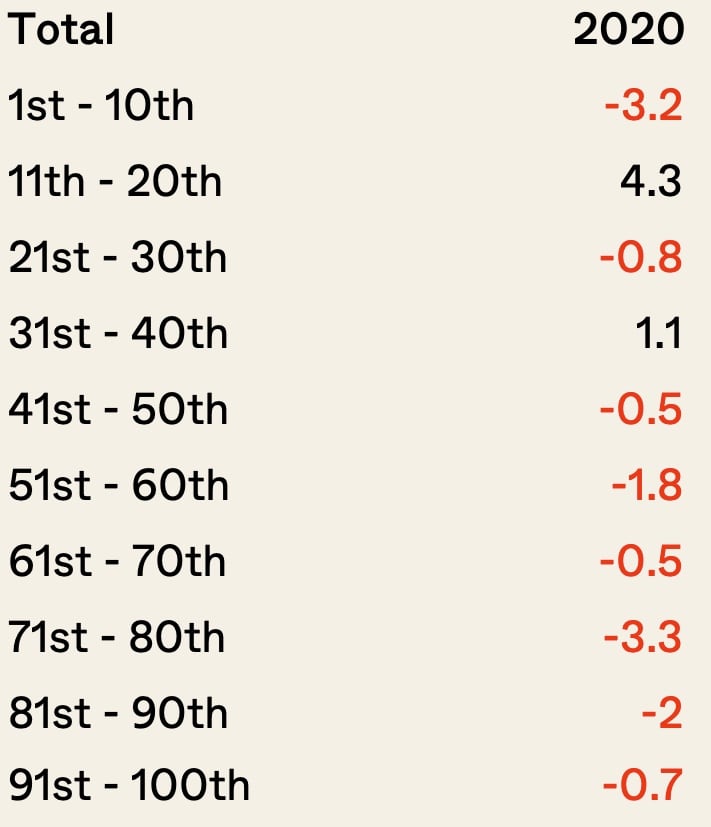
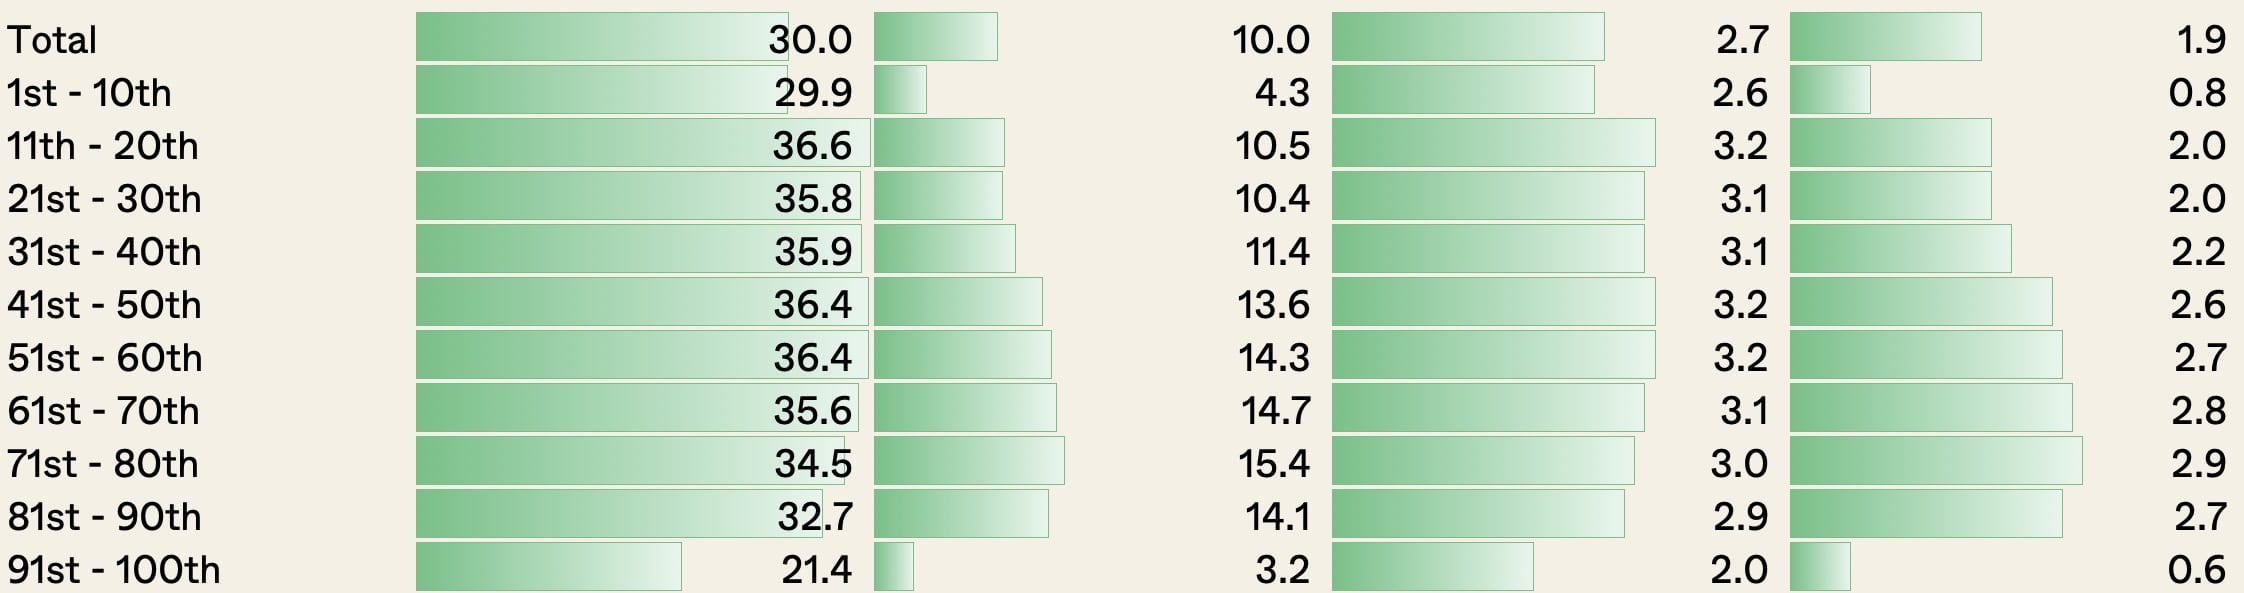
It was also the first time since household income data was compiled that we saw a decline in household income and household income per household member across almost all deciles (please see Table 1 below), which underscored the severity of the impact brought by the pandemic.
Conversely, the PPI climbed from 153.6 in 2019 to 157.0 in 2020 (i.e. 2.2% increase). This widens the price-to-affordability ratio from 14.7 in 2019 to 15.4 in 2020 (i.e. 4.8% spike) as reported by the Business Times, which effectively means a household has to save for at least 15.4 years to be able to purchase a new condo unit.
Private properties’ price growth are more aligned with those in the higher income deciles
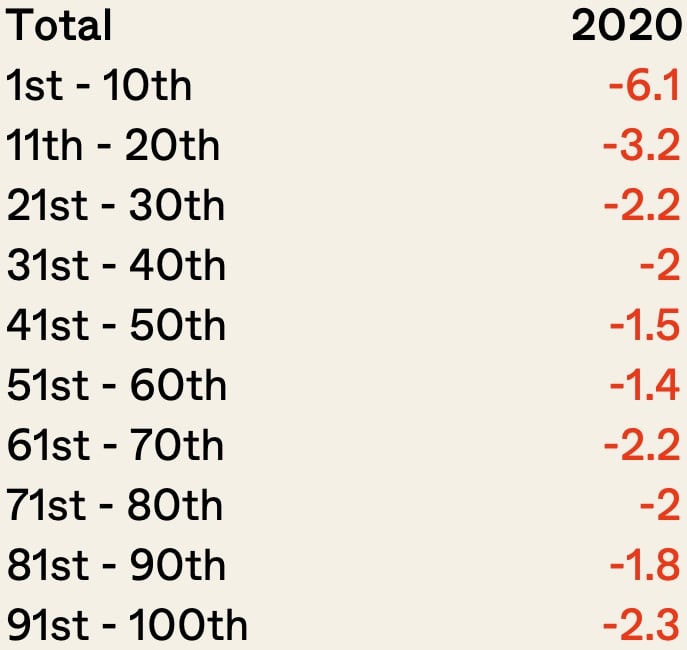
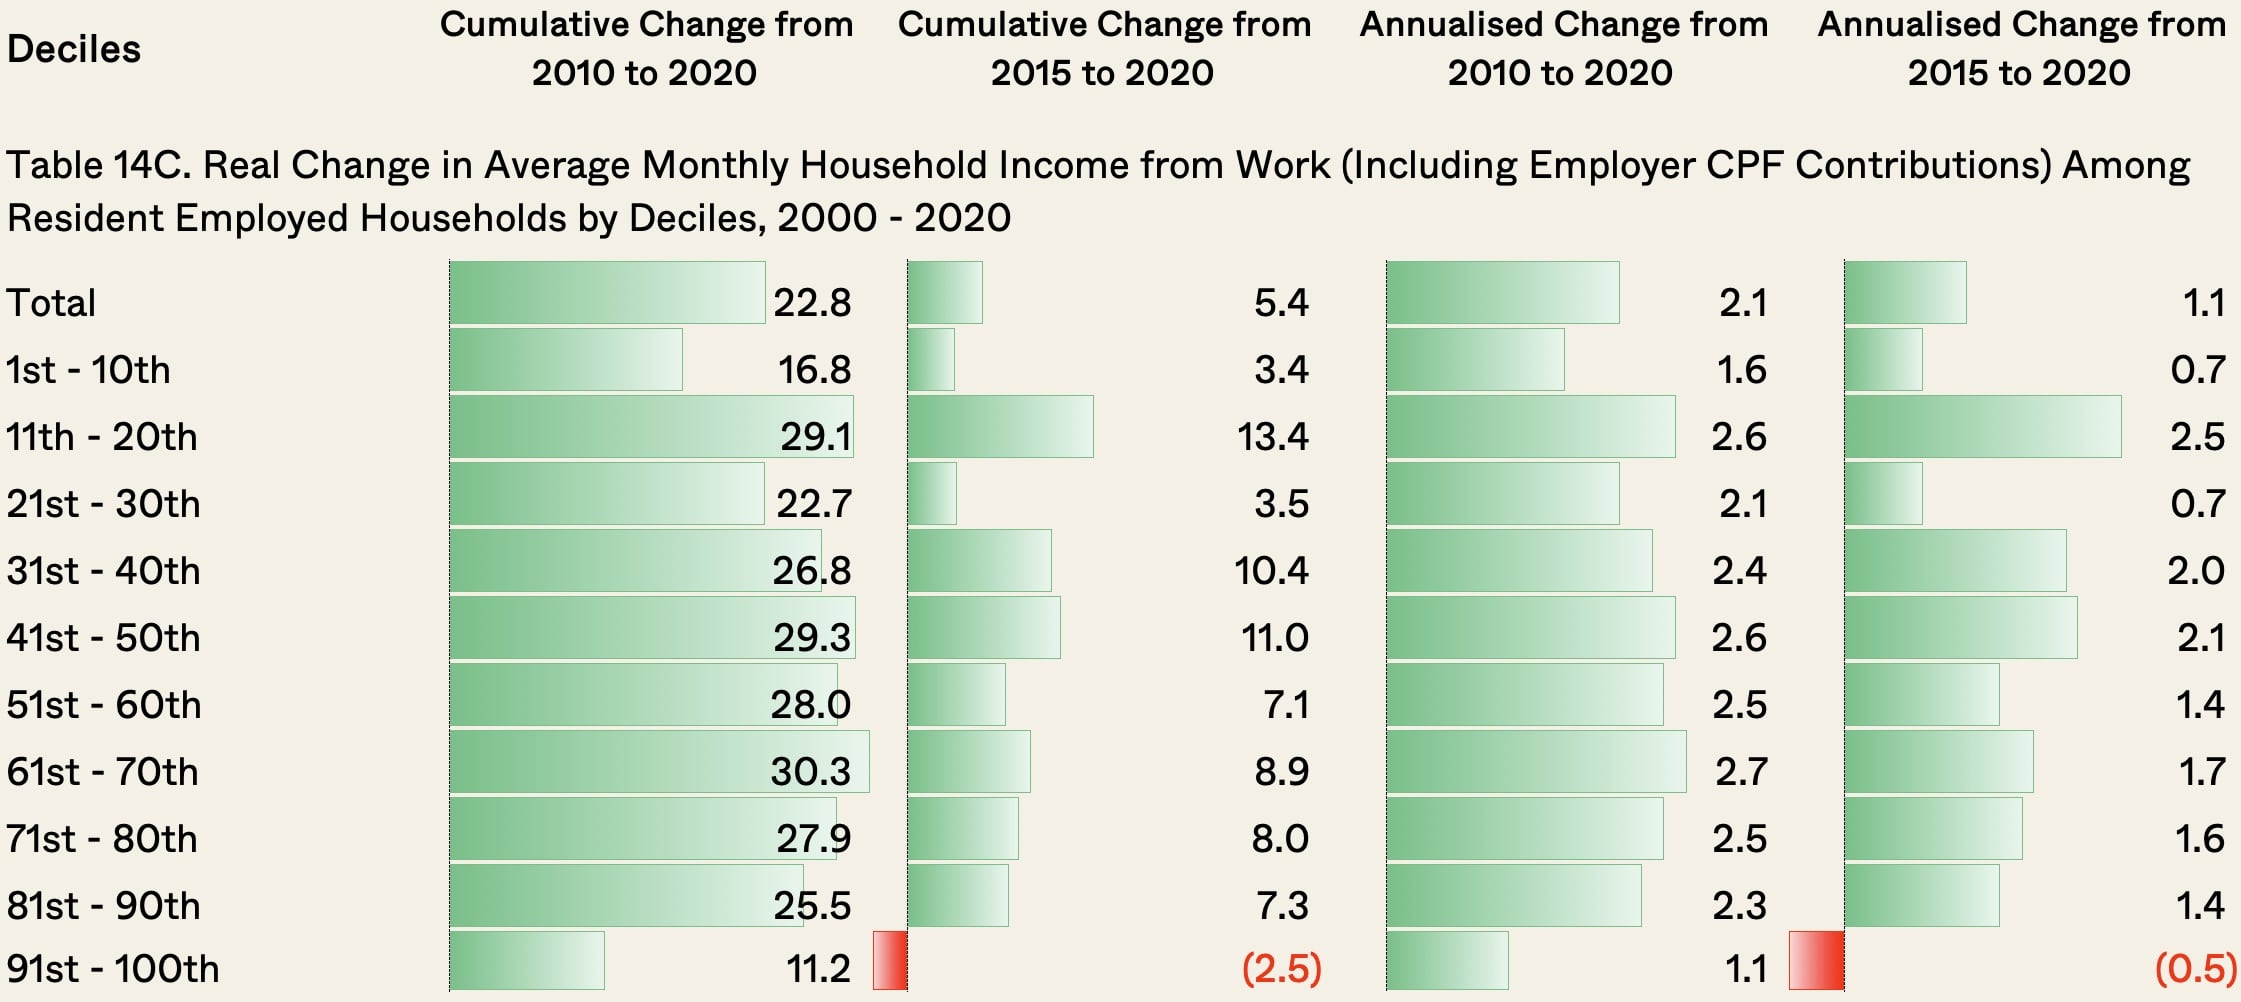
As I mentioned in the earlier section, households and their members saw decent growth in their incomes in the last decade. However, as properties are large ticket items, its obvious that those in the higher income deciles (i.e. 70th to 100th deciles) can acquire them more readily than those in the lower-income deciles, as the income growth for these groups kept pace with the growth of property prices (please see Tables 2 and 3 below). This dovetails with the fact that private homeownership is currently about 21%.
Conclusion
My findings here show that households did experience real income growth that is either on par or even exceeded that of private property price growth. The decline in HHI last year that threw the price affordability ratio into the spotlight is likely to be an outlier due to the pandemic, and may not repeat itself in the coming years as our economy improves.
However, given the hefty price tag that private properties command, they remain a luxury item that those in the higher-income deciles can afford even with generous government transfers for those in the lower-income deciles. As land prices form the basis of private properties’ prices, it is unlikely that we will see these prices coming down due to the scarcity of land in Singapore, which is in parallel with a Morgan Stanley’s forecast.
Besides land scarcity, the exuberance in the current property market is also driven by the “Fear Of Missing Out” (FOMO) sentiment that we have previously covered here, due to consumers’ concerns that they may be priced out either when new launches with record prices are rolled out or when the government implements new cooling measures. Personally, I feel that this anxiety to enter the market can be quelled, if the government provides more regular updates on its assessment of the property market, which may provide clues on whether cooling measures are forthcoming.
Nonetheless, aspiring private homeowners should not be discouraged, as there are always pockets of opportunities in any type of market. One can start small by getting a property that is within his/her affordability and progress from there.
Curious about any more property data topics? Feel free to let us know at stories@stackedhomes.com and we’d be happy to explore.
At Stacked, we like to look beyond the headlines and surface-level numbers, and focus on how things play out in the real world.
If you’d like to discuss how this applies to your own circumstances, you can reach out for a one-to-one consultation here.
And if you simply have a question or want to share a thought, feel free to write to us at stories@stackedhomes.com — we read every message.
0 Comments