


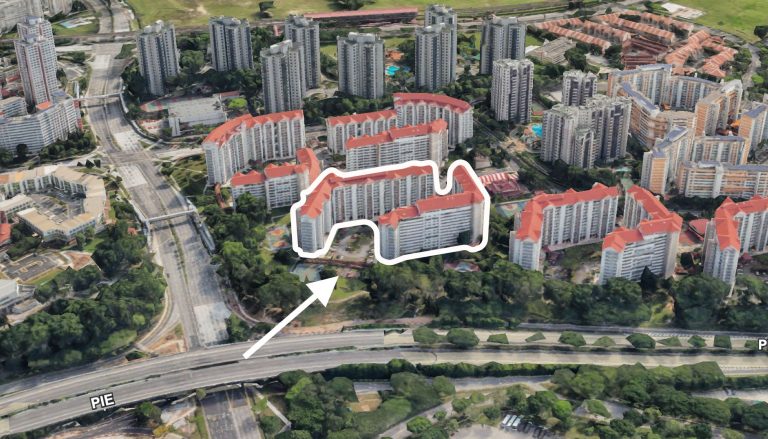


2023 was still a disappointing year for many home buyers, when $2,000+ psf became a norm for new launches, and HDB upgraders saw themselves increasingly priced out of the private segment. In hindsight, we can see that even the meteoric rise in resale flat prices did little to bridge the gap to the private segment. But this isn’t necessarily true in every neighbourhood; and on the opposite side, sellers may be celebrating. Here’s a look at how prices moved in different parts of the country from 2022 to 2023:
The challenge for many buyers today isn't access to information.
It's interpreting that information in a way that makes sense for their finances, goals, and stage of life.
Over time, that's also why we decided to work with agents who shared the same data-driven and advisory-led approach behind our editorial, consultants who could help readers think through decisions more objectively, rather than simply push transactions.
Today, the team has worked with more than 2,000 clients across over $5B in property transactions.
Overall price movements from 2022 to 2023
| Year | Average psf | % Increase |
| 2022 | $1,712 | |
| 2023 | $1,873 | 9.37% |
| Year | Average psf | % Increase |
| 2022 | $1,454 | – |
| 2023 | $1,563 | 7.52% |
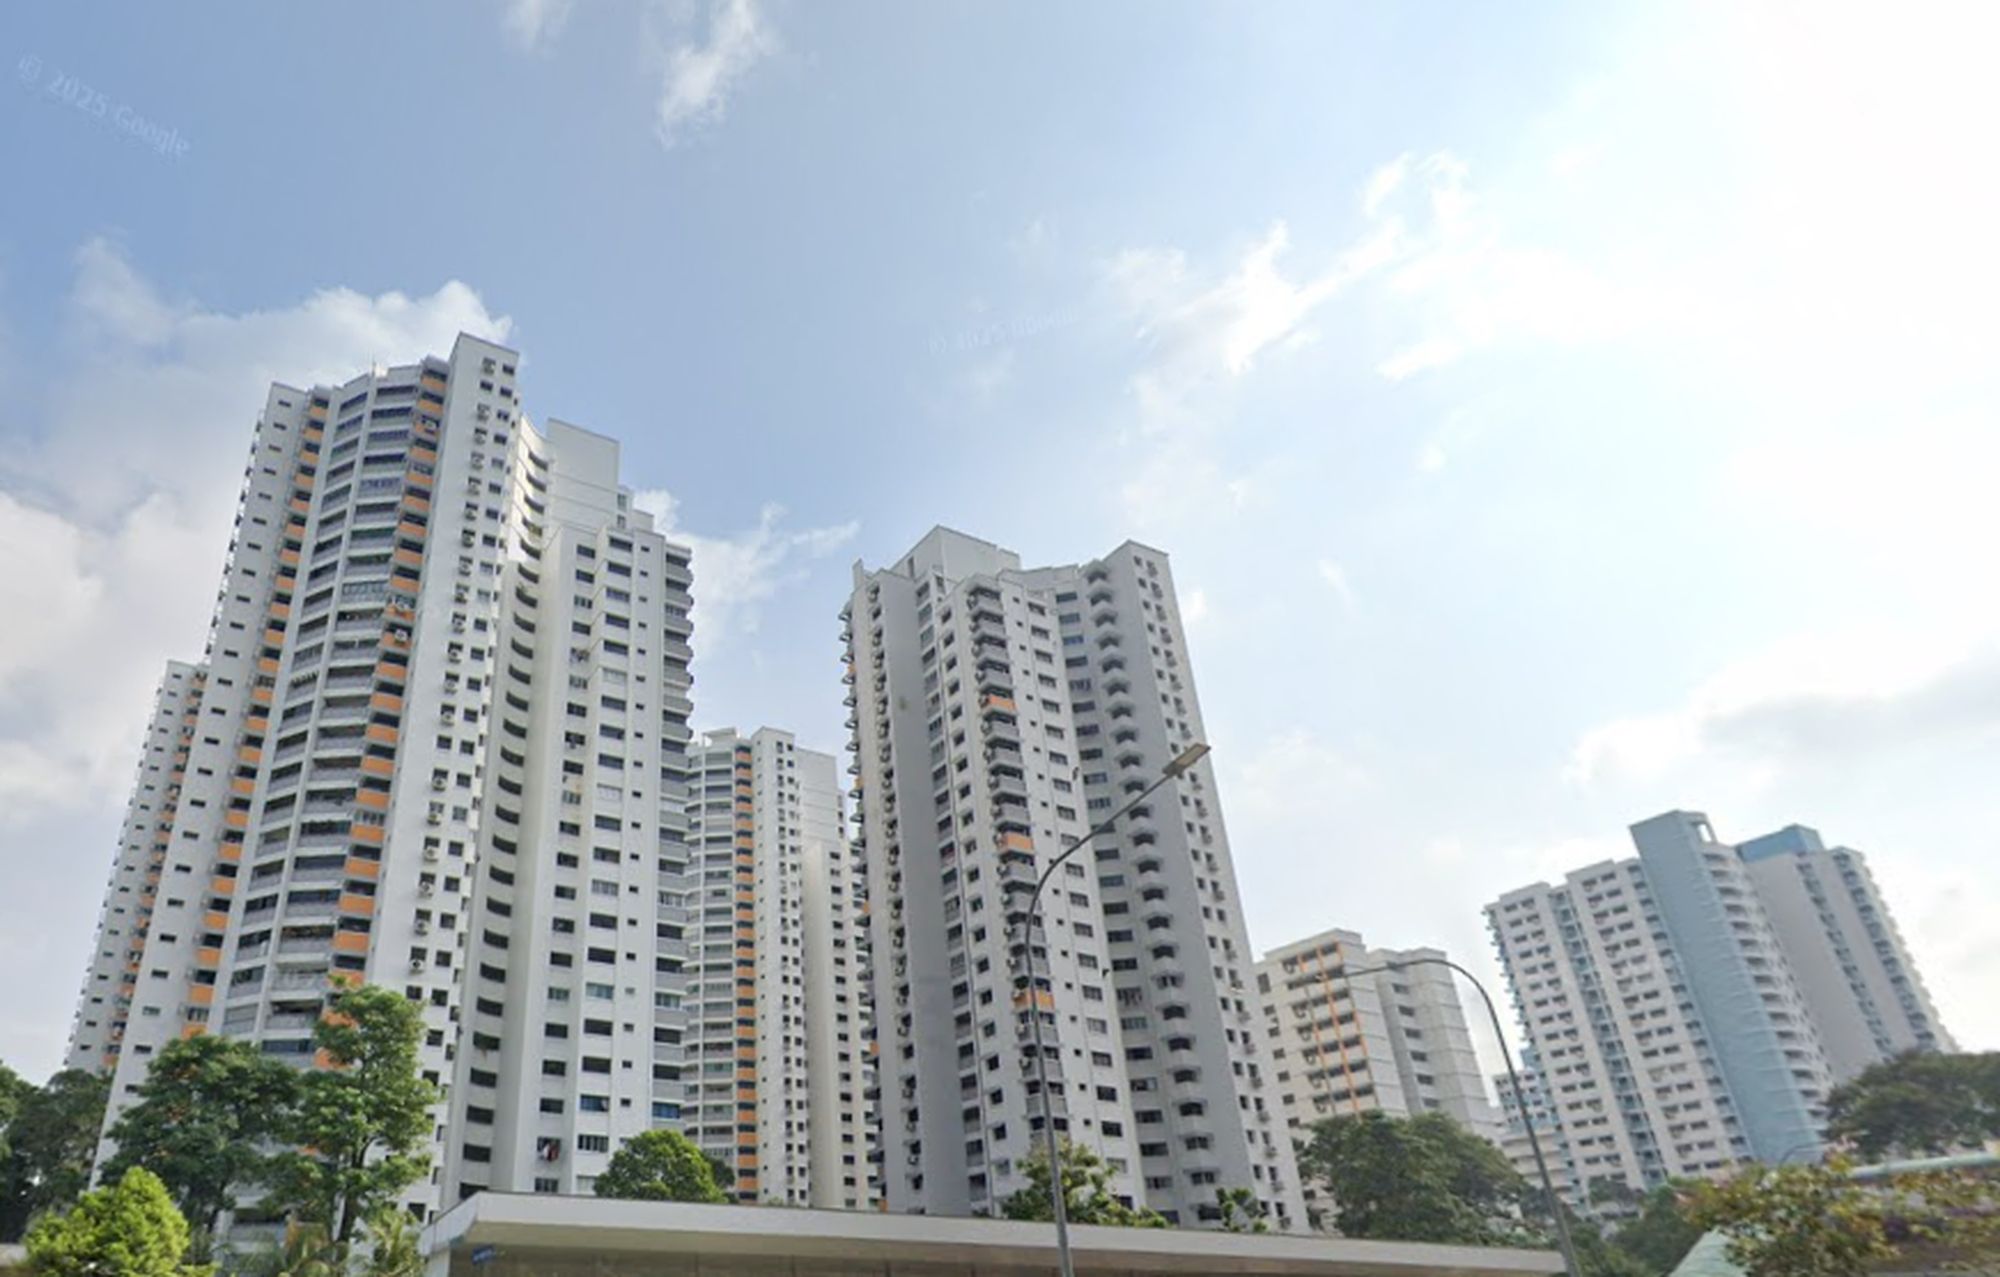
Resale properties saw a lower price increase over 2023, but some realtors have speculated that the resale segment will see more demand in the near future. This is largely due to new launch family-sized units (i.e., three-bedders at around 1,000 sq. ft.) reaching a quantum of around $2 million.
Coupled with rising interest rates and usual restrictions like the TDSR, this could drive more upgraders into the resale market in the coming months.
All non-landed transactions (new sales, subsales and resale)
| District | 2022 | 2023 | % Change |
| 22 | $1,235 | $1,895 | 53.4% |
| 21 | $1,741 | $2,218 | 27.4% |
| 23 | $1,263 | $1,529 | 21.0% |
| 15 | $1,858 | $2,230 | 20.0% |
| 5 | $1,633 | $1,942 | 18.9% |
| 11 | $2,165 | $2,535 | 17.1% |
| 16 | $1,414 | $1,591 | 12.5% |
| 6 | $2,955 | $3,297 | 11.6% |
| 18 | $1,223 | $1,341 | 9.7% |
| 4 | $1,801 | $1,951 | 8.3% |
| 25 | $997 | $1,079 | 8.2% |
| 28 | $1,249 | $1,344 | 7.6% |
| 24 | $1,334 | $1,432 | 7.4% |
| 19 | $1,402 | $1,478 | 5.4% |
| 14 | $1,554 | $1,625 | 4.5% |
| 17 | $1,143 | $1,194 | 4.4% |
| 27 | $1,220 | $1,263 | 3.6% |
| 9 | $2,491 | $2,571 | 3.2% |
| 26 | $1,985 | $2,027 | 2.1% |
| 12 | $1,615 | $1,633 | 1.1% |
| 13 | $1,827 | $1,844 | 0.9% |
| 2 | $2,247 | $2,240 | -0.3% |
| 7 | $2,454 | $2,436 | -0.7% |
| 10 | $2,565 | $2,542 | -0.9% |
| 3 | $2,292 | $2,262 | -1.3% |
| 1 | $2,073 | $2,015 | -2.8% |
| 20 | $1,808 | $1,674 | -7.4% |
| 8 | $1,929 | $1,763 | -8.6% |
Only resale non-landed transactions
| District | 2022 | 2023 | % Change |
| 23 | $1,160 | $1,312 | 13.0% |
| 27 | $1,123 | $1,251 | 11.3% |
| 26 | $1,171 | $1,299 | 11.0% |
| 28 | $1,217 | $1,344 | 10.4% |
| 14 | $1,381 | $1,521 | 10.1% |
| 18 | $1,137 | $1,249 | 9.8% |
| 8 | $1,516 | $1,662 | 9.6% |
| 17 | $1,059 | $1,159 | 9.4% |
| 6 | $3,244 | $3,544 | 9.3% |
| 19 | $1,274 | $1,390 | 9.1% |
| 13 | $1,594 | $1,736 | 8.9% |
| 16 | $1,298 | $1,410 | 8.7% |
| 25 | $997 | $1,079 | 8.2% |
| 15 | $1,565 | $1,692 | 8.1% |
| 11 | $1,786 | $1,929 | 8.0% |
| 5 | $1,442 | $1,552 | 7.6% |
| 21 | $1,488 | $1,600 | 7.5% |
| 12 | $1,499 | $1,601 | 6.8% |
| 4 | $1,769 | $1,886 | 6.6% |
| 3 | $1,874 | $1,988 | 6.1% |
| 22 | $1,235 | $1,309 | 5.9% |
| 20 | $1,526 | $1,615 | 5.8% |
| 9 | $2,195 | $2,232 | 1.7% |
| 10 | $2,200 | $2,229 | 1.3% |
| 7 | $1,799 | $1,756 | -2.4% |
| 1 | $2,073 | $2,015 | -2.8% |
| 2 | $2,071 | $1,956 | -5.5% |
You’ll notice a general similarity in both overall transactions, and resale transactions: Outside of Central Region (OCR) districts performed the best (which is probably not surprising to your ears at this point). This can be attributed to a few factors:
- The cooling measures from 2023 mainly impact the Core Central Region (CCR) and to a lesser extent the Rest of Central Region (RCR); hence we see mainly single-digit growth in districts like 9 and 10. This is due to the ABSD being raised to 60 per cent for foreigners, who are an important buyer demographic for the CCR and, to a lesser extent, the RCR areas.
Note that this has resulted in a narrowing price gap between the RCR and CCR, and it’s plausible that some buyers will try to capitalise on this in the near term.
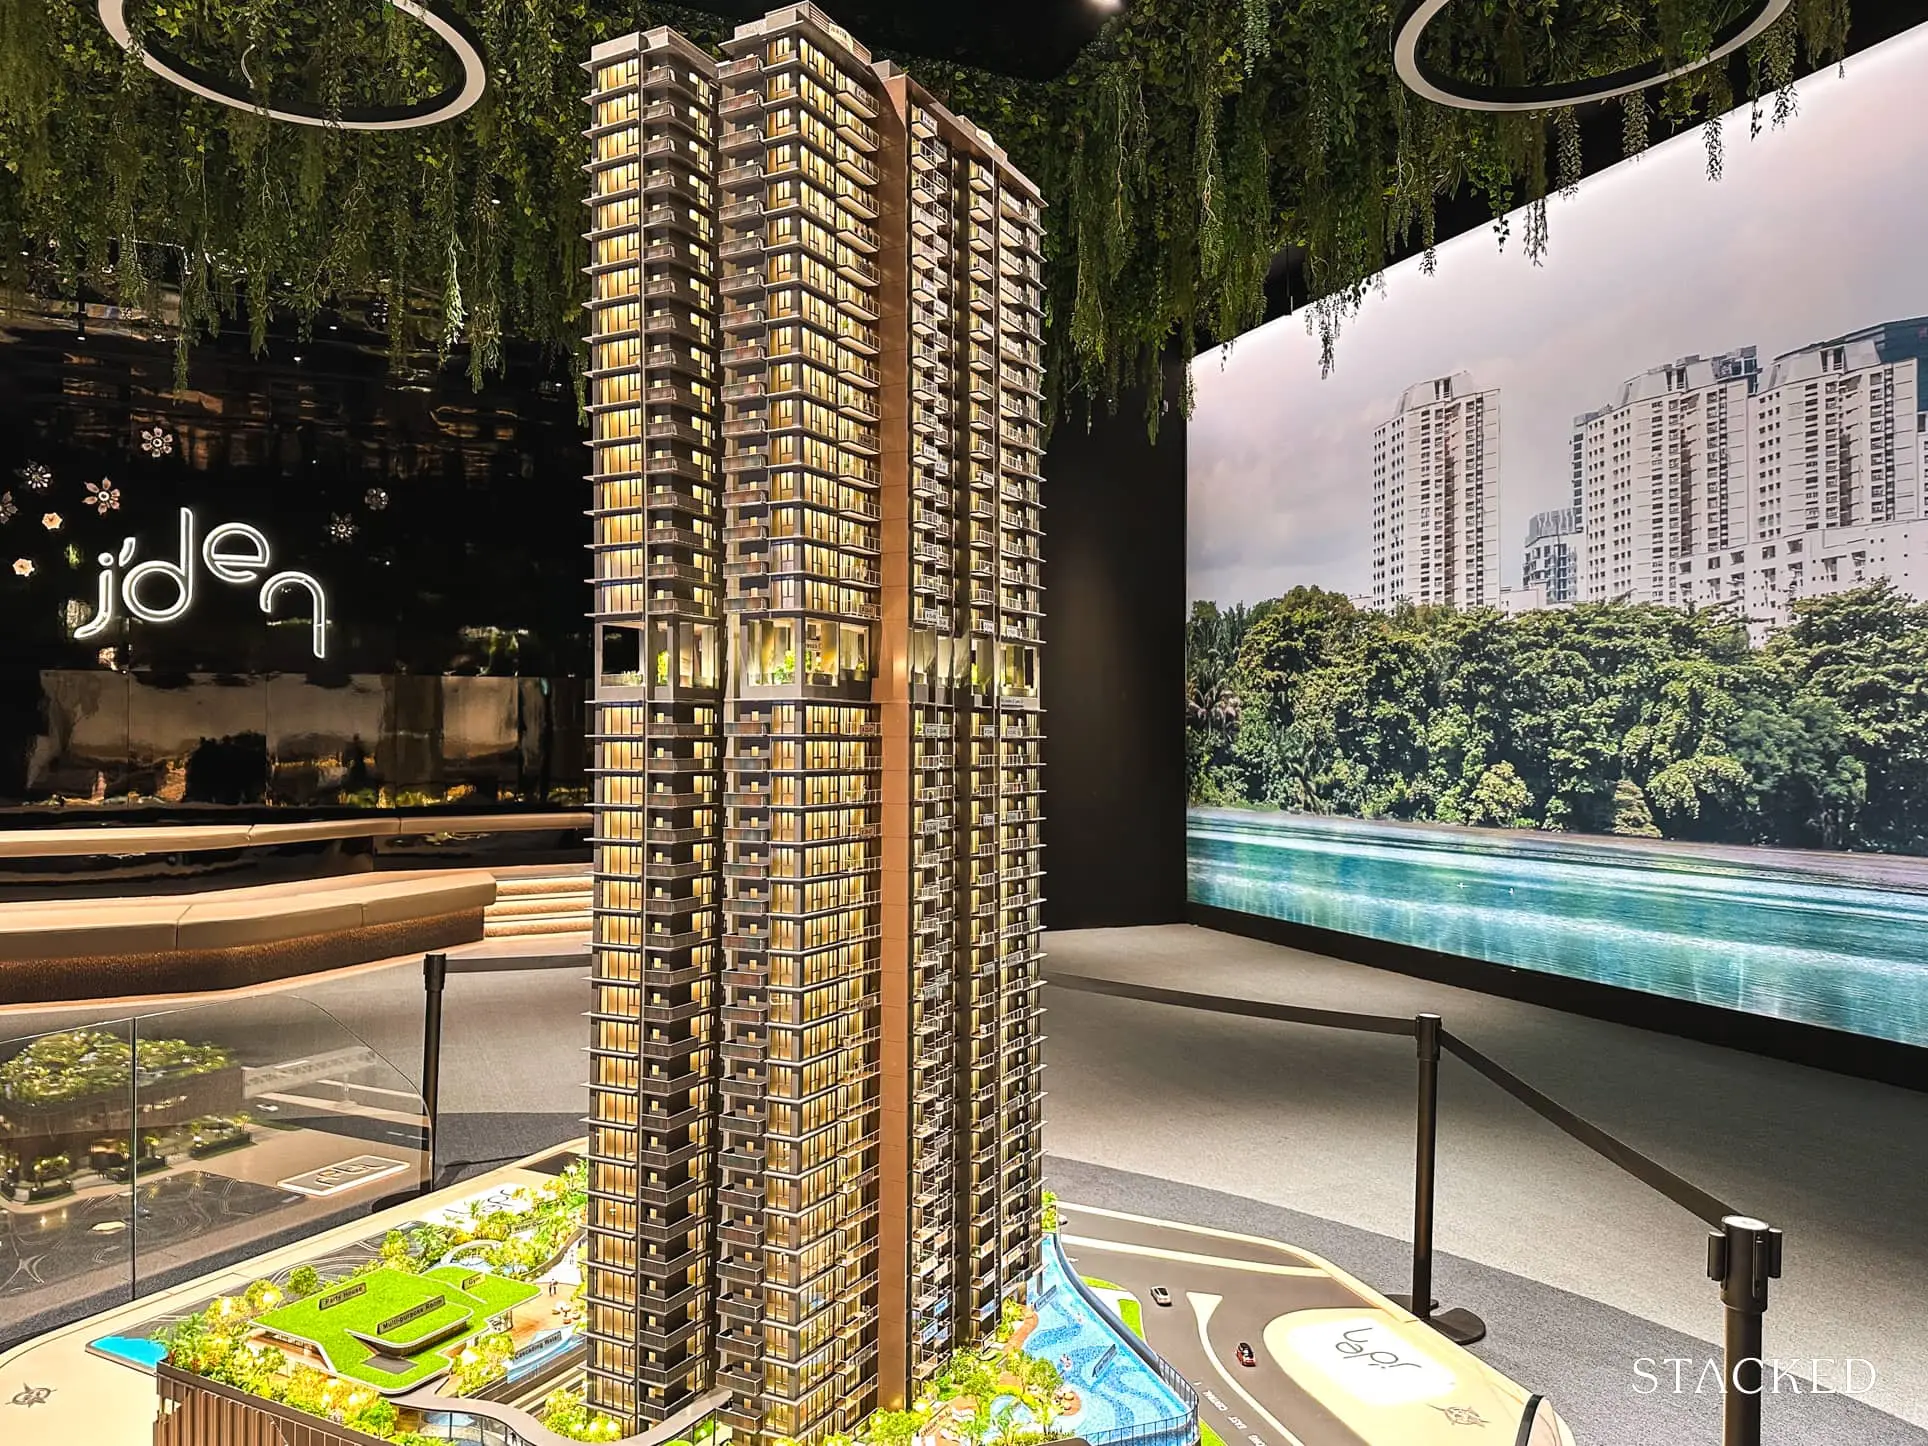
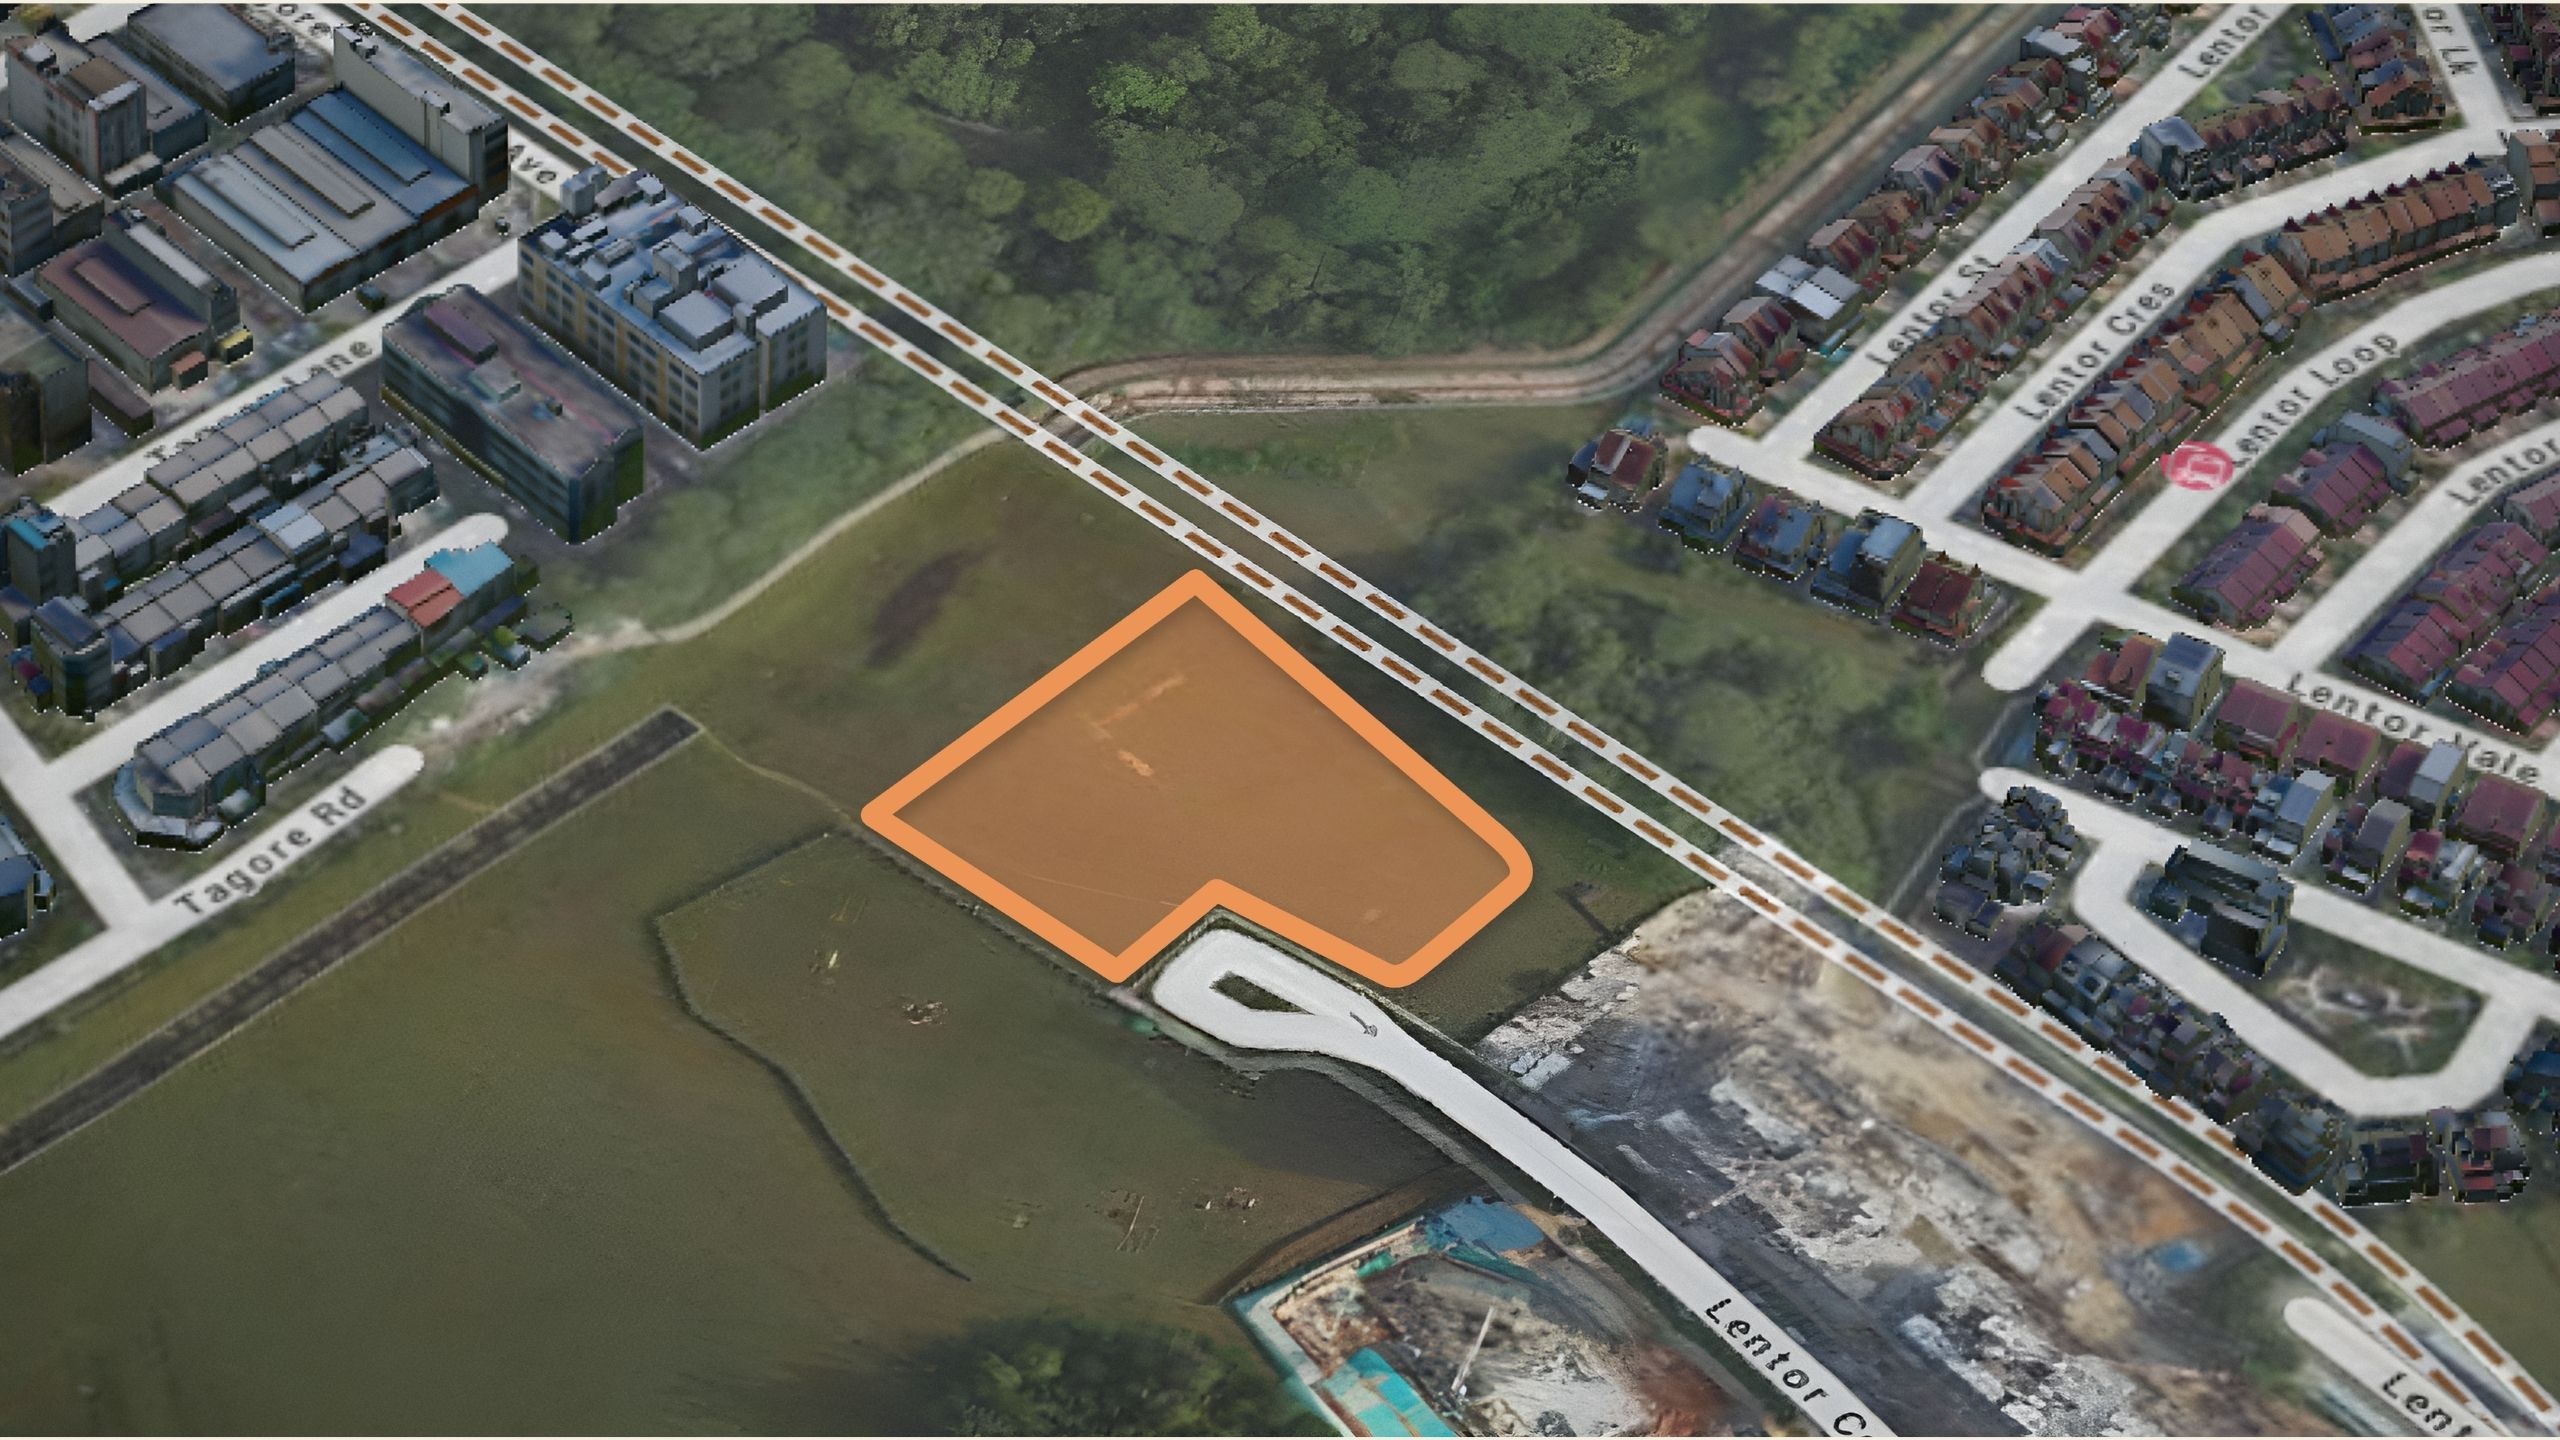
- There have been a number of strong fringe-region launches for 2023. Notably, we’d look at J’den (District 22) and Reserve Residences (District 21). These have contributed to bigger price increases in these OCR districts.
- District 15 seems to have fared best among the high-end districts if you look at overall increases. But this is fuelled by three major launches occurring there at close intervals (Tembusu Grand, Grand Dunman, and The Continuum). That’s also why its performance drops significantly if you look only at resale, where growth is single digit. Nonetheless, this is another RCR area which is narrowing the gap with CCR counterparts.
- District 8 is quite peculiar. In terms of resale transactions, it managed to appreciate 9.6% allowing it to rank 7th place. But if we factor in new launch sales, it’s actually the worst performer. This is due to the large number of units sold at the new Piccadilly Grand in 2022 as compared to 2023.
New sale vs. resale vs. sub sale no. of transactions
| Type of Sale | 2022 Volume | 2022 $PSF | 2023 Volume | 2023 $PSF | Vol. Change % | $PSF Change % |
| New Sale | 8240 | $2,145 | 6954 | $2,402 | -16% | 12% |
| Resale | 15,050 | $1,454 | 12,152 | $1,563 | -19% | 8% |
| Sub Sale | 699 | $1,854 | 1213 | $1,907 | 74% | 3% |
| Grand Total | 23,989 | $1,712 | 20,319 | $1,873 | -15% | 9% |
For new sale condos, price increases didn’t slow down from the previous year, although we did see a dip in transaction volume. This isn’t surprising, as there’s been no change to the development scene. Up till now, developers have been saying that land prices – as well as Land Betterment Charges and property agent commissions – prevent them from going any lower.
Resale price growth did slow slightly in 2023, compared to the year before. Toward the tail end of 2022 we also saw a lot more units being completed, so the stock of completed housing is growing. This also explains the uptick in sub sales, as buyers who have urgent needs swoop in on units closer to completion. They’d certainly find more willing sellers, given how much prices went up right after Covid.
(The sellers who bought in 2020/21 would likely have done so at much lower prices, so a sub sale is a good way for them to actualise their gains sooner).
That said, the higher supply of completed units may be counterbalanced by more buyers opting for resale condos, in light of less affordable new launches.
We’d also note that many landlords like to buy resale, as it means they can start renting out the unit immediately. With the occupancy cap raised to eight instead of six unrelated tenants, some investors may be looking at older, low-cost resale units to chase yields. If this happens, the resale market could retain its momentum going forward.
At Stacked, we like to look beyond the headlines and surface-level numbers, and focus on how things play out in the real world.
If you’d like to discuss how this applies to your own circumstances, you can reach out for a one-to-one consultation here.
And if you simply have a question or want to share a thought, feel free to write to us at stories@stackedhomes.com — we read every message.


0 Comments