We Make $200k Per Year And Own A Freehold Condo In Potong Pasir: Is A Leasehold Condo A Better Option Or Would We Lose Money?
August 23, 2024
Hello,
We are a family of three with a daughter. We live in a freehold condo in Potong Pasir. We are happy with our current place but are considering upgrading to a bigger home if we decide to have another child. We are unsure whether a 3-bedroom freehold condo would be a wise decision or if we should move to a leasehold condo or HDB. We are looking for a place for both our own stay and, if possible, long-term investment. We have a naive understanding that we might lose money when selling leasehold properties since their value might depreciate due to their expiration date. We are happy to be convinced otherwise if there is data to negate this. Our income is around 200K annually.
For our daughter’s primary school registration in a couple of years, we are eyeing Kuo Chuan Presbyterian Primary School, which is more than 2km away from our current place. We are reluctant to purchase property around Bishan since most of the projects are old and leasehold. We do not mind renting for a long period for primary school registration requirements as we might need to upgrade if we decide to have another child.
Thank you for your help!
Hi there,
Thanks for reaching out.
This is a common perception of leasehold properties that because of the possible effects of lease decay, they will lose money (as compared to freehold). However, from what we’ve seen, this isn’t necessarily true – and it is very project-dependent as many different factors go into what makes a profitable condo purchase. Regardless, we will take a look at historical data to gain a clearer understanding of these assumptions.
Additionally, you’ve considered renting a property near the school instead of purchasing one. This approach, known as rentvesting – where you rent in a preferred location while leasing out your existing property – is a strategy that’s gaining traction. We’ll explore whether this option could be profitable for your situation by running through some numbers.
Since we don’t know the exact development you’re currently residing in, we’ll examine the overall performance of freehold condominiums in your area.
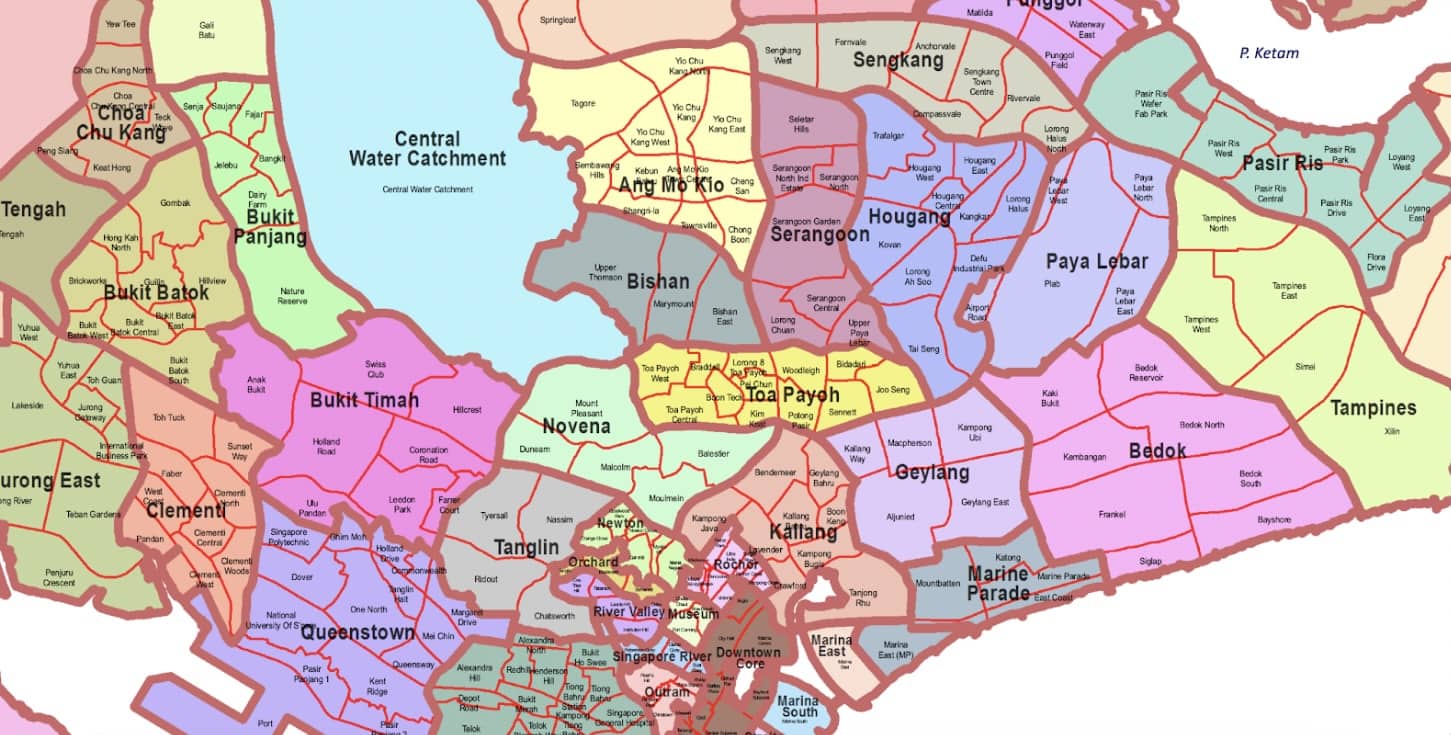
Performance of freehold/999y leasehold condos in Toa Payoh
Estates included in the Toa Payoh planning area:
| Year | All FH/999y | All 99y | FH/999y in TPY | 99y in TPY |
| 2013 | $1,427 | $1,057 | $1,300 | $1,220 |
| 2014 | $1,366 | $1,029 | $1,350 | $1,073 |
| 2015 | $1,365 | $1,033 | $1,253 | $1,102 |
| 2016 | $1,396 | $1,129 | $1,185 | $1,151 |
| 2017 | $1,466 | $1,115 | $1,274 | $1,227 |
| 2018 | $1,544 | $1,153 | $1,362 | $1,386 |
| 2019 | $1,575 | $1,178 | $1,356 | $1,381 |
| 2020 | $1,504 | $1,173 | $1,379 | $1,376 |
| 2021 | $1,592 | $1,207 | $1,499 | $1,484 |
| 2022 | $1,714 | $1,337 | $1,674 | $1,600 |
| 2023 | $1,790 | $1,463 | $1,720 | $1,764 |
| ROI (2013 – 23) | 2.3% | 3.3% | 2.8% | 3.8% |
The table shows that, overall, 99-year leasehold properties tend to have stronger price growth. However, when comparing freehold properties, those in Toa Payoh have outperformed the average growth rate of freehold properties across the island. Keep in mind, though, that this is a general trend, and the performance may vary depending on the specific project.
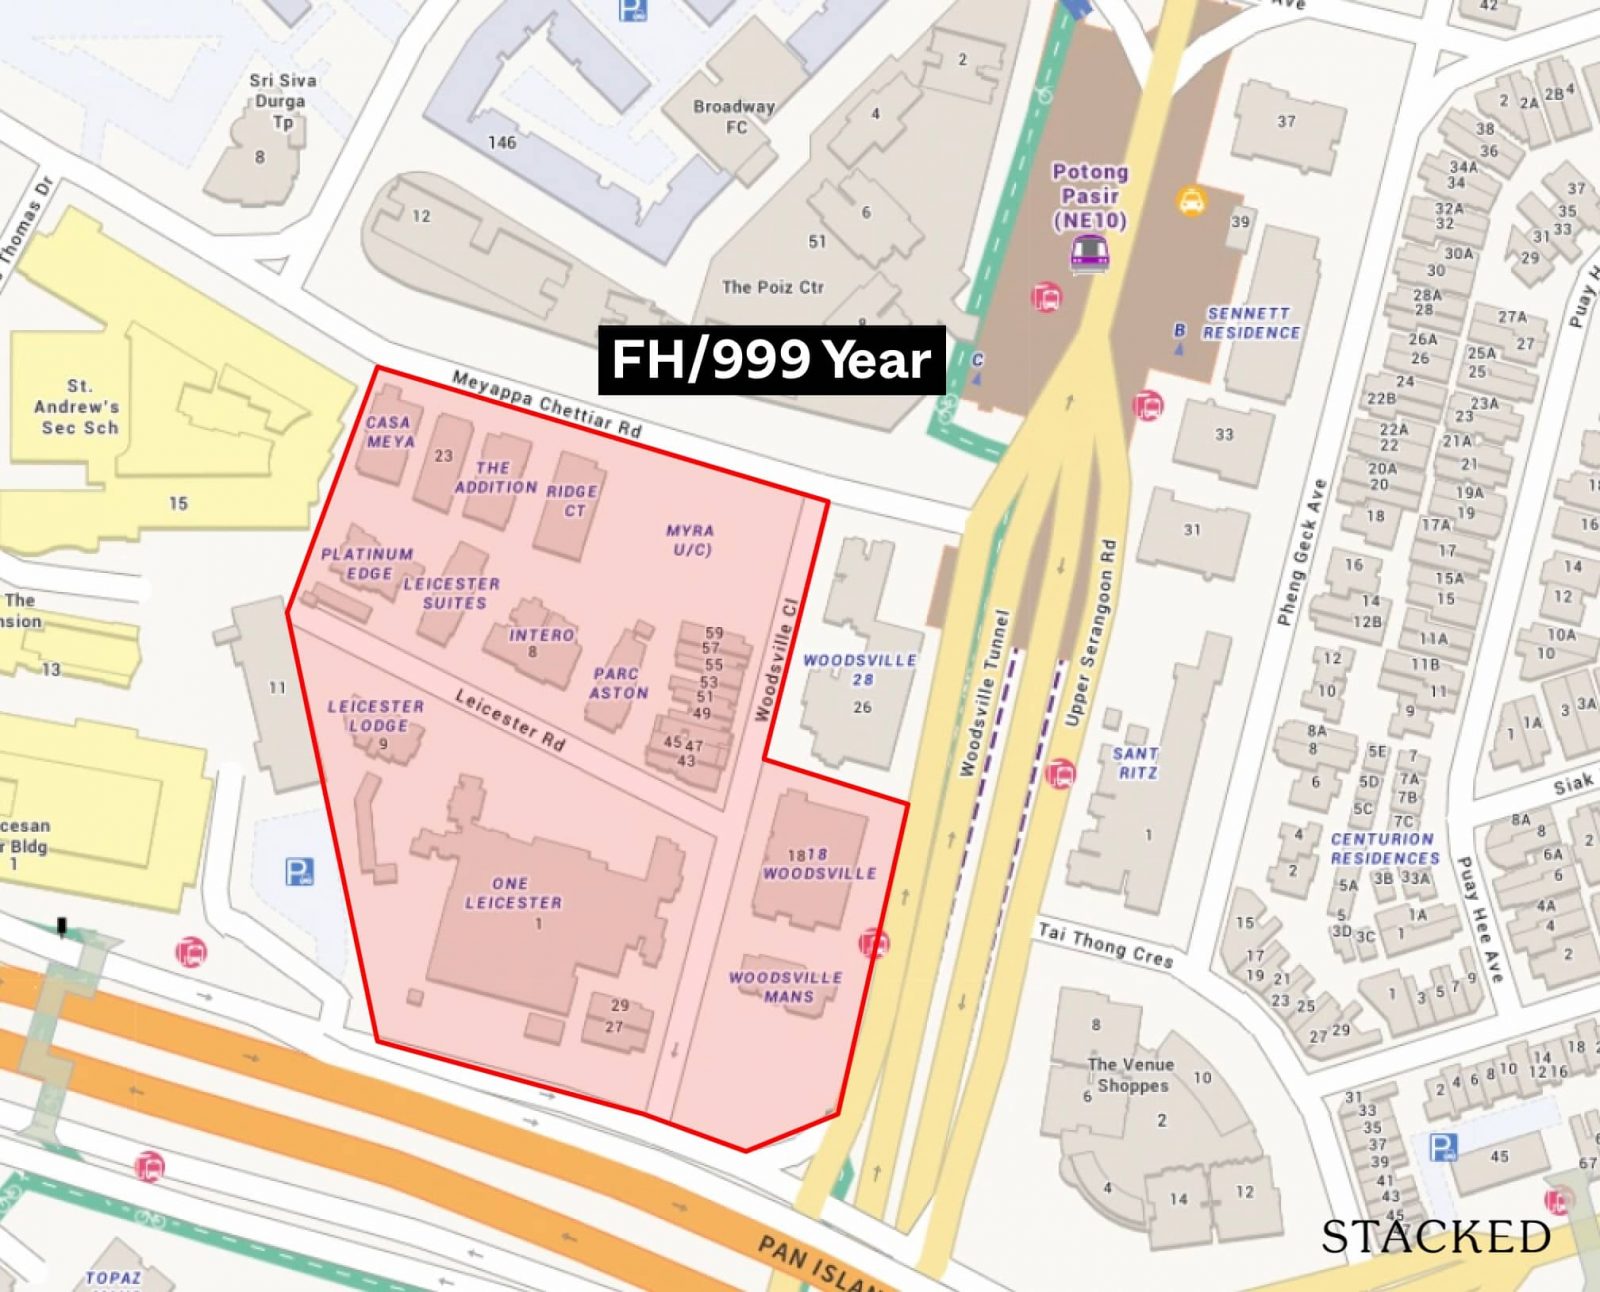
Potong Pasir is a relatively small estate where all the condominiums are located near the MRT station. Most of the freehold and 999-year leasehold condos are boutique developments with fewer than 100 units, except for One Leicester, which has 194 units, and 18 Woodsville, which has 101 units. Let’s examine how these two projects have been performing.
| Year | One Leicester | 18 Woodsville | All FH/999y | FH/999y in TPY |
| 2016 | $1,166 | $1,394 | $1,396 | $1,185 |
| 2017 | $1,205 | $1,319 | $1,466 | $1,274 |
| 2018 | $1,295 | $1,747 | $1,544 | $1,362 |
| 2019 | $1,331 | $1,626 | $1,575 | $1,356 |
| 2020 | $1,388 | $1,481 | $1,504 | $1,379 |
| 2021 | $1,358 | $1,360 | $1,592 | $1,499 |
| 2022 | $1,523 | $1,672 | $1,714 | $1,674 |
| 2023 | $1,713 | $1,676 | $1,790 | $1,720 |
| Average | 5.6% | 2.7% | 3.6% | 5.5% |
As the first resale transaction for 18 Woodsville occurred in 2016, we’re focusing on data from the past 7 years. Despite being adjacent and having the same freehold tenure, we can see that one project is outperforming the other.
For comparison, let’s also look at the 99-year leasehold projects in the area. We’ll compare two developments of different sizes: Sennett Residence with 332 units and Woodsville 28 with 110 units. To ensure fairness, we’ll only look at units of certain sizes, specifically 800 – 1200 sq ft as these are the ones that Woodsville 28 has in common with Sennett Residence. This helps to reduce the skewed $PSF prices in Sennett which tends to be higher given it has multiple units under 500 sq ft.
| Year | Sennett Residence | Woodsville 28 |
| 2013 | $1,441 | $1,289 |
| 2014 | No Data | $1,268 |
| 2015 | $1,331 | $1,088 |
| 2016 | $1,338 | $1,119 |
| 2017 | No Data | No Data |
| 2018 | $1,473 | $1,331 |
| 2019 | $1,395 | $1,258 |
| 2020 | $1,390 | $1,287 |
| 2021 | $1,515 | $1,309 |
| 2022 | $1,615 | $1,413 |
| 2023 | $1,639 | $1,460 |
| 2024 | $1,824 | $1,623 |
| ROI (13 – 24) | 2.7% | 2.3% |
| ROI (20 – 24) | 7.0% | 6.0% |
Since the market high of 2013, the leasehold Sennett Residence seems to have done better despite having a higher starting $PSF in 2013. Its lease start year is 2011, so by 2019, it was already 8 years old. The period between 2020 – 2024 saw greater growth of 7% compared to the 6% of the freehold Woodsville 28.
Both developments are within walking distance of each other, yet the leasehold was the better performer.
Of course, this is just one example. But the point is that it’s difficult to definitively say whether freehold or leasehold properties are better. If it’s for capital gains, the data does show that leasehold can indeed outperform freehold, although it is reasonable to expect to see much older leasehold properties struggling.
If you plan to hold the property long-term, a freehold property might be more advantageous since it doesn’t face lease decay and tends to retain its value better. However, not all freehold properties appreciate at the same rate; their long-term demand is influenced by specific characteristics that appeal to buyers even as consumer needs and preferences evolve.
While we don’t have a specific example in this particular estate due to the limited number of condos in the area, we can use data across transactions in Singapore to see how older leasehold properties fared against their freehold peers. So let’s examine how condos (both freehold and leasehold) as well as HDBs perform based on their age.
Performance of condos and HDBs based on age
Leasehold condominiums (99-year leasehold)
| Size Category | 800 – 1200 Sq Ft | More Than 1,200 Sq Ft | ||
| Year | 1980 – 1990 | 2010 – 2020 | 1980 – 1990 | 2010 – 2020 |
| 2013 | $1,074 | $1,492 | $914 | $1,442 |
| 2014 | $1,022 | $1,277 | $841 | $1,418 |
| 2015 | $919 | $1,279 | $830 | $1,333 |
| 2016 | $834 | $1,378 | $766 | $1,364 |
| 2017 | $865 | $1,240 | $783 | $1,297 |
| 2018 | $1,026 | $1,234 | $913 | $1,305 |
| 2019 | $1,141 | $1,207 | $932 | $1,439 |
| 2020 | $1,008 | $1,171 | $922 | $1,248 |
| 2021 | $1,086 | $1,217 | $982 | $1,257 |
| 2022 | $1,239 | $1,327 | $1,094 | $1,411 |
| 2023 | $1,400 | $1,438 | $1,166 | $1,510 |
| 2024 | $1,433 | $1,495 | $1,213 | $1,555 |
| ROI (13 – 24) | 2.7% | 0.0% | 2.6% | 0.7% |
| ROI (13 – 17) | -5.3% | -4.5% | -3.8% | -2.6% |
| ROI (17 – 24) | 7.5% | 2.7% | 6.5% | 2.6% |
In the table above, we isolated leasehold properties only (those that are 99-year leasehold). We also filtered for sizes between 800 sq ft – 1,200 sq ft, and 1,200 sq ft and above. This helps us avoid skewing the data towards newer properties since they’re built smaller with higher $PSF. Finally, we only looked at resale transactions to avoid any spikes in data from new launch sales within a particular period. We also calculated the ROI between 2013 – 17 (down market) and 2018 – 24 (up market)
Based on data from 2013 to 2024, older properties that were completed between 1980 – 1990 saw a greater appreciation in their $PSF. When we look at the year-on-year data, we see that older projects experienced significant appreciation during market upswings.
During a down market, older properties underperform newer ones. When it’s a buyer’s market, sellers in older properties may find themselves being constantly compared to newer ones and so, face a harder time holding their price. However, the recent upmarket saw the outperformance of older properties. This could be due to the relative affordability of older properties, especially as prices rise. When inventory is low, buyers may be more willing to overlook age. The shift towards remote work during and after the pandemic has increased the demand for older properties which typically offer more generous square footage.
With all this being said, it’s clear from the data that even older properties can still appreciate.
Now, let’s look at how old freehold condos compare to newer ones.
Freehold condominiums (including 927 – 999 years)
| Size Category | 800 – 1200 Sq Ft | More Than 1,200 Sq Ft | ||
| Year | 1980 – 1990 | 2010 – 2020 | 1980 – 1990 | 2010 – 2020 |
| 2013 | $1,302 | $1,507 | $1,220 | $1,860 |
| 2014 | $1,293 | $1,541 | $1,203 | $1,652 |
| 2015 | $1,288 | $1,472 | $1,176 | $1,703 |
| 2016 | $1,144 | $1,490 | $1,180 | $1,892 |
| 2017 | $1,153 | $1,639 | $1,213 | $1,811 |
| 2018 | $1,661 | $1,607 | $1,370 | $1,970 |
| 2019 | $1,302 | $1,770 | $1,347 | $2,039 |
| 2020 | $1,403 | $1,615 | $1,361 | $1,909 |
| 2021 | $1,570 | $1,598 | $1,459 | $1,912 |
| 2022 | $1,720 | $1,662 | $1,655 | $2,069 |
| 2023 | $1,807 | $1,756 | $1,722 | $2,080 |
| 2024 | $1,716 | $1,854 | $1,738 | $2,035 |
| ROI (13 – 24) | 2.5% | 1.9% | 3.3% | 0.8% |
| ROI (13 – 17) | -3.0% | 2.1% | -0.1% | -0.7% |
| ROI (17 – 24) | 5.8% | 1.8% | 5.3% | 1.7% |
Freehold properties also exhibit a similar trend, with older properties outperforming newer ones. Even when we look at the difference in gains/losses between the down and the up market, the behaviour exhibited is similar to leasehold developments.
In the post-pandemic years, older freehold properties experienced much stronger growth compared to newer developments. This could be attributed to the larger size of older properties.
Performance of HDBs
| Flat Type | 3 ROOM | 4 ROOM | 5 ROOM | |||
| Year | 1980 – 1990 | 2010 – 2020 | 1980 – 1990 | 2010 – 2020 | 1980 – 1990 | 2010 – 2020 |
| 2013 | $354,310 | $427,400 | $446,701 | $577,810 | $571,371 | $712,654 |
| 2014 | $331,997 | $440,705 | $420,311 | $522,213 | $547,093 | $827,600 |
| 2015 | $313,518 | $418,598 | $406,395 | $588,209 | $539,496 | $909,485 |
| 2016 | $309,346 | $429,742 | $407,316 | $515,700 | $548,537 | $833,561 |
| 2017 | $304,365 | $417,688 | $404,864 | $512,813 | $552,698 | $765,952 |
| 2018 | $293,083 | $380,983 | $392,688 | $501,032 | $532,676 | $745,114 |
| 2019 | $285,190 | $361,450 | $385,246 | $486,029 | $528,019 | $645,633 |
| 2020 | $292,117 | $386,688 | $393,858 | $504,378 | $530,707 | $631,037 |
| 2021 | $332,559 | $435,717 | $442,578 | $559,396 | $592,566 | $689,930 |
| 2022 | $367,188 | $480,252 | $483,367 | $618,780 | $643,078 | $740,113 |
| 2023 | $388,025 | $501,638 | $515,600 | $654,011 | $676,126 | $773,757 |
| 2024 | $390,760 | $517,135 | $520,712 | $665,822 | $699,885 | $805,123 |
| ROI (13 – 24) | 0.9% | 1.7% | 1.4% | 1.3% | 1.9% | 1.1% |
| ROI (13 – 19) | -3.6% | -2.8% | -2.4% | -2.8% | -1.3% | -1.6% |
| ROI (19 – 24) | 6.5% | 7.4% | 6.2% | 6.5% | 5.8% | 4.5% |
In the case of HDBs, it’s not so clear-cut. Overall, we can see that 4 and 5-room flats that are older tend to outperform. This wasn’t the case for 3-room flats.
The year-on-year data reveals that the demand for older flats has been significantly driven by the pandemic, as growth was largely negative or stagnant in the years leading up to it.
The data indicates that, despite the lease decay issue affecting leasehold properties as they age, these properties still experience growth during market upswings. Additionally, purchasing a newer property does not necessarily guarantee higher appreciation.
From examining the data between both HDBs and condos, it’s clear that older developments don’t necessarily underperform the market.
Thus, we think it makes sense to keep an open mind in purchasing an older leasehold condo – however, it’s important to note the individual characteristics of a project. For example, an older mass-market leasehold development may have stronger demand over the years due to its more varied facilities, lower maintenance costs and affordability as compared to a smaller leasehold condo.
Since you’re interested in enrolling your child at Kuo Chuan Presbyterian Primary School, let’s review the performance of condos located within 1 km of the school.
Performance of condos within 1 km of Kuo Chuan Presbyterian Primary School
Here are the developments situated within 1 km of the school:
| Project | Tenure | TOP year | No. of units | Avg 3-bedroom price (Jan 2024 till date) | Avg 3-bedroom price PSF (Jan 2024 till date) |
| Sky Vue | 99 years | 2016 | 694 | $2,500,000 (only 1 transaction) | $2,191 |
| Sky Habitat | 99 years | 2015 | 509 | $2,713,778 | $1,870 |
| Bishan Loft | 99 years | 2003 | 384 | $1,945,600 | $1,552 |
| Goldenhill Park Condominium | Freehold | 2004 | 390 | $2,880,000 (only 1 transaction) | $2,158 |
| Bishan 8 | 99 years | 1999 | 200 | $1,860,600 | $1,600 |
| The Springbloom | 99 years | 1999 | 372 | $2,243,296 | $1,546 |
| Chiltern Park | 99 years | 1995 | 500 | $2,050,000 (only 1 transaction) | $1,351 |
Certain blocks in the new development replacing Chuan Park will also be within 1 km of the school.
| Year | Sky Vue | Sky Habitat | Bishan Loft | Goldenhill Park Condominium | Bishan 8 | The Springbloom | Chiltern Park |
| 2016 | $1,745 | $1,457 | $1,083 | $1,273 | $1,100 | $1,014 | $869 |
| 2017 | $1,623 | $1,435 | $1,047 | $1,355 | $1,080 | $1,014 | $923 |
| 2018 | $1,641 | $1,469 | $1,129 | $1,505 | $1,174 | $1,091 | $1,047 |
| 2019 | $1,734 | $1,480 | $1,154 | $1,495 | $1,207 | $1,045 | $994 |
| 2020 | $1,670 | $1,508 | $1,176 | $1,540 | $1,187 | $1,044 | $994 |
| 2021 | $1,766 | $1,599 | $1,223 | $1,596 | $1,240 | $1,113 | $1,109 |
| 2022 | $1,874 | $1,658 | $1,359 | $1,809 | $1,366 | $1,261 | $1,227 |
| 2023 | $1,998 | $1,736 | $1,468 | $1,964 | $1,600 | $1,421 | $1,347 |
| ROI (2016 – 2023) | 1.95% | 2.53% | 4.44% | 6.39% | 5.50% | 4.94% | 6.46% |
Since the first resale transaction for the newest development (Sky Vue) occurred in 2016, we will focus on data from the past 7 years.
The data reveals that, over this period, older developments have generally outperformed newer ones. With a limited supply of condominiums in this area, demand remains strong, especially given their location on the city fringe and proximity to MRT stations.
When comparing the average prices of 3-bedroom units in these developments, there’s a notable disparity between newer and older properties. While The Springbloom and Chiltern Park are also priced in the $2M range, their average price psf is significantly lower than that of Sky Vue and Sky Habitat, suggesting that the older developments offer larger units.
The purchase prices also differ greatly – newer leasehold projects are priced at $2.5M and above, while older ones range from around $1.8M to the low $2M range, which aligns more closely with what HDB upgraders can typically afford. Budget constraints may limit these buyers’ options, but the data shows that older leasehold condos in this area still perform well. We’ve also demonstrated that older leasehold condos across Singapore, even those built in the 1980s, have held their value effectively in the recent market upswing.
It is not surprising that Goldenhill Park experienced the highest growth rate, given its freehold tenure. Historically, its average price psf was lower than Sky Vue and Sky Habitat, only catching up in 2022. Additionally, a unit at Goldenhill Park costs less than $200K more than one at Sky Habitat, making it a compelling choice given its tenure.
Another point of interest is Sky Habitat’s initial launch price. Launched in 2012 during a market peak with an average price psf of $1,604, it fell after several cooling measures were introduced in 2013. The average price psf only returned to its launch level in 2022, which may have deterred owners from selling earlier due to potential losses. In comparison to Sky Vue’s price per square foot, there appears to be potential for further growth.
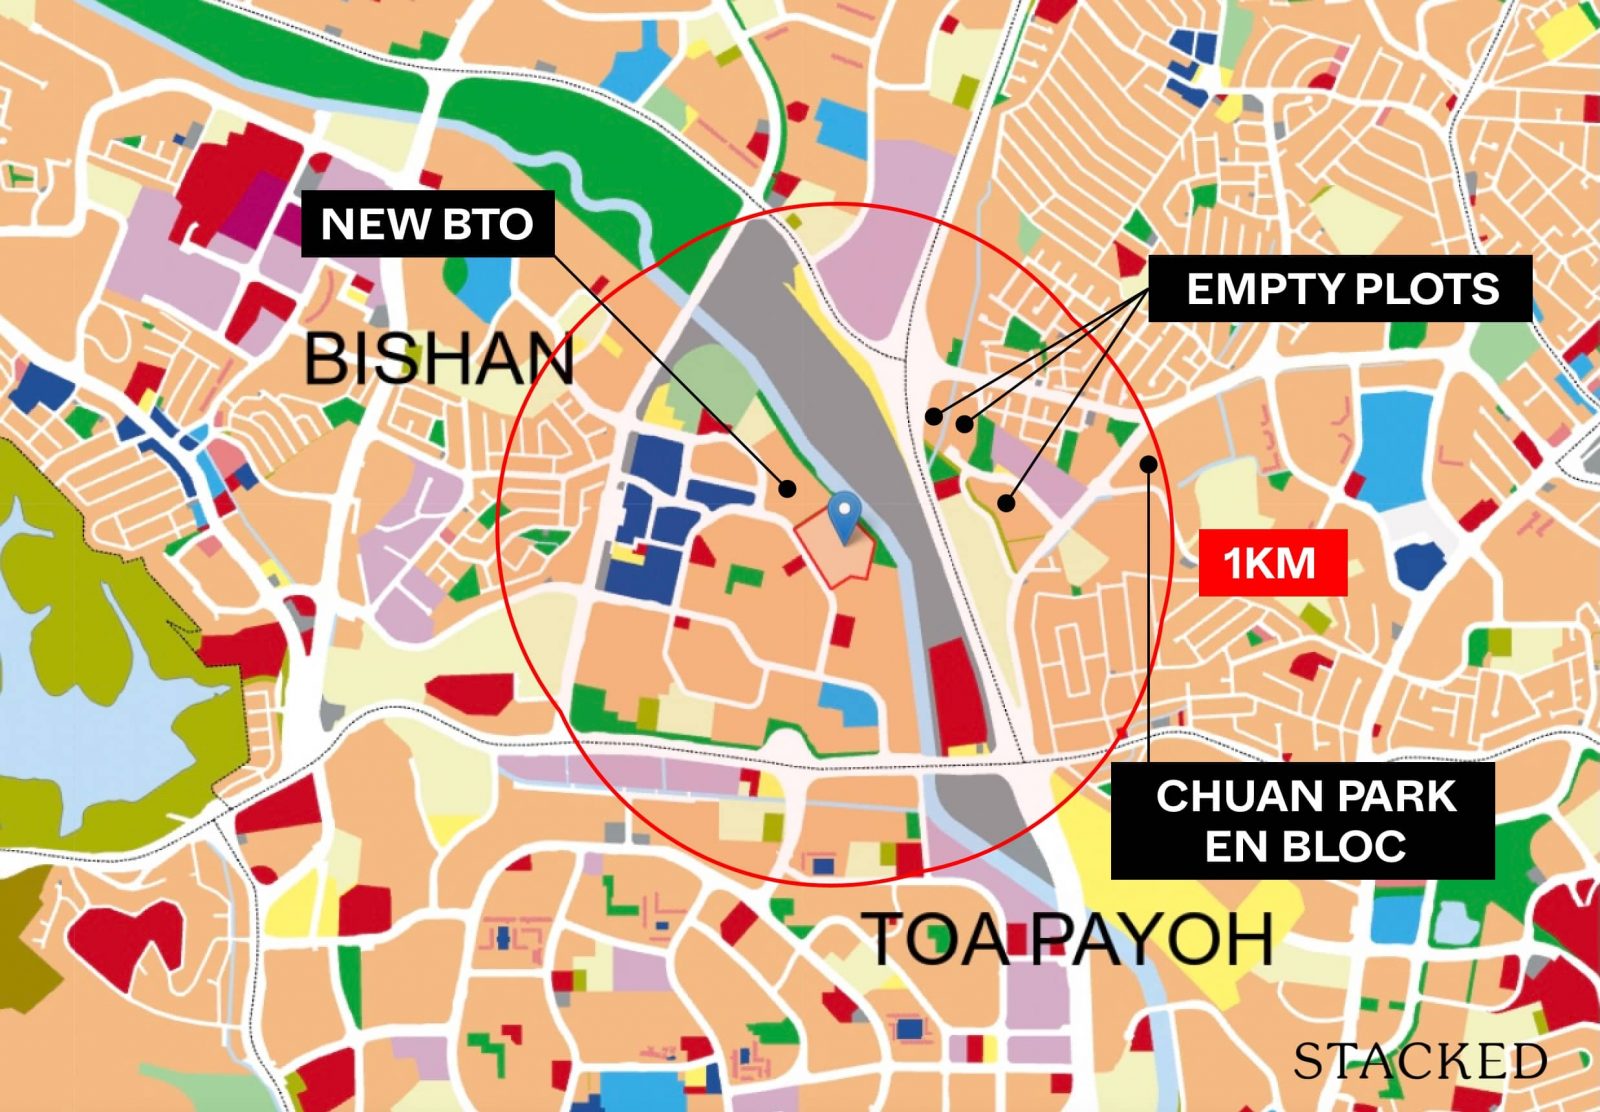
Looking at the URA Master Plan for land within 1 km of Kuo Chuan Presbyterian, there are limited plots available for new residential developments. The plot adjacent to the school is allocated for the Bishan Ridges BTO, expected to be completed in 2026. This could bring more families to the area and potentially increase competition for school placements, although this depends on the demographics of incoming residents with primary-school-aged children.
Additionally, with the Government Land Sales (GLS) plot at Chuan Grove and the Chuan Park en bloc, we might see higher property prices in the area, which could enhance the appeal of more affordable, older leasehold condos. Of course, factors like layout, size, pricing, and market conditions will influence this.
Apart from two other high-rise residential plots, there are no other residential-zoned plots within the 1 km radius. Given the abundance of educational institutions in the area, which are unlikely to be rezoned, the outlook for older leasehold condos in the vicinity seems stable. These properties are unlikely to depreciate significantly, at least until your daughter completes primary school.
Next, let’s examine the costs associated with two scenarios: renting out your property while renting near Kuo Chuan Presbyterian Primary School, versus purchasing a unit within 1 km of the school. Considering the age of your daughter now and assuming you’d like to remain close to Kuo Chuan Presbyterian during her 6 years there, we’ll use an estimated 10-year timeframe.
There is no minimum stay period required before Primary 1 registration, but you must reside in the property for at least 30 months from the start of registration.
Potential costs
Rent out your unit while renting near Kuo Chuan Presbyterian
Since we don’t know the exact development you’re staying in, we’ll conservatively assume it’s 18 Woodsville, one of the two larger freehold projects near Potong Pasir MRT station, given its lower average rent compared to One Leicester. You can adjust the figures based on your actual situation.
From January to now, the average rent for a 2-bedroom unit at 18 Woodsville is $3,800 per month.
In contrast, the average rent for a 2-bedroom unit in developments within 1 km of the school ranges from $3,950 to $4,668. For our calculations, we’ll use the median rent of $4,309.
Given that we don’t have details of any outstanding loans for your property, for calculation purposes, we’ll assume you bought the property 5 years ago at $1.285M, securing an 80% loan with a 3.5% interest rate and a 30-year tenure. This would leave you with an outstanding loan amount of $898,590, with 25 years remaining. For our calculations, we’ll use a 4% interest rate.
Cost of holding and renting out your property for 10 years
| Interest expense | $311,809 |
| Maintenance fee (assuming $350/month) | $42,000 |
| Property tax | $67,680 |
| Rental income | $456,000 |
| Agency fee (payable once every 2 years) | $20,710 |
| Total gains | $13,801 |
Cost of renting for 10 years: $517,080
Total cost if you were to take this pathway: $517,080 + $13,801 = $530,881
In this scenario, if the rent you receive for your property is not higher than the rent you’re paying, you will likely incur a loss. Additionally, if you have a significant amount of loan outstanding, the current high interest rates could result in substantial interest costs. In such cases, it’s likely that you would experience a loss, unless property appreciation offsets these expenses.
Sell your unit and purchase a place near Kuo Chuan Presbyterian
Since you’ve indicated that you’re looking for a property for your own stay as well as a long-term investment, we assume you plan to stay in the property for an extended period. In this case, a freehold development might offer better value retention over the long term. However, as we’ve seen from the earlier data, buying an older leasehold condo doesn’t necessarily lead to a loss. Additionally, purchasing an older property could mean lower ownership costs, as the interest expenses would be lower. Since we don’t know your exact budget, let’s take the scenario where you purchase a 3-bedroom unit at Bishan Loft for $1.95M, with a 75% loan at a 4% interest rate and a 25-year tenure.
Cost of holding the unit for 10 years
| BSD | $67,100 |
| Interest expense | $507,485 |
| Maintenance fee (assuming $380/month) | $45,600 |
| Property tax | $34,700 |
| Renovation | $20,000 |
| Total cost | $674,885 |
In this scenario, the cost is higher since you will have to pay BSD and the interest expense is also hefty due to the higher loan quantum now as compared to when you purchased your property years ago.
What should you do?
When choosing the most suitable way forward, there are several factors to consider. Firstly, assess the potential appreciation of your current home. Without knowing its location, we can’t offer specific advice, but if the appreciation can cover the costs involved, the first option might provide more flexibility. This way, you wouldn’t necessarily be tied to renting for over 30 months if you prefer not to stay in that area. You can then make your housing purchase decision later on.
If you are considering the second option and plan to stay long-term, evaluate whether the developments within 1 km of Kuo Chuan Presbyterian Primary School meet your living requirements. The choice of property will depend on your specific objectives and holding period. We’ve shown through extensive data that even old leasehold condos can do well. Of course, every leasehold condo would eventually either go en bloc or run down its lease to $0, so your holding period is important. But the options highlighted in Toa Payoh aren’t old to the extent that they cannot appreciate in the next 10-20 years. At the very least, there’s real estate inflation, limited supply and a popular school that could support your price.
Alternatively, if neither of the above options seems suitable, you might consider purchasing a property with strong appreciation potential that you plan to live in long-term. You could then rent out this property while renting near Kuo Chuan Presbyterian for 30 months. Although the rental income may not fully cover the costs, this approach offers the advantages of both scenarios. This is, however, very dependent on the property you purchase. As you already own a condo, selling it to buy another incurs extra costs – namely the Buyers Stamp Duty and legal fees.
Although HDBs have experienced substantial growth since the pandemic, they are more regulated and showed stagnant prices prior to the pandemic due to regulations from 2013. While HDBs are more affordable and leave you with additional funds for other investments, they might not be the best long-term investment. However, we still wouldn’t rule this out completely especially if you plan to use as little cash as possible and invest it elsewhere – this is usually something we recommend for someone who can’t take a loan. However, leveraging on real estate has historically paid off as the appreciation, in the long term, has outweighed the interest expense of the loan.
Given your interest in securing a property as your own residence and as a long-term investment, a freehold property would no doubt be a logical choice. Should a freehold be too much of a stretch, we wouldn’t hesitate considering leasehold ones too for the reasons outlined above as the data shows you can still achieve your objective.
At Stacked, we like to look beyond the headlines and surface-level numbers, and focus on how things play out in the real world.
If you’d like to discuss how this applies to your own circumstances, you can reach out for a one-to-one consultation here.
And if you simply have a question or want to share a thought, feel free to write to us at stories@stackedhomes.com — we read every message.
Need help with a property decision?
Speak to our team →Read next from Editor's Pick

Editor's Pick Happy Chinese New Year from Stacked

Property Market Commentary How I’d Invest $12 Million On Property If I Won The 2026 Toto Hongbao Draw

Overseas Property Investing Savills Just Revealed Where China And Singapore Property Markets Are Headed In 2026

Property Market Commentary We Review 7 Of The June 2026 BTO Launch Sites – Which Is The Best Option For You?
Latest Posts
New Launch Condo Reviews River Modern Condo Review: A River-facing New Launch with Direct Access to Great World MRT Station
On The Market Here Are The Cheapest 5-Room HDB Flats Near An MRT You Can Still Buy From $550K
On The Market A 40-Year-Old Prime District 10 Condo Is Back On The Market — As Ultra-Luxury Prices In Singapore Hit New Highs





2 Comments
Woodsville 28 is not freehold