Are 1 Bedroom Units A Good Investment? Analysing 3,834 Transactions From 2011
April 26, 2021
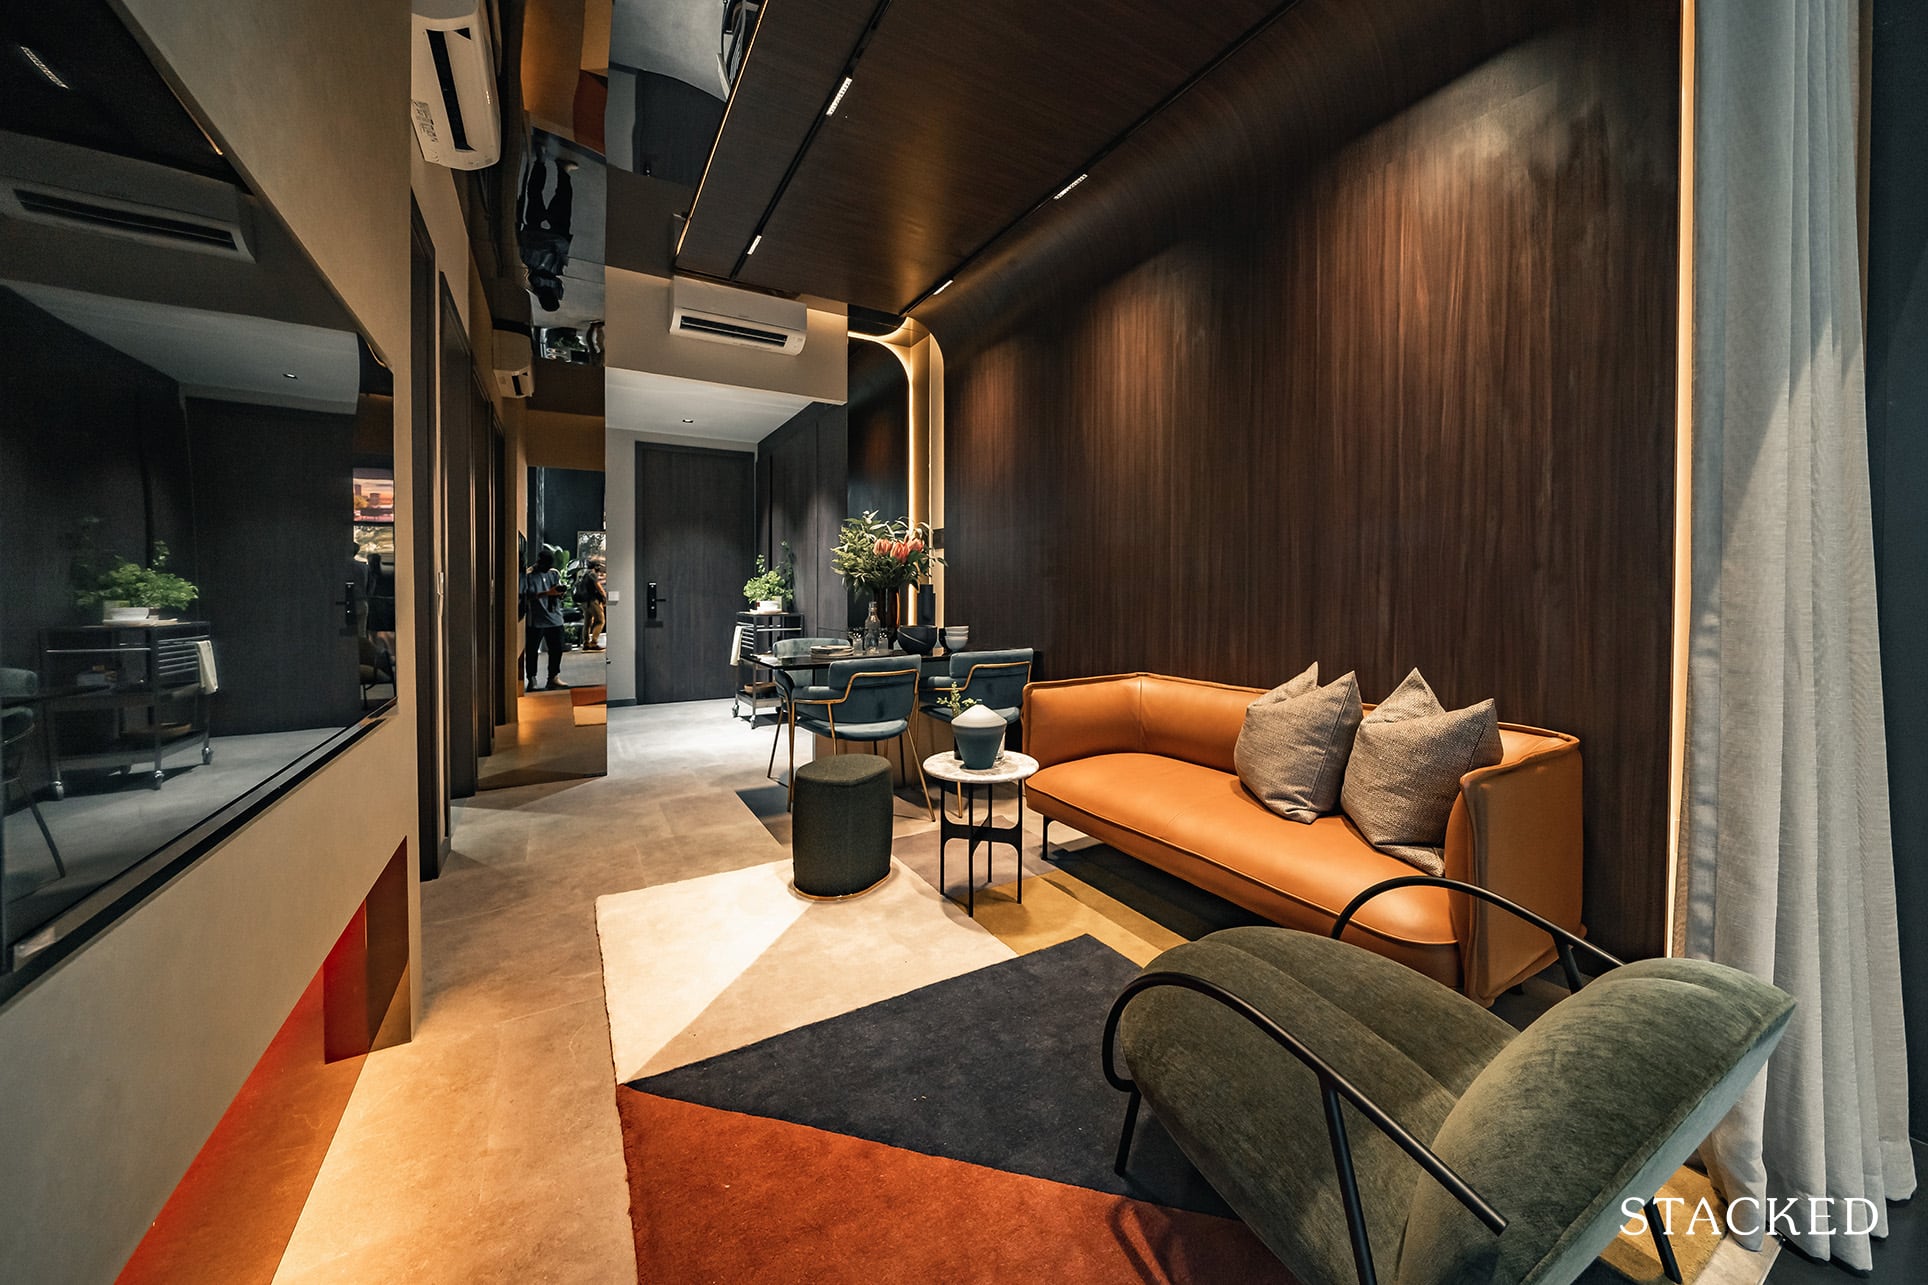
It’s probably no surprise to hear that 1 and 2 bedroom units in a new launch are always the first to sell out. You don’t even have to look too far for evidence on this either.
To give you an example, recent new launches like Midtown Modern (90% of 1 and 2 bedroom units sold at launch), Irwell Hill Residences sold over 50% of its units (81% of its units are 1 and 2 bedroom), and One-North Eden on the weekend – selling out its 1 and 2 bedroom units by 10am.
Make no mistake, this could be down to developers understanding which unit type moves the fastest. So for most new launches today you’d see that majority of the unit types will be dedicated to the smaller 1 and 2 bedroom units.
But there’s no question that much of it is all down to its low quantum, as these small units represent the lowest barrier of entry to those looking to get into property investment.
In this article, we look at whether it’s worth jumping into old-school, single-bedder condo investments:
The performance of 1 bedroom units since 2011
| District | Breakeven | Loss | Profit | Breakeven | Loss | Profit | Loss (quantum) | Profit (quantum) |
| 1 | 1 | 37 | 10 | 2.08% | 77.08% | 20.83% | -$110,322 | $53,562 |
| 2 | 1 | 24 | 60 | 1.18% | 28.24% | 70.59% | -$66,317 | $64,578 |
| 3 | 1 | 16 | 66 | 1.20% | 19.28% | 79.52% | -$40,488 | $77,841 |
| 4 | 11 | 4 | 0.00% | 73.33% | 26.67% | -$35,037 | $36,950 | |
| 5 | 16 | 42 | 0.00% | 27.59% | 72.41% | -$53,946 | $64,975 | |
| 7 | 9 | 0.00% | 0.00% | 100.00% | $90,450 | |||
| 8 | 25 | 15 | 0.00% | 62.50% | 37.50% | -$53,440 | $35,954 | |
| 9 | 58 | 39 | 0.00% | 59.79% | 40.21% | -$128,346 | $70,268 | |
| 10 | 32 | 36 | 0.00% | 47.06% | 52.94% | -$98,115 | $78,960 | |
| 11 | 34 | 18 | 0.00% | 65.38% | 34.62% | -$82,056 | $60,399 | |
| 12 | 1 | 76 | 218 | 0.34% | 25.76% | 73.90% | -$40,090 | $63,370 |
| 13 | 18 | 98 | 0.00% | 15.52% | 84.48% | -$60,000 | $68,562 | |
| 14 | 168 | 528 | 0.00% | 24.14% | 75.86% | -$45,212 | $61,757 | |
| 15 | 2 | 107 | 156 | 0.75% | 40.38% | 58.87% | -$45,913 | $48,157 |
| 16 | 1 | 46 | 120 | 0.60% | 27.54% | 71.86% | -$38,140 | $72,896 |
| 17 | 14 | 126 | 0.00% | 10.00% | 90.00% | -$42,879 | $59,271 | |
| 18 | 25 | 229 | 0.00% | 9.84% | 90.16% | -$24,642 | $70,866 | |
| 19 | 2 | 86 | 488 | 0.35% | 14.93% | 84.72% | -$28,503 | $63,783 |
| 20 | 2 | 49 | 0.00% | 3.92% | 96.08% | -$87,500 | $86,595 | |
| 21 | 39 | 92 | 0.00% | 29.77% | 70.23% | -$43,832 | $40,854 | |
| 22 | 3 | 31 | 0.00% | 8.82% | 91.18% | -$24,467 | $82,958 | |
| 23 | 46 | 89 | 0.00% | 34.07% | 65.93% | -$32,319 | $45,061 | |
| 25 | 9 | 178 | 0.00% | 4.81% | 95.19% | -$43,148 | $91,513 | |
| 27 | 1 | 14 | 87 | 0.98% | 13.73% | 85.29% | -$35,444 | $73,861 |
| 28 | 6 | 124 | 0.00% | 4.62% | 95.38% | -$32,341 | $103,838 |
For the table above, we restricted our findings to units of 600 sq. ft. or below; units of this size would be considered a one-bedder today. We are looking at size because the term “one-bedder” has changed over time; for old condos there are even 900+ sq. ft. units that are labelled “one-bedders”.
We have also kept to transactions dated 14 January 2011 or later. This is when the Sellers Stamp Duty (SSD) was imposed. Transactions before this date could have been sub-sales (e.g., buying and selling the unit before it’s even completed), which would distort the view of potential returns.
The given rental yields are approximations based on available rental data; the given yield corresponds to the year of the sale.
Some key findings regarding 1 bedroom units
- Prime region 1 bedroom units fare the worst for gains
- There’s continued evidence that 1 bedroom units have superior yields
- Returns can get worse over longer holding periods
- Leasehold has generally outperformed freehold
- Smaller 1 bedroom units generally lose more
- Overall, profitable transactions significantly outnumber unprofitable ones
1. Prime region 1 bedroom units fare the worst for gains
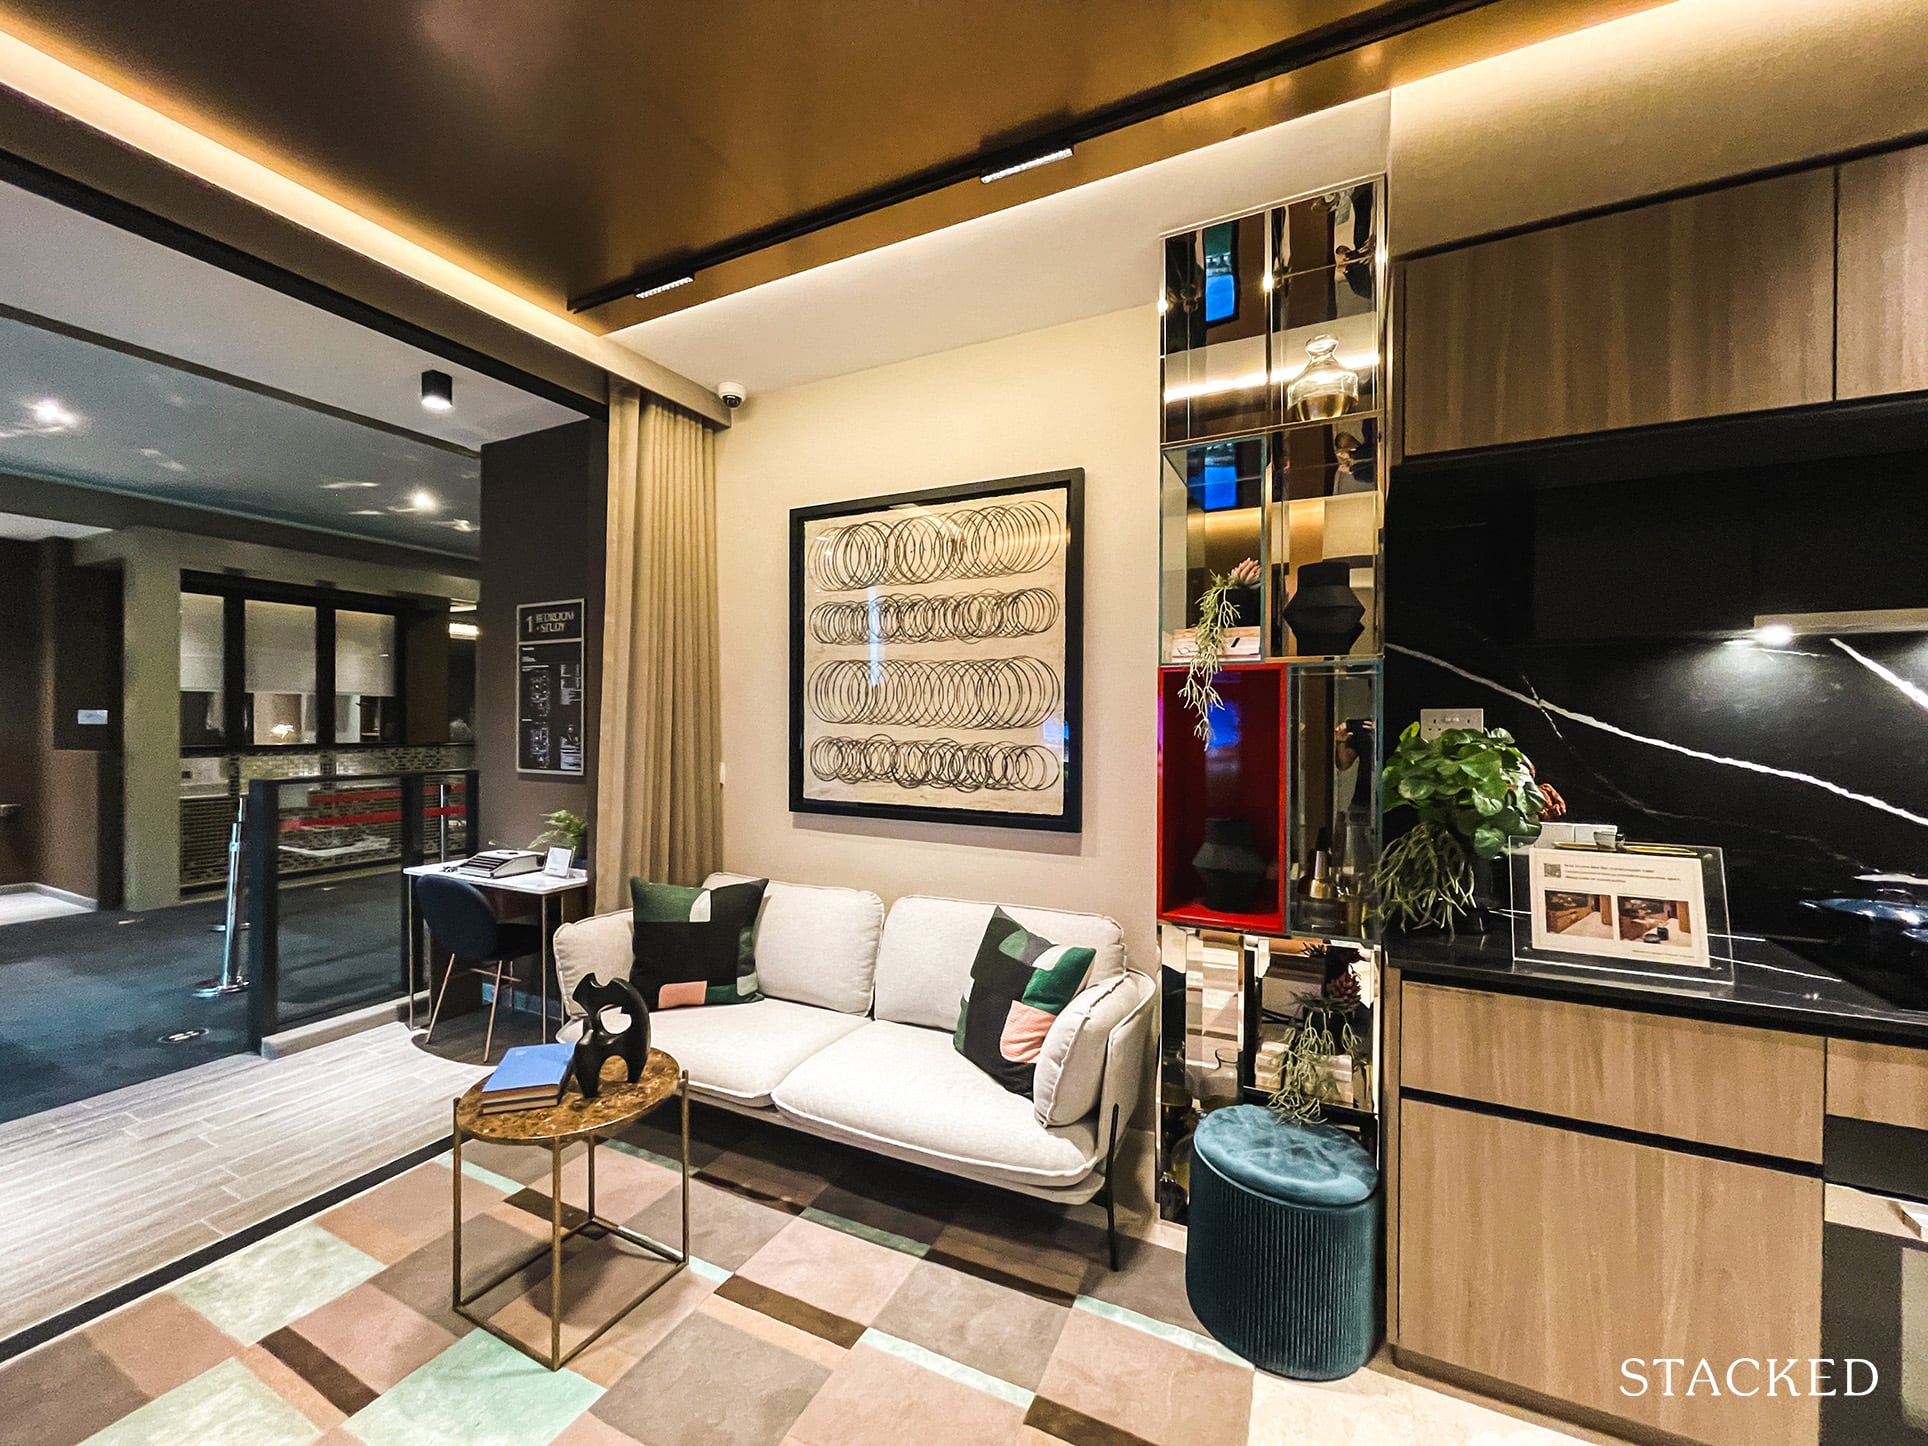
There’s an old saying that, if you want to invest in a 1 bedroom unit, you should only consider prime or central locations. The theory is that expatriate tenants will always favour places like District 9 or 10. Perhaps that’s true when it comes to rentability. When it comes to gains however, the opposite applies: prime region 1 bedroom units have the lowest percentage of profitable transactions.
For example, in District 1 (Marina Square, Raffles Place) 37 out of 48 recorded transactions were unprofitable. District 11 (Newton, Bukit Timah) saw 34 unprofitable transactions out of 52.
Close to the prime region, District 7 (Bugis, Beach Road) did manage to get a 100 per cent score on profitable transactions; but it’s questionable if this really counts, as there were only nine transactions.
Overall, we look at the top 10 districts for percentage of profitable transactions, only two are in the RCR. All others are Outside of Central Region (OCR), and none are from the CCR:
RCR, District 7 (Bugis, Beach Road) – 100% (but only nine transactions)
RCR, District 20 (Bishan, Thomson) – 96.08%
District 28 (Seletar, Yio Chu Kang) – 95.38%
District 25 (Woodlands) – 95.19%
District 22 (Jurong) – 91.18%
District 18 (Pasir Ris, Tampines) – 90.16%
District 17 (Changi) – 90%
District 27 (Sembawang, Yishun) – 85.29%
District 13 (MacPherson) – 84.8%
District 19 (Punggol, Sengkang) – 84.72%
This is due to the low quantum of single-bedders in the OCR. Even today, it’s possible to find new 1 bedroom units in the OCR that are priced below $750,000. This allows significant room for appreciation.
That said, gains don’t take into account your rental income. Once you factor this in, the overall returns could still place a high-cost, prime region condo ahead. As is, suffice it to say that – if you’re not expecting to rent out – a prime region 1 bedroom unit could be a dicier investment.
More from Stacked
Many readers write in because they're unsure what to do next, and don't know who to trust.
If this sounds familiar, we offer structured 1-to-1 consultations where we walk through your finances, goals, and market options objectively.
No obligation. Just clarity.
Learn more here.
Should You Buy Lentoria? A Detailed Pricing Review Against Lentor Modern, Lentor Hills Residences And Hillock Green
While we’ve always done this as part of our condo reviews, Lentoria is a particularly interesting one because there are…
2. There’s continued evidence that 1 bedroom units have superior yields
| Size category to rental yield (gross) | < 2.5% | 2.5% – 3% | 3.5% – 4% | 3% – 3.5% | 4% or more | No Data |
| Less than 400 sqft | 0 (0%) | 5 (1%) | 209 (24%) | 113 (44%) | 124 (26%) | 27 (6%) |
| 401 – 500 sqft | 4 (0%) | 85 (4%) | 776 (44%) | 838 (41%) | 67 (4%) | 135 (7%) |
| 501 – 600 sqft | 11 (1%) | 150 (10%) | 385 (44%) | 641 (27%) | 29 (2%) | 235 (16%) |
| Grand Total | 15 | 240 | 1370 | 1592 | 220 | 397 |
It’s a common saying that 1 bedroom units have the best rental yields among private property segments. The data so far continues to provide evidence that this is true.
The majority of 1 bedroom units (1,592 units) managed estimated gross rental yields of three to 3.5 per cent. Out of some 3,400+ 1 bedroom units tracked, only 15 units fell below a yield of 2.5 per cent.
For reference, the typical gross rental yield of a private residential unit in 2021 is between two to three per cent (HDB flats average five to seven per cent due to their lower quantum).
Investors who have less interest in gains, and just want to collect rent, will continue to favour these small units.
3. Returns can get worse over longer holding periods
| Holding Period | Breakeven | Loss | Profit | Breakeven | Loss | Profit | Loss (quantum) | Profit (quantum) |
| > 5 years | 6 | 683 | 1813 | 0.24% | 27.30% | 72.46% | -$53,642 | $60,919 |
| 3 – 5 Years | 3 | 206 | 991 | 0.25% | 17.17% | 82.58% | -$51,844 | $75,119 |
| Less Than 3 Years | 1 | 23 | 108 | 0.76% | 17.42% | 81.82% | -$67,049 | $92,180 |
| Total | 10 | 912 | 2912 | 0.26% | 23.79% | 75.95% | -$53,574 | $66,911 |
Among transactions where the unit was held for more than five years, about 72.4 per cent were profitable. However, this increases to 82.5 per cent for units held for three to five years.
Even among units held for less than three years, the percentage of profitable transactions is higher (81.8 per cent).
It’s hard to pinpoint the exact causes. However, one factor could be the huge spike in property prices leading up to 2013 (this was the cause of the cooling measures, which remain in place today).
From our start point of 2011 to 2013, we can see property prices climbing:
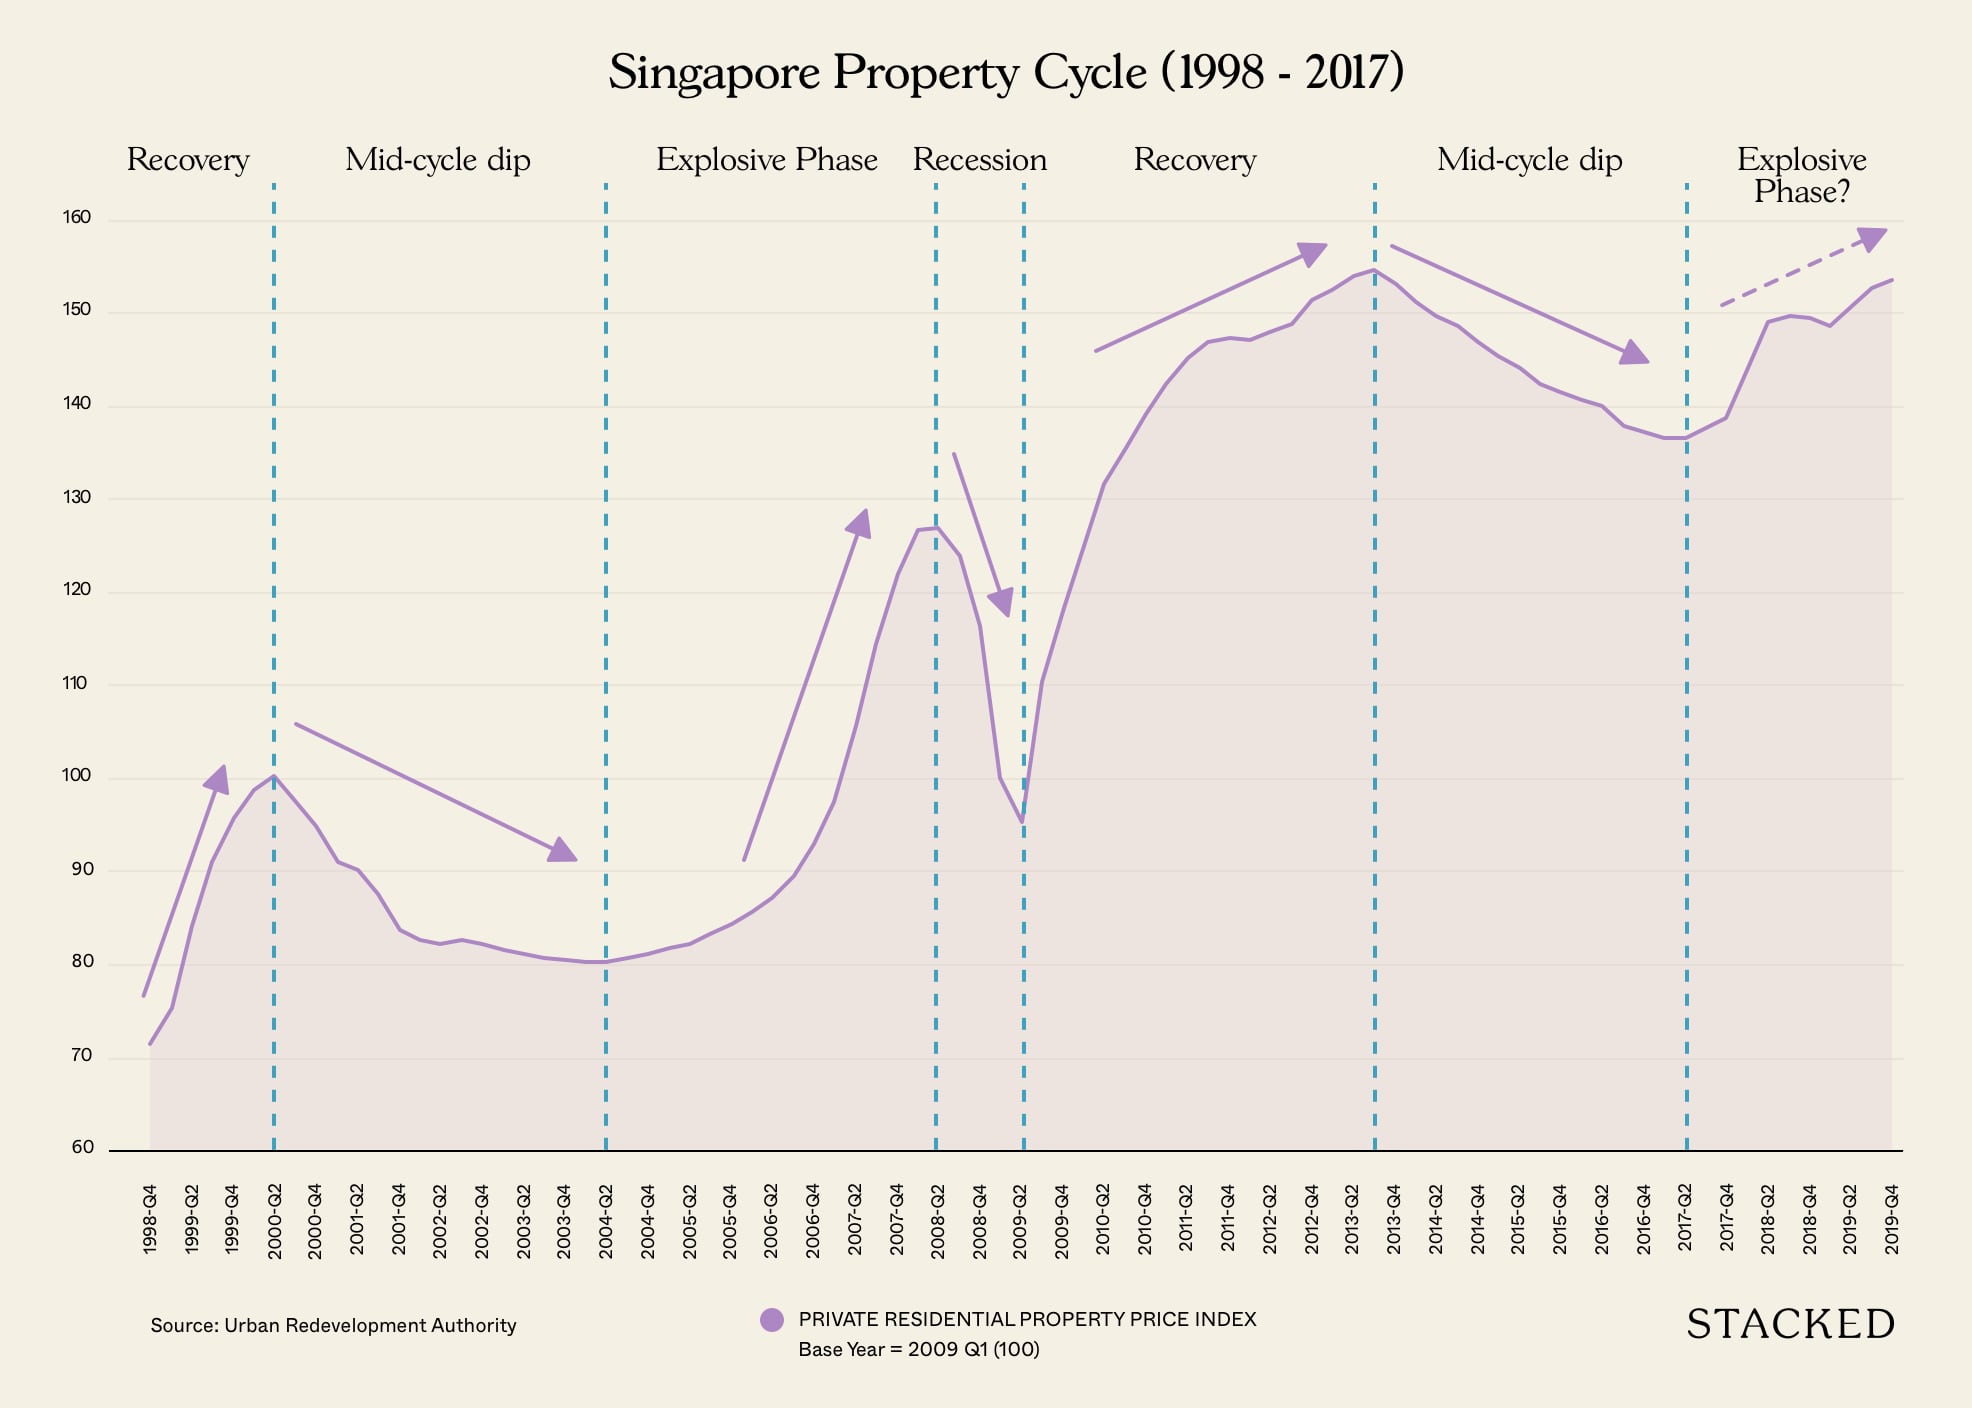
In addition to this run-up, there was a shoebox craze at the time; one that was only starting to subside in 2012. Due to the rising property market, many investors were eager to dive in even with limited capital; shoebox units were the most affordable units to them.
These buyers, who accepted inflated prices near 2013 but held for more than five years*, could account for many unprofitable transactions.
On the other hand, those who bought in 2016 or later would have entered at a time when cooling measures had muted demand and prices. This likely improved their resale gains.
*The intuitive reaction would be to hold and try to ride out the down period, because the cooling measures were deemed “temporary”. Few thought they would last – and in fact be intensified – over the next seven years.
The other reason, coming from perspectives on the ground, is that buyers who have waited so long are eager to move on. Many of these buyers are ready for their next step up, which involves selling off their 1 bedroom unit to buy a bigger condo, a cluster landed property, etc.
However, some have been frustrated to find it’s a tougher environment to sell, due to the ABSD (most buyers of 1 bedroom units are investors who already own another home). In addition, buyers have shown a general preference for new 1 bedroom units, rather than older resale units.
As such, some sellers are ready to drop their asking price to ensure a quick sale. Note that, even if they don’t see resale gains, they may not have experienced a financial loss. Many have received more than five years of rental income at this point, which makes a low selling price more palatable.
4. Leasehold has generally outperformed freehold
| Tenure | Breakeven | Loss | Profit | Loss | Profit | Loss (quantum) | Profit (quantum) |
| Freehold | 3 | 567 | 1048 | -6.68% | 8.60% | -$55,125 | $52,000 |
| Leasehold (60-years) | 4 | 72 | -2.84% | 9.66% | -$15,240 | $43,450 | |
| Leasehold (900+ years) | 37 | 39 | -6.27% | 9.90% | -$49,664 | $63,229 | |
| Leasehold (99-year above) | 7 | 304 | 1753 | -5.93% | 13.68% | -$51,660 | $76,871 |
| Total | 10 | 912 | 2912 | -6.40% | 11.70% | -$53,574 | $66,911 |
This is because freehold units can have a premium of as much as 20 per cent, over leasehold counterparts; so it’s unsurprising that, as a whole, leasehold sees more profitable transactions (13.68 per cent, versus 8.6 per cent for freehold).
What is surprising is that, even when held for over five years, freehold status doesn’t seem to help much.
For freehold properties held for over five years, 63 per cent of transactions are profitable. For leasehold properties held over five years, the percentage increases to 82.7 per cent.
Even adding lease decay as a factor, investors seem to be better off picking leasehold one-bedders.
5. Smaller 1 bedroom units generally lose more
| Size category | Breakeven | Loss | Profit | Breakeven | Loss | Profit | Loss (quantum) | Profit (quantum) |
| 401 – 500 sqft | 6 | 377 | 1522 | 0.31% | 19.79% | 79.90% | -$44,002 | $67,897 |
| 501 – 600 sqft | 3 | 385 | 1063 | 0.21% | 26.53% | 73.26% | -$68,327 | $69,306 |
| Less than 400 sqft | 1 | 150 | 327 | 0.21% | 31.38% | 68.41% | -$39,767 | $54,544 |
| Total | 10 | 912 | 2912 | 0.26% | 23.79% | 75.95% | -$53,574 | $66,912 |
Interestingly enough, if you were to divide the 1 bedroom units by different classification of unit sizes, you’ll find that 1 bedroom units that are less than 400 sqft (studios, usually), actually have a greater percentage that are loss making.
Perhaps there is a certain size barrier that most people can’t cross as of now. When it comes to purchasing it as a new launch before it is built, naturally that most affordable quantum price tag is attractive. But once it is built and sold on the resale market and buyers can see the real thing, that small size can be off putting to some.
6. Overall, profitable transactions significantly outnumber unprofitable ones
There are only five districts where 1 bedroom units saw more unprofitable than profitable transactions: districts 1, 4, 8, 9, and 11.
In most other districts we checked, the number of profitable transactions took a clear lead – only district 10 was at a near 50-50 split, with profitable transactions leading by around three percentage points.
This suggests that, while 1 bedroom units are a more speculative investment than conventional-sized units, they’re not as risky as sometimes portrayed.
The key concern in 2021 is the buyer demographic
In the near term, most buyers are HDB upgraders – they’ve made up the majority since late 2019. The problem here is that HDB upgraders tend to be family units; one-bedders are too small to fit them.
On top of this, there are concerns about how many foreign tenants we’re likely to see, while the Covid-19 pandemic is ongoing.
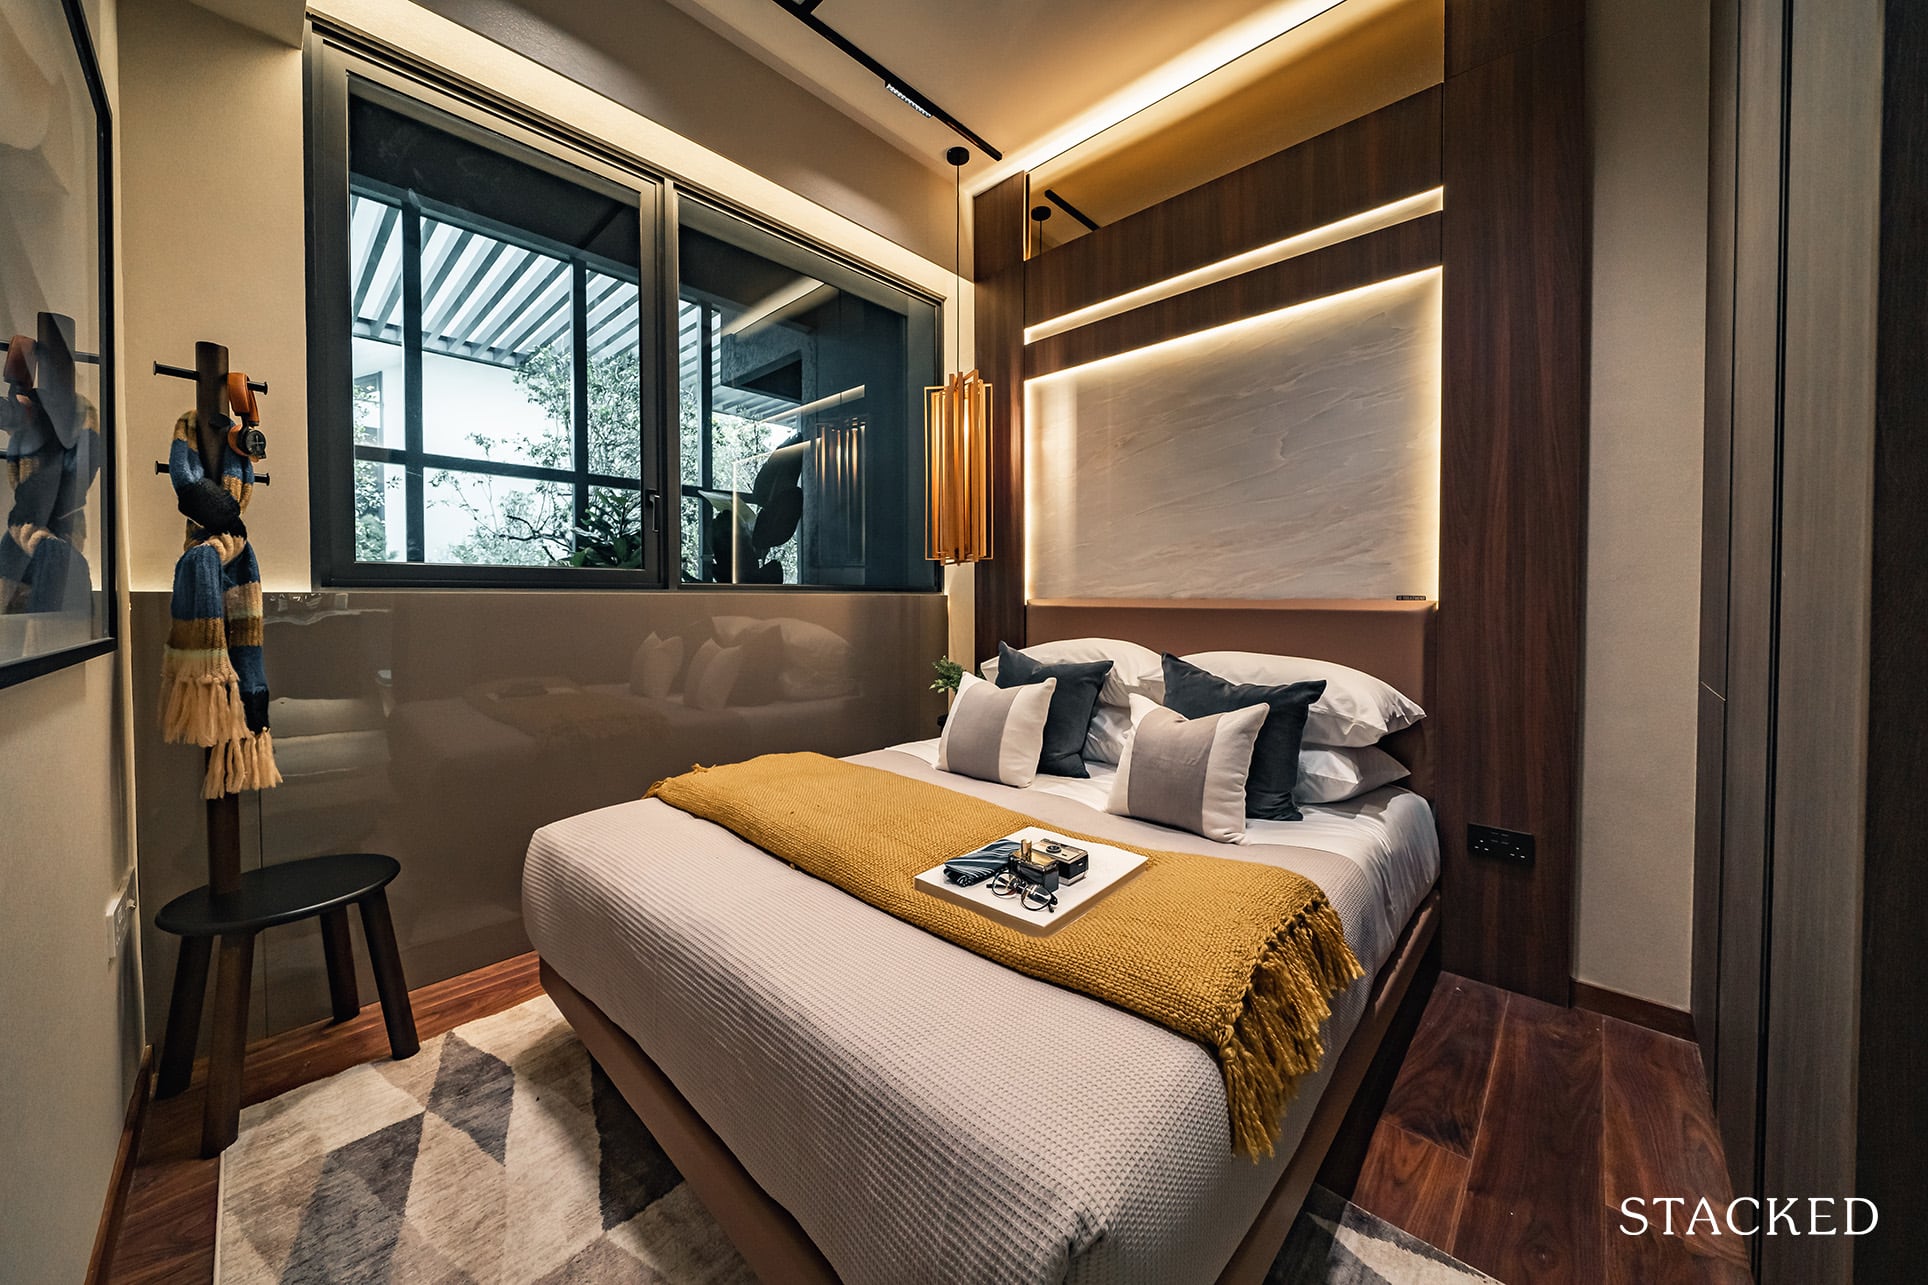
As such, this could make 1 bedroom units a tough sell in the near term; especially for resale units, as sellers need to contend with the slew of new launches. A 1 bedroom unit may not be right for every investor, despite the apparently high yields and low entry costs. If you’re uncertain, drop us a message so we can help you crunch the numbers.
At Stacked, we like to look beyond the headlines and surface-level numbers, and focus on how things play out in the real world.
If you’d like to discuss how this applies to your own circumstances, you can reach out for a one-to-one consultation here.
And if you simply have a question or want to share a thought, feel free to write to us at stories@stackedhomes.com — we read every message.
Frequently asked questions
Are 1 bedroom units a good investment in Singapore?
Which areas are better for investing in 1 bedroom units?
Do leasehold or freehold 1 bedroom units perform better financially?
How does the size of a 1 bedroom unit affect its investment potential?
Is it better to hold a 1 bedroom unit for a short or long period?
What are the main risks of investing in 1 bedroom units?
Ryan J. Ong
A seasoned content strategist with over 17 years in the real estate and financial journalism sectors, Ryan has built a reputation for transforming complex industry jargon into accessible knowledge. With a track record of writing and editing for leading financial platforms and publications, Ryan's expertise has been recognised across various media outlets. His role as a former content editor for 99.co and a co-host for CNA 938's Open House programme underscores his commitment to providing valuable insights into the property market.Need help with a property decision?
Speak to our team →Read next from Property Investment Insights

Property Investment Insights River Modern Starts From $1.548M For A Two-Bedder — How Its Pricing Compares In River Valley

Property Investment Insights This Singapore Condo Has Bigger Units Near The MRT — But Timing Decided Who Made Money

Property Investment Insights We Compared Lease Decay Across HDB Towns — The Differences Are Significant

Property Investment Insights This Singapore Condo Skipped 1-Bedders And Focused On Space — Here’s What Happened 8 Years Later
Latest Posts

Singapore Property News Why Some Singaporean Parents Are Considering Selling Their Flats — For Their Children’s Sake

New Launch Condo Reviews River Modern Condo Review: A River-facing New Launch with Direct Access to Great World MRT Station
On The Market Here Are The Cheapest 5-Room HDB Flats Near An MRT You Can Still Buy From $550K





0 Comments