New Launch vs Resale One and Two Bedders in D15: Here’s Where The Price Gaps Are The Biggest

Get The Property Insights Serious Buyers Read First: Join 50,000+ readers who rely on our weekly breakdowns of Singapore’s property market.

A seasoned content strategist with over 17 years in the real estate and financial journalism sectors, Ryan has built a reputation for transforming complex industry jargon into accessible knowledge. With a track record of writing and editing for leading financial platforms and publications, Ryan's expertise has been recognised across various media outlets. His role as a former content editor for 99.co and a co-host for CNA 938's Open House programme underscores his commitment to providing valuable insights into the property market.
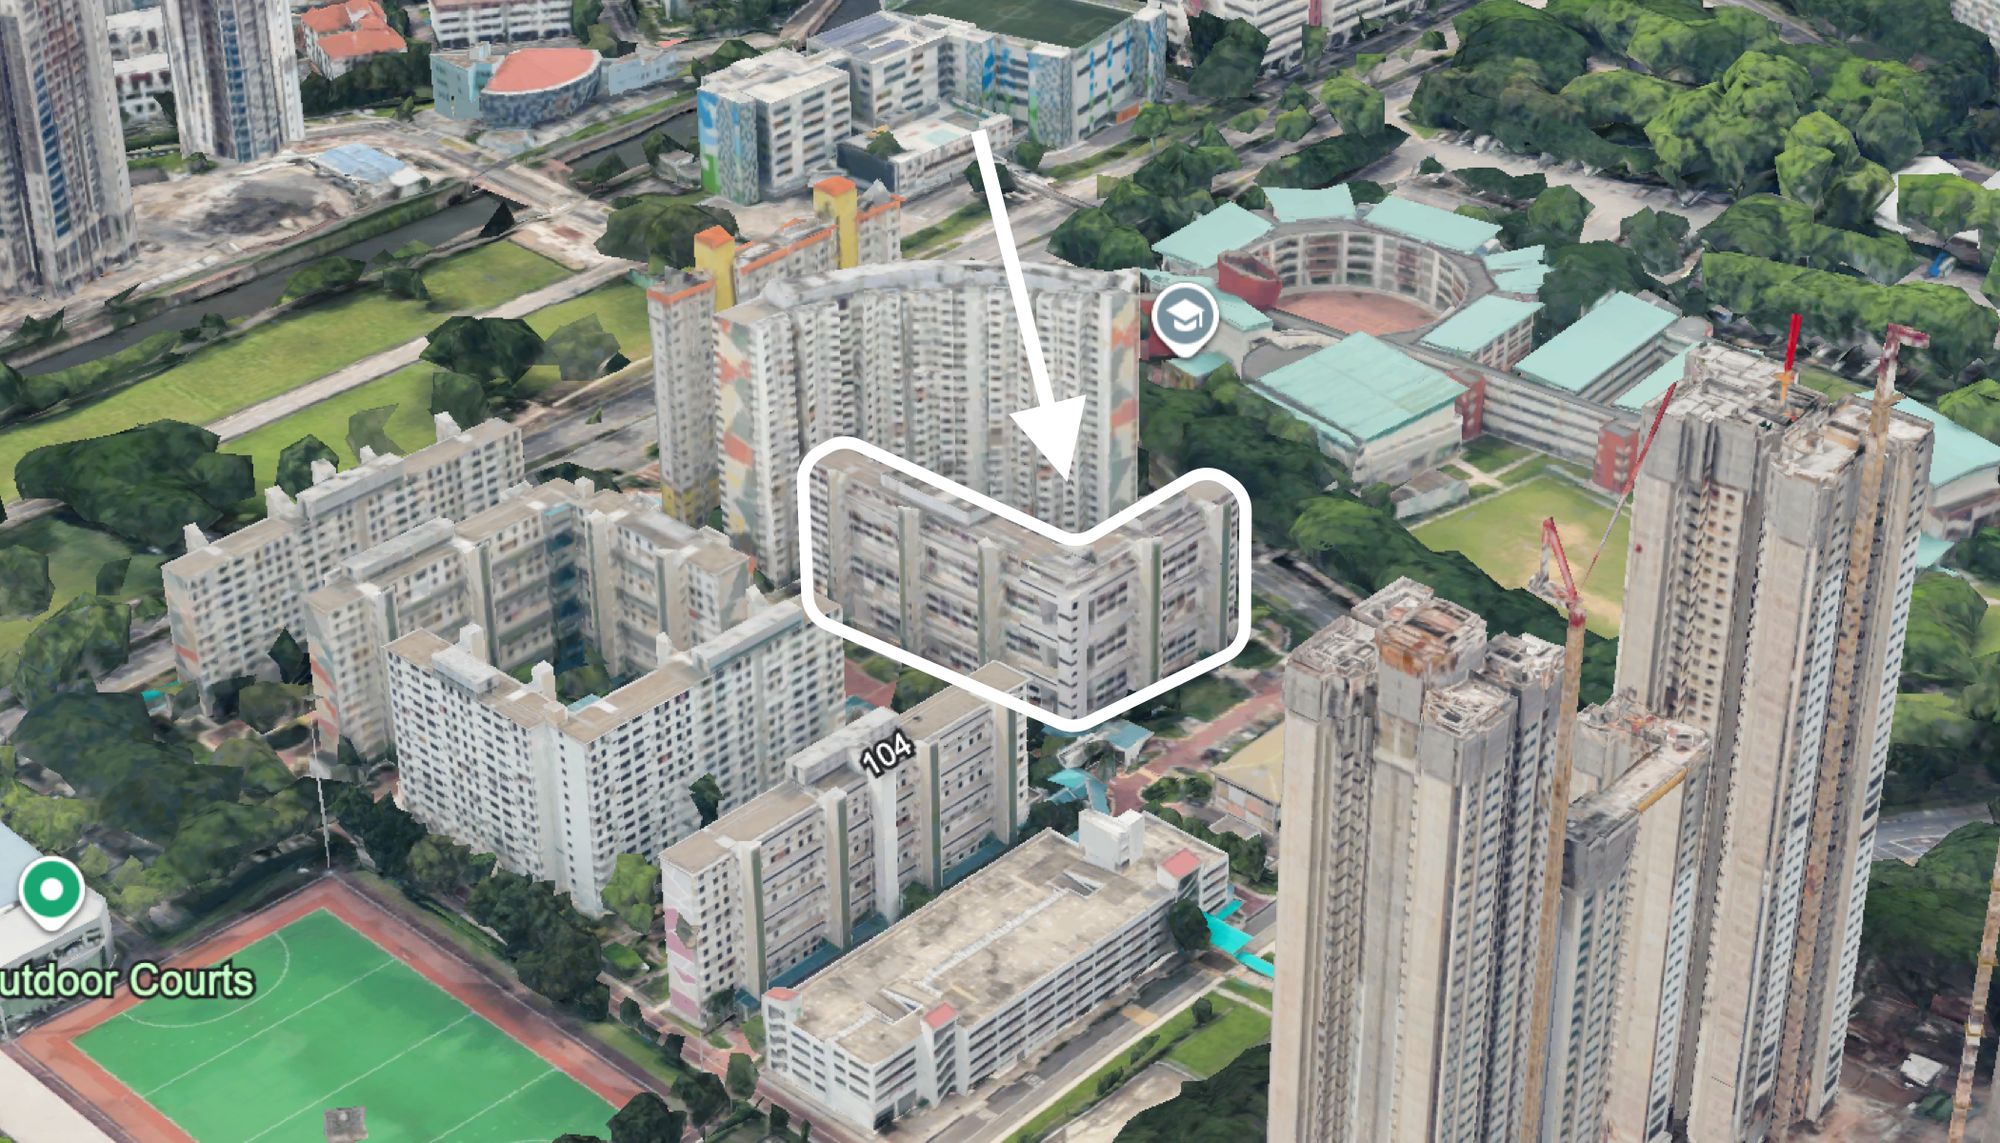
District 15 is one of the most recognisable names in the private property market. Mention it, and most Singaporeans will immediately think of Katong shophouses, East Coast Park, or Meyer Road’s “Millionaire’s Row.” It’s also a district where you can find almost every kind of private housing – boutique condos hidden in side lanes, sprawling old apartments from the 1980s, and shiny new launches with rooftop pools.
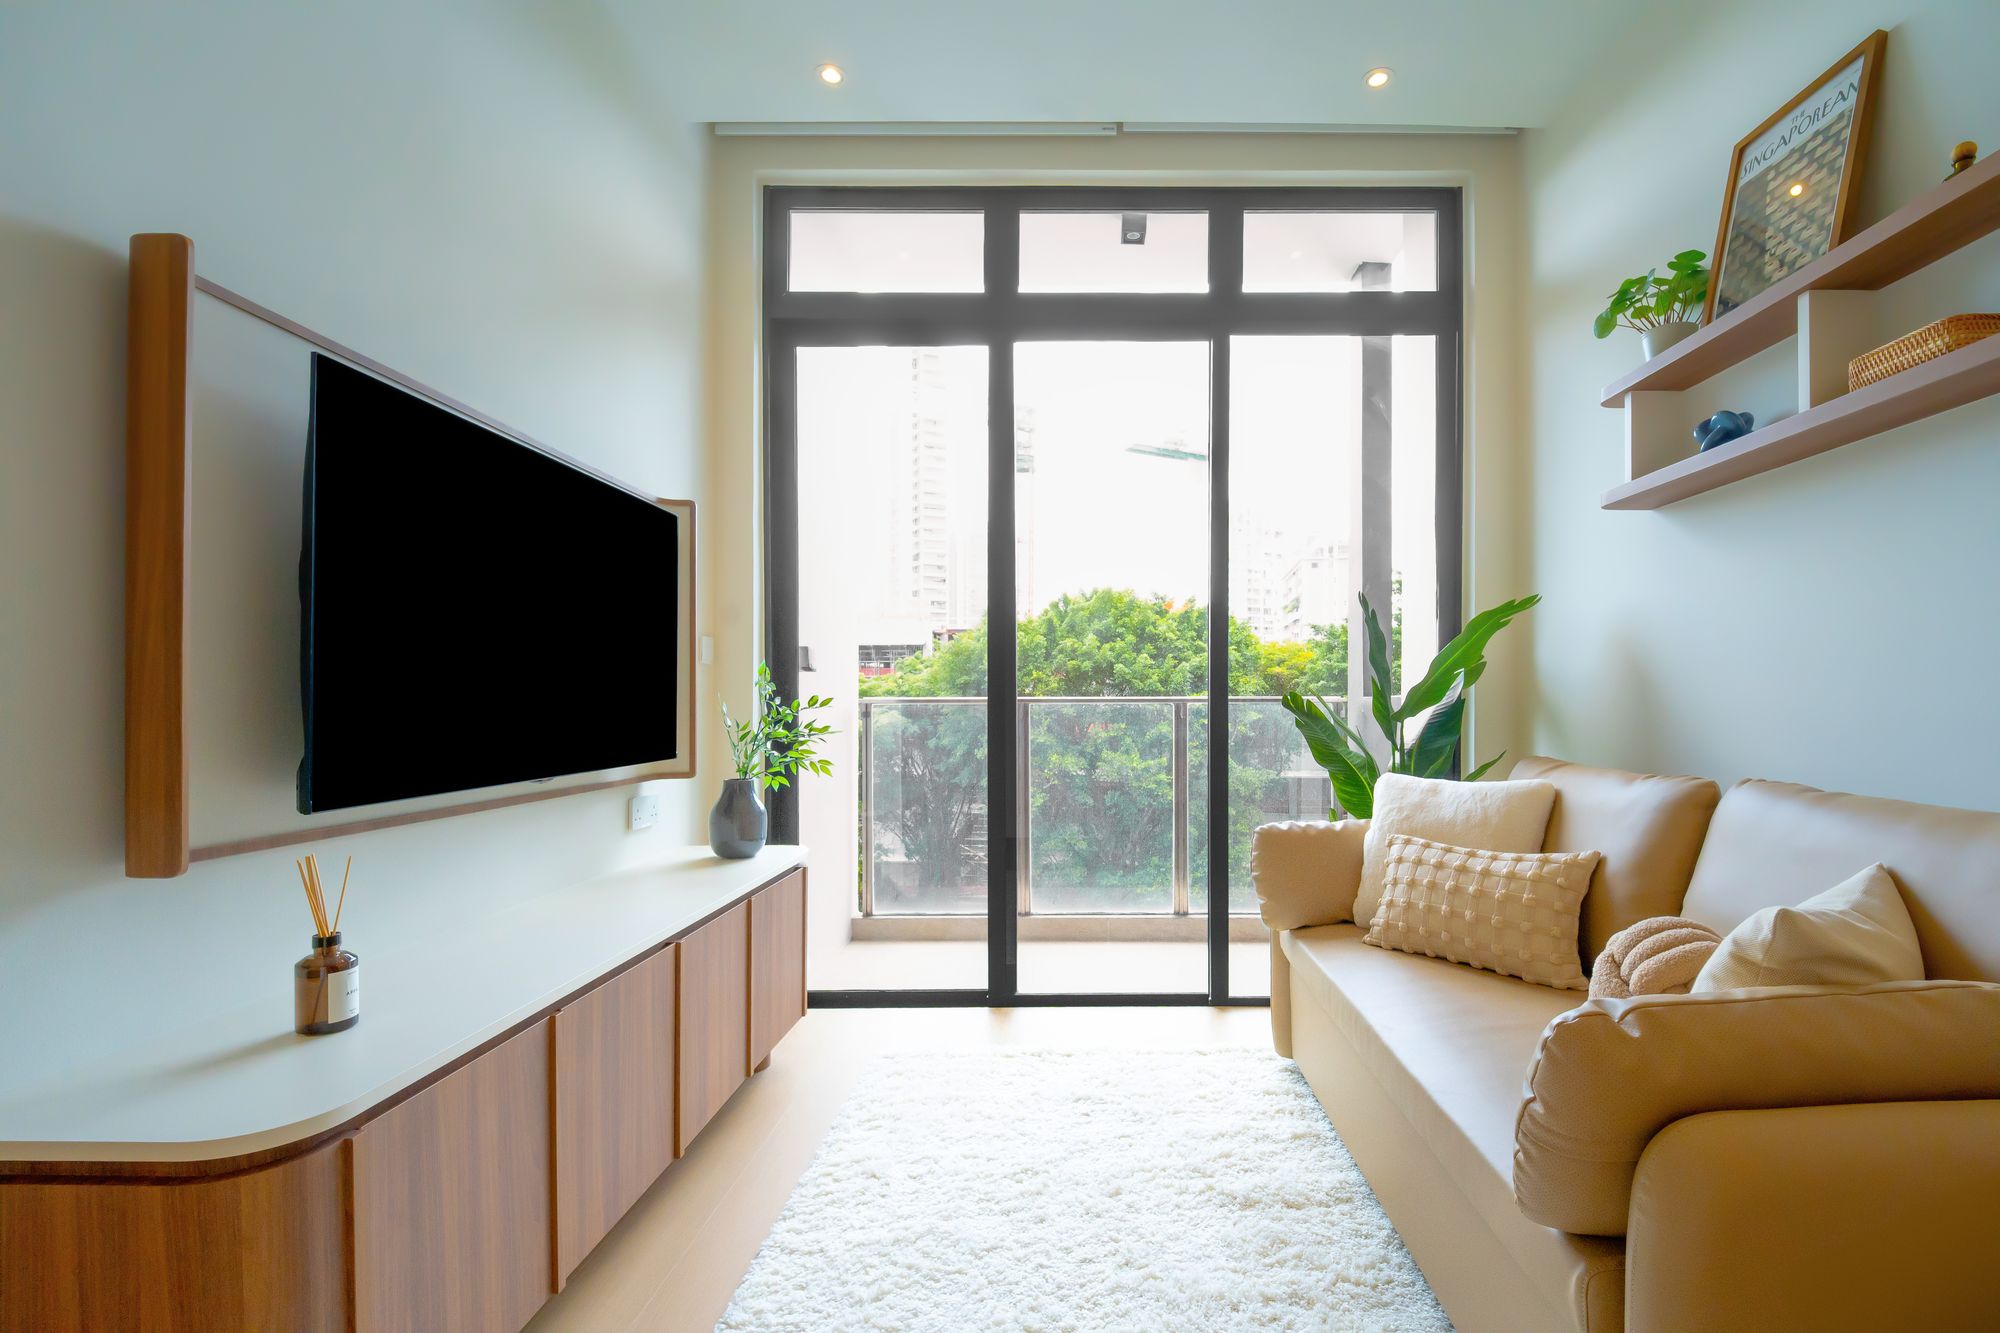
But for singles and couples, the real question isn’t Meyer Road versus East Coast Road, it’s whether to go for a bigger, older resale unit, or stick to a compact new launch. The gap between the two has widened in interesting ways, and it’s worth asking which side really delivers better value.
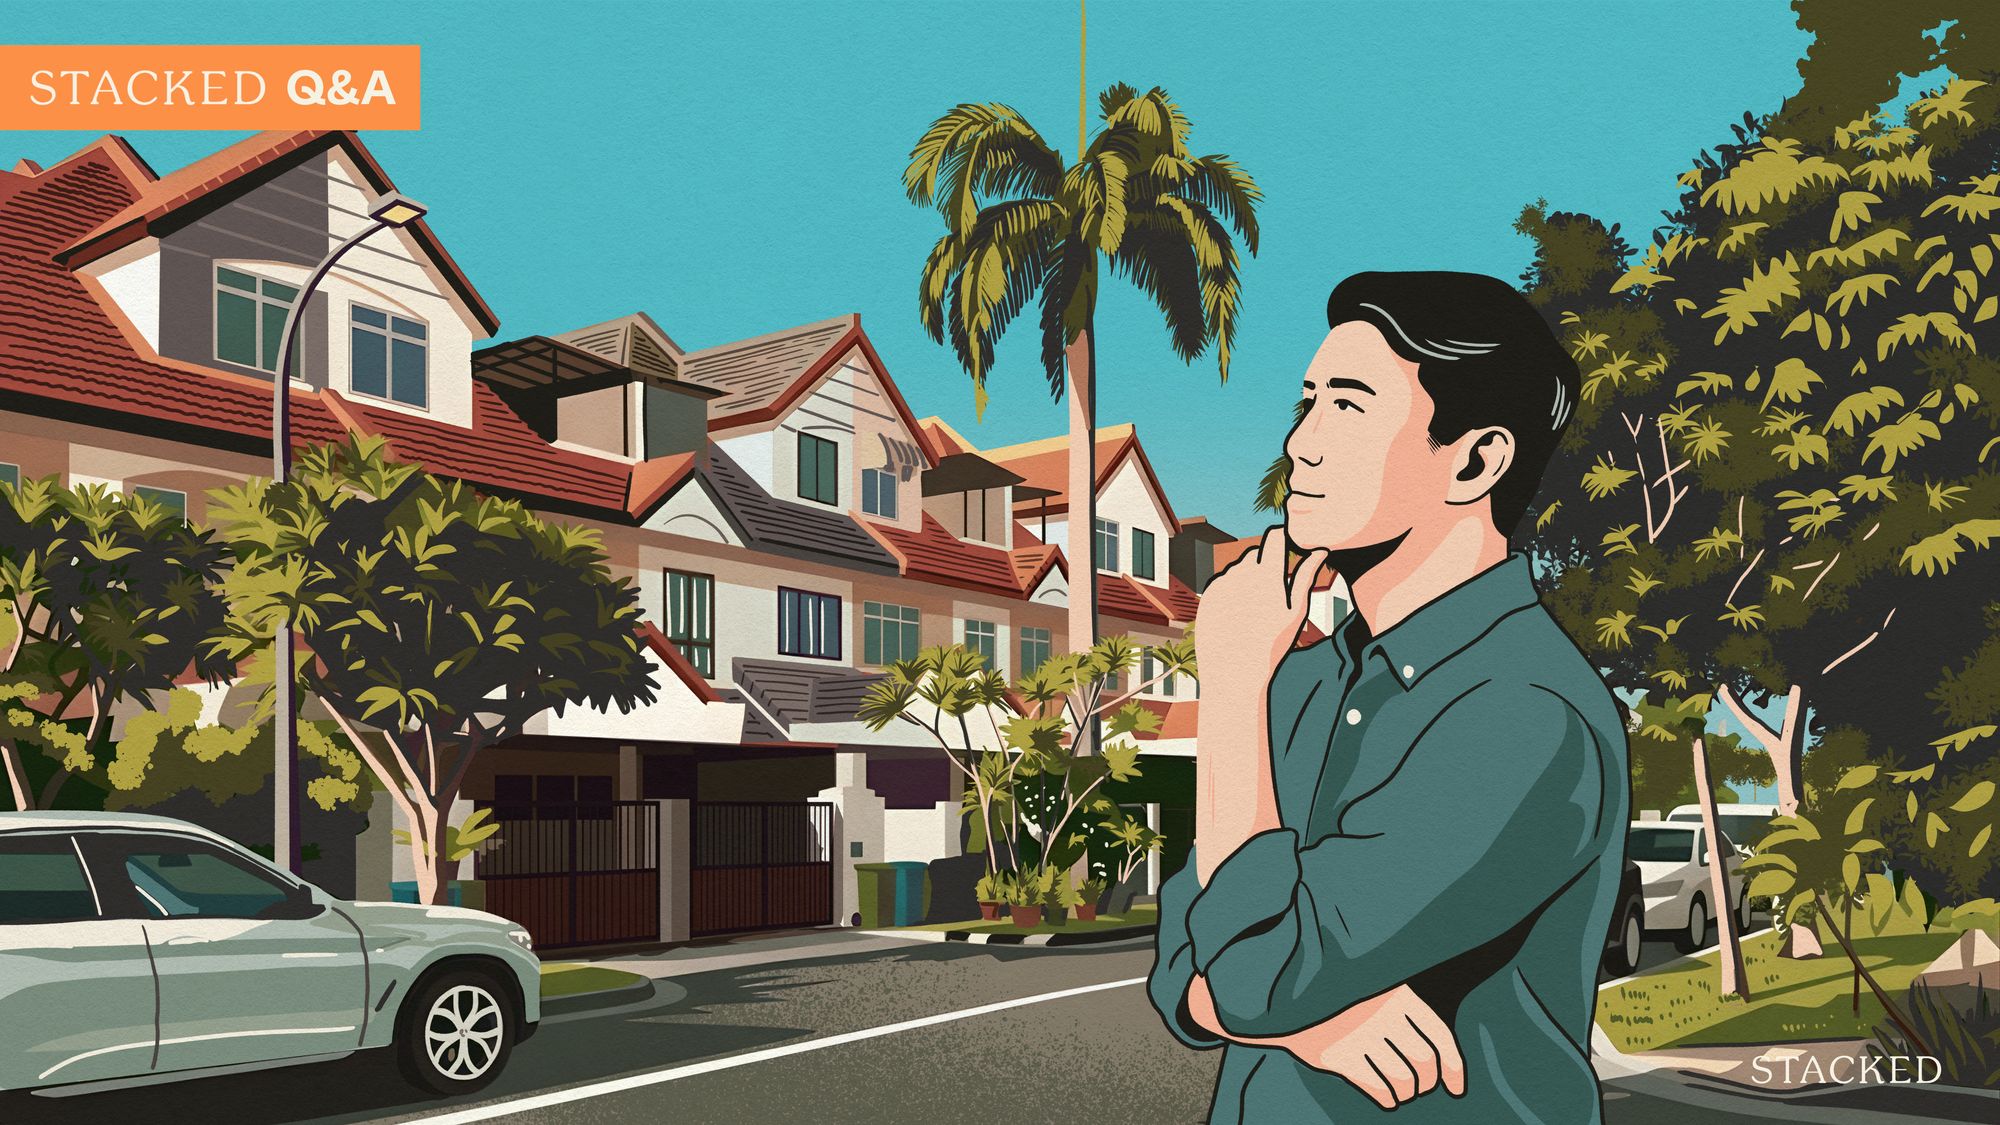
So is it worth buying a larger and pricier resale unit? Or should they stick to the new launch one and two-bedders, which may be a bit smaller, and hence sometimes cheaper (in an overall sense)? Here’s a deeper look at the state of the price gap:
Let’s start with the general price trend for D15
Year | New Sale | Sub sale and resale | % difference |
2014 | $1,609 | $1,230 | 30.73% |
2015 | $1,638 | $1,222 | 34.11% |
2016 | $1,742 | $1,209 | 44.07% |
2017 | $1,756 | $1,306 | 34.50% |
2018 | $1,968 | $1,325 | 48.54% |
2019 | $2,342 | $1,317 | 77.78% |
2020 | $2,199 | $1,321 | 66.42% |
2021 | $2,351 | $1,458 | 61.26% |
2022 | $2,390 | $1,575 | 51.69% |
2023 | $2,549 | $1,711 | 48.99% |
2024 | $2,683 | $1,805 | 48.66% |

Overall, the price gap between new launches and resale units has widened by almost 18 per cent from 2014 to 2024. The most dramatic divergence came in 2019, when new sale prices surged ahead to create a gap of nearly 78 per cent, the widest margin in the decade. This was largely due to the launches of Seaside Residences and Amber Park, which drove up the price gap that year.
The most dramatic divergence came in 2019, when new sale prices surged ahead to create a gap of nearly 78 per cent, the widest margin in the decade.
Following that, the COVID pandemic struck in 2020, which drove up housing prices across the market.
With this broad trend in mind, let’s break the numbers down by bedroom type:
1-bedroom units
Year | New Sale | Sub sale and resale | % difference |
2014 | $1,710 | $1,436 | 19.08% |
2015 | $1,793 | $1,429 | 25.47% |
2016 | $1,796 | $1,357 | 32.40% |
2017 | $1,813 | $1,531 | 18.44% |
2018 | $1,843 | $1,511 | 22.02% |
2019 | $2,429 | $1,384 | 75.49% |
2020 | $2,244 | $1,450 | 54.80% |
2021 | $2,374 | $1,501 | 58.16% |
2022 | $2,466 | $1,600 | 54.11% |
2023 | $2,570 | $1,777 | 44.67% |
2024 | $2,723 | $1,854 | 46.93% |

The price gap for one-bedders in District 15 has been especially volatile. From 2014 to 2024, the difference widened from about 19 per cent to nearly 47 per cent. The sharpest spike came in 2019, when new launch prices surged, pushing the gap to over 75 per cent (as mentioned earlier, we can attribute this to Seaside Residences and Amber Park).
Although the gap narrowed after that peak, it remained consistently high; often above 50 per cent through 2020 to 2022, before settling closer to the 45 per cent range in 2023 and 2024.
2-bedroom units
Year | New Sale | Sub sale and resale | % difference |
2014 | $1,626 | $1,295 | 25.57% |
2015 | $1,663 | $1,243 | 33.80% |
2016 | $1,785 | $1,294 | 37.92% |
2017 | $1,767 | $1,374 | 28.60% |
2018 | $2,200 | $1,321 | 66.56% |
2019 | $2,399 | $1,373 | 74.78% |
2020 | $2,350 | $1,376 | 70.78% |
2021 | $2,458 | $1,463 | 67.97% |
2022 | $2,414 | $1,599 | 50.98% |
2023 | $2,585 | $1,746 | 48.02% |
2024 | $2,802 | $1,890 | 48.25% |

The two-bedder price gap widened more significantly than one-bedders, and has stayed that way for most of the decade.
In 2014, new launches were priced about 26 per cent higher than resale counterparts. By 2018, the difference had ballooned to nearly 67 per cent, before peaking in 2019 at almost 75 per cent.
Even after that peak, the gap remained high through 2020 and 2021, hovering above 65 per cent. It only began to narrow more from 2022 onward, with the gap narrowing to about 48 per cent by 2023 and 2024.
But $PSF may be less useful today, as developers have shrunk unit sizes to keep the overall quantum lower.
With that in mind, let’s shift the comparison from $PSF to total quantum across the various bedroom types.
1-bedroom units
Year | New Sale | Sub sale and resale | Price difference | % difference |
2014 | $983,656 | $768,748 | $214,908 | 27.96% |
2015 | $1,100,508 | $726,202 | $374,307 | 51.54% |
2016 | $1,014,329 | $734,292 | $280,037 | 38.14% |
2017 | $1,005,242 | $924,603 | $80,639 | 8.72% |
2018 | $1,028,274 | $834,100 | $194,174 | 23.28% |
2019 | $1,175,765 | $872,641 | $303,124 | 34.74% |
2020 | $1,114,752 | $750,965 | $363,787 | 48.44% |
2021 | $1,170,863 | $832,030 | $338,833 | 40.72% |
2022 | $1,273,566 | $874,975 | $398,591 | 45.55% |
2023 | $1,294,609 | $930,155 | $364,453 | 39.18% |
2024 | $1,357,950 | $989,677 | $368,273 | 37.21% |
% increase from 2014 to 2024 | 38.05% | 28.74% |

From 2014 to 2024, new one-bedders saw a 38.05 per cent increase in overall quantum, compared to 28.74 per cent for subsale and resale counterparts. During the aftermath of COVID in 2022, the price gap was close to $400,000, largely due to housing supply shortages in that era.
Over the past 10 years though, there was only one year (2017) where the percentage difference in price dipped below 20 per cent. This was due to 2017 being a low point in the property market after repeated cooling measures, and being the end point of the “shoebox craze.”
2-bedroom units
Year | New Sale | Sub sale and resale | Price difference | % difference |
2014 | $1,399,203 | $1,261,355 | $137,847 | 10.93% |
2015 | $1,468,704 | $1,201,157 | $267,547 | 22.27% |
2016 | $1,369,383 | $1,244,106 | $125,277 | 10.07% |
2017 | $1,397,951 | $1,291,568 | $106,383 | 8.24% |
2018 | $1,512,856 | $1,286,024 | $226,833 | 17.64% |
2019 | $1,723,582 | $1,310,045 | $413,537 | 31.57% |
2020 | $1,647,279 | $1,325,455 | $321,824 | 24.28% |
2021 | $1,761,972 | $1,396,415 | $365,557 | 26.18% |
2022 | $1,825,005 | $1,503,834 | $321,171 | 21.36% |
2023 | $1,845,332 | $1,581,051 | $264,281 | 16.72% |
2024 | $1,907,467 | $1,687,632 | $219,835 | 13.03% |
% increase from 2014 to 2024 | 36.33% | 33.80% |

The percentage increase for both new and resale two-bedders has been fairly close over the past decade, although new units still maintain a slight lead.
We saw the biggest jump in 2019, as is the repeated pattern, when the gap briefly exceeded $400,000. But in six of the past 10 years, the price gap has hovered below 20 per cent.
Let’s now take a look at the average unit size
One tricky issue here is GFA harmonisation. Ever since 1st September 2022, developers can no longer include the square footage of certain non-liveable spaces, like air-con ledges, to the total square footage sold. As such, resale condos will often appear much bigger than newer condos on paper, even though the practical differences in space may be more negligible than you might think.
That being said, here are the size differences:
1-bedroom units
Year | New Sale | Sub sale and resale | Difference |
2014 | 572 | 559 | 13 |
2015 | 618 | 520 | 98 |
2016 | 587 | 559 | 29 |
2017 | 558 | 613 | -55 |
2018 | 558 | 557 | 1 |
2019 | 486 | 653 | -167 |
2020 | 502 | 522 | -20 |
2021 | 499 | 563 | -65 |
2022 | 522 | 555 | -34 |
2023 | 504 | 526 | -22 |
2024 | 499 | 547 | -48 |

2-bedroom units
Year | New Sale | Sub sale and resale | Difference |
2014 | 865 | 996 | -131 |
2015 | 887 | 986 | -99 |
2016 | 772 | 993 | -221 |
2017 | 792 | 959 | -167 |
2018 | 688 | 993 | -305 |
2019 | 721 | 968 | -247 |
2020 | 702 | 981 | -279 |
2021 | 719 | 973 | -254 |
2022 | 761 | 959 | -198 |
2023 | 715 | 919 | -204 |
2024 | 681 | 916 | -234 |

As we’ve mentioned above, new launches tend to have smaller average unit sizes compared to resale counterparts. Apart from GFA harmonisation, developers have had to build smaller, to ensure the overall price (not so much the $PSF) is palatable.
Based on 2024 transactions, one-bedders show the largest percentage price difference between new launches and resale.
For that reason, we’ll take a closer look at this segment first, before moving on to the other unit types.
We will separate the 99-year leasehold properties from the freehold ones (in which we include 999-year leases) to keep comparisons fair:
99-year leasehold
Year | New Sale | Sub sale and resale | Price difference | % difference |
2014 | $703,100 | $927,556 | -$224,456 | -24.20% |
2015 | $715,000 | $693,000 | $22,000 | 3.17% |
2016 | $832,750 | |||
2017 | $944,979 | $798,299 | $146,679 | 18.37% |
2018 | $1,031,747 | $997,988 | $33,760 | 3.38% |
2019 | $1,101,139 | $913,875 | $187,264 | 20.49% |
2020 | $1,069,901 | $887,250 | $182,651 | 20.59% |
2021 | $1,179,000 | $1,067,963 | $111,037 | 10.40% |
2022 | $1,295,641 | $1,115,886 | $179,755 | 16.11% |
2023 | $1,289,641 | $1,199,529 | $90,112 | 7.51% |
2024 | $1,345,758 | $1,186,626 | $159,132 | 13.41% |
999-year/freehold
Year | New Sale | Sub sale and resale | Price difference | % difference |
2014 | $1,034,666 | $742,127 | $292,539 | 39.42% |
2015 | $1,110,927 | $717,836 | $393,091 | 54.76% |
2016 | $1,014,329 | $723,606 | $290,723 | 40.18% |
2017 | $1,233,194 | $937,020 | $296,174 | 31.61% |
2018 | $889,350 | $819,063 | $70,287 | 8.58% |
2019 | $1,189,252 | $865,832 | $323,420 | 37.35% |
2020 | $1,133,440 | $730,848 | $402,591 | 55.09% |
2021 | $1,169,921 | $786,578 | $383,342 | 48.74% |
2022 | $1,234,433 | $836,391 | $398,042 | 47.59% |
2023 | $1,510,200 | $892,361 | $617,839 | 69.24% |
2024 | $1,551,000 | $935,558 | $615,442 | 65.78% |
Lease tenure does appear to be a cause of a wide price gap between new and resale one-bedders. The difference for 99-year leasehold units has generally remained within the 10 to 20 per cent range, but the gap for freehold projects has surged, reaching over 65 per cent in 2024.
To better understand why, let’s drill down into the one-bedder transactions recorded in 2024.
999-year/freehold New sale
Project | Average price | Average $PSF | Average size (sqft) for units transacted | Transaction volume |
THE CONTINUUM | $1,551,000 | $2,771 | 560 | 6 |
In 2024, The Continuum was the only new freehold project with one-bedders that registered new sale transactions.
Let’s examine the resale and sub sale transactions of other D15 projects to compare:
More from Stacked
Analysing Forest Woods Condo at Serangoon: Did This 2016 Project Hold Up Over Time?
In this Stacked Pro breakdown:
Project | Average price | Average $PSF | Average size (sqft) for units transacted | Transaction volume |
STRAITS RESIDENCES | $638,000 | $1,852 | 344 | 1 |
SUITES@ KATONG | $675,500 | $1,728 | 392 | 6 |
THE COTZ | $683,250 | $1,599 | 428 | 4 |
SUITES @ EASTCOAST | $684,000 | $1,781 | 384 | 3 |
HAIG 162 | $698,500 | $1,923 | 363 | 4 |
VIBES @ EAST COAST | $705,200 | $1,700 | 418 | 5 |
SUITES @ GUILLEMARD | $741,496 | $1,660 | 459 | 3 |
448@EAST COAST | $742,500 | $1,725 | 431 | 2 |
EVERITT EDGE | $750,000 | $1,742 | 431 | 1 |
PARC BLEU | $750,000 | $1,620 | 463 | 1 |
ESPIRA SUITES | $750,972 | $1,672 | 449 | 4 |
SYCAMORE TREE | $758,857 | $1,890 | 403 | 7 |
HERITAGE EAST | $770,000 | $1,760 | 438 | 3 |
IMPERIAL HEIGHTS | $800,000 | $1,770 | 452 | 2 |
SIGLAP V | $803,378 | $1,556 | 517 | 5 |
QUESTA @ DUNMAN | $806,000 | $1,872 | 431 | 3 |
AURA 83 | $808,000 | $1,668 | 484 | 1 |
THE LUCENT | $808,000 | $1,706 | 474 | 2 |
JUPITER 18 | $809,600 | $1,653 | 500 | 5 |
THE SERENNO | $835,000 | $1,724 | 484 | 1 |
VENTURA VIEW | $838,333 | $1,428 | 592 | 3 |
NATURALIS | $845,000 | $1,635 | 517 | 1 |
BELLA CASITA | $850,000 | $1,645 | 517 | 1 |
16 @ AMBER | $859,000 | $2,047 | 420 | 2 |
THE CRISTALLO | $880,000 | $1,543 | 570 | 1 |
38 I SUITES | $909,222 | $1,613 | 614 | 4 |
THE LUSH | $955,000 | $1,848 | 517 | 1 |
THE ODEON KATONG | $959,000 | $1,620 | 592 | 2 |
D’ CASTILIA | $977,400 | $1,593 | 614 | 2 |
SUNNY PARC | $978,000 | $1,398 | 700 | 1 |
DE CENTURION | $980,000 | $1,718 | 570 | 1 |
77 @ EAST COAST | $995,000 | $2,006 | 501 | 2 |
THE MONTAGE | $1,000,000 | $1,523 | 657 | 1 |
THE GERANIUM | $1,018,000 | $1,603 | 635 | 1 |
D’ECOSIA | $1,025,397 | $1,618 | 660 | 7 |
THE LINE @ TANJONG RHU | $1,038,000 | $2,473 | 420 | 1 |
IVORY | $1,070,000 | $1,630 | 657 | 1 |
FULCRUM | $1,075,000 | $2,270 | 474 | 2 |
8M RESIDENCES | $1,150,000 | $2,226 | 517 | 1 |
KATONG REGENCY | $1,175,000 | $1,859 | 643 | 4 |
THE SEAWIND | $1,201,000 | $1,791 | 671 | 3 |
COASTLINE RESIDENCES | $1,230,000 | $2,721 | 452 | 2 |
ONE AMBER | $1,250,000 | $2,191 | 570 | 2 |
NYON | $1,260,000 | $2,601 | 484 | 1 |
AMBER PARK | $1,318,200 | $2,848 | 463 | 5 |
THE SEA VIEW | $1,360,000 | $2,430 | 560 | 2 |
EASTERN LAGOON | $1,393,000 | $1,849 | 753 | 1 |
EIS RESIDENCES | $1,430,000 | $1,342 | 1066 | 1 |
SPRING GARDENS | $1,520,000 | $1,358 | 1119 | 1 |
MARINE BLUE | $1,547,500 | $2,091 | 794 | 4 |
COSTA ESTE | $1,780,000 | $1,243 | 1432 | 1 |
The Continuum stands out quite clearly. At an average price of $1.55 million, it was second only to Costa Este, which transacted higher but for much larger units (1,432 sq ft versus The Continuum’s 560 sq ft).
On a $PSF basis, The Continuum ranked among the very top, second only to Amber Park; but since Amber Park’s one-bedders are smaller on average, their overall quantum remains lower.
The resale and subsale market shows quite a wide spread. Average prices ranged from just $638,000 (Straits Residences) to $1.78 million (Costa Este), with more than half of the projects trading below $1 million. This drags down the overall average for resale, creating a large price gap.
It’s also worth noting that many of these resale transactions were in boutique projects, whereas The Continuum is a large 816-unit project. As such, this isn’t always an apples-to-apples comparison. Boutique projects are more exclusive and private, but they also lack the full range of condo facilities like The Continuum would have.
And while lease decay isn’t a factor for 999-year or freehold properties, older projects often come with dated designs and ageing facilities, which can contribute to a significant price gap.
For buyers weighing a resale option at a similar price point to The Continuum, Marine Blue comes closest in terms of average quantum.
Let’s take a look at how the two compare:

Both units are 1 + Study configurations, but Marine Blue’s is slightly larger in size. At Marine Blue, the study is spacious enough to function as a small bedroom, and it comes with sliding doors for full enclosure. In contrast, The Continuum’s study is more of an open nook – its positioning makes it more practical as a walk-in closet than a true work or sleep space.
Marine Blue also features a Jack and Jill bathroom, accessible from both the master bedroom and the living area. The Continuum’s bathroom, however, is only accessible via the study, which may limit convenience for guests.
Both layouts provide an open kitchen, compact dining area, and a living room that extends to an attached balcony. But Marine Blue has the additional benefit of a foyer, offering a greater sense of privacy compared to The Continuum’s entryway, which opens directly into the living area.
Taken together – especially with the Jack and Jill bathroom and the more versatile study – Marine Blue’s layout stands out as the more functional of the two.
(As an aside that’s unrelated to layouts, it’s worth mentioning that Marine Blue is closer to the Katong/East Coast expatriate enclave – it’s between Parkway Parade and i12 Orchard. The Continuum is more toward Paya Lebar, and given that one-bedders are often catered to renters, this may also give Marine Blue a slight edge.)
New sale
Project | Average price | Average $PSF | Average size (sqft) for units transacted | Transaction volume |
EMERALD OF KATONG | $1,329,459 | $2,745 | 484 | 74 |
TEMBUSU GRAND | $1,392,625 | $2,640 | 527 | 16 |
GRAND DUNMAN | $1,437,000 | $2,617 | 549 | 5 |
Sub sale and resale
Project | Average price | Average $PSF | Average size (sqft) for units transacted | Transaction volume |
TANJONG RIA CONDOMINIUM | $959,333 | $1,564 | 614 | 3 |
MANDARIN GARDENS | $1,030,000 | $1,407 | 732 | 2 |
SEASIDE RESIDENCES | $1,181,712 | $2,172 | 545 | 22 |
CASUARINA COVE | $1,242,500 | $1,589 | 780 | 2 |
COTE D’AZUR | $1,288,000 | $1,425 | 904 | 1 |
PEBBLE BAY | $1,483,333 | $1,627 | 915 | 3 |
All expected, all three new launches have noticeably higher $PSF, but come with a lower overall price due to the smaller units. And even the most affordable of the new launches, Emerald of Katong, already costs more than most of the resale projects.
The only resale project with a higher average quantum than all three new launches is Pebble Bay, and this is simply due to its higher square footage.
Overall, the percentage difference in pricing is narrower among leasehold compared to freehold projects in D15; even though individual developments may buck the trend.
In terms of practical experience, buyers with the budget for a resale one-bedder may find that their options for new launches are limited or out of reach in D15.
For buyers comparing directly against Emerald of Katong, the most affordable new launch – Cote D’Azur – comes closest in average price.
Let’s compare how their one-bedder floor plans measure up:

Emerald of Katong offers a 1 + Study, while Cote D’Azur is a straightforward one-bedroom unit (but still notably larger). There are a few similarities: in both layouts, the bathroom is accessible only from the master bedroom, and the living areas extend into a balcony. Their living and dining spaces are somewhat segregated, though the dining area in Cote D’Azur is clearly more generous.
Emerald of Katong’s “study” functions more as a nook than a true enclosed space. Its kitchen is open, in contrast to Cote D’Azur’s enclosed kitchen, which even comes with a yard and utility room; something that you will only find in older one-bedders today. The master bedroom at Cote D’Azur also opens to its own balcony, while its bathroom is notably spacious, featuring both a bathtub and a separate shower area.
The much larger unit size, together with features like the enclosed kitchen, yard, utility room, and full-sized master bathroom, gives Cote D’Azur the edge in terms of liveability. However, efficiency is another issue: for a landlord who simply wants a one-bedder to rent out (especially to shorter-term tenants), these may be seen as extraneous or unnecessary additions.
Now let’s look at the two-bedders
99-year leasehold
Year | New Sale | Sub sale and resale | Price difference | % difference |
2014 | $1,070,500 | $1,619,137 | -$548,637 | -33.88% |
2015 | $1,657,677 | |||
2016 | $1,542,515 | |||
2017 | $1,333,505 | $1,600,285 | -$266,780 | -16.67% |
2018 | $1,295,402 | $1,705,983 | -$410,581 | -24.07% |
2019 | $1,315,219 | $1,738,854 | -$423,635 | -24.36% |
2020 | $1,355,643 | $1,644,419 | -$288,776 | -17.56% |
2021 | $1,883,502 | |||
2022 | $1,868,324 | $2,064,840 | -$196,517 | -9.52% |
2023 | $1,824,611 | $2,096,172 | -$271,562 | -12.96% |
2024 | $1,817,065 | $2,348,369 | -$531,304 | -22.62% |
999-year/freehold
Year | New Sale | Sub sale and resale | Price difference | % difference |
2014 | $1,407,220 | $1,226,219 | $181,001 | 14.76% |
2015 | $1,468,704 | $1,154,631 | $314,073 | 27.20% |
2016 | $1,369,383 | $1,235,473 | $133,910 | 10.84% |
2017 | $1,673,189 | $1,298,366 | $374,823 | 28.87% |
2018 | $1,598,520 | $1,252,960 | $345,560 | 27.58% |
2019 | $1,746,269 | $1,325,413 | $420,857 | 31.75% |
2020 | $1,684,312 | $1,305,417 | $378,895 | 29.02% |
2021 | $1,761,972 | $1,355,624 | $406,347 | 29.97% |
2022 | $1,748,824 | $1,456,235 | $292,590 | 20.09% |
2023 | $1,887,993 | $1,561,685 | $326,307 | 20.89% |
2024 | $2,084,635 | $1,653,264 | $431,371 | 26.09% |
Among the 99-year leasehold condos, resale two-bedders have consistently transacted at higher quantums than new launches, by as much as 22.6 per cent in 2024. For freehold projects, the opposite is true: new launches have maintained a sizable premium over resale, with the gap widening to over 26 per cent in 2024.
This suggests that the price gap for two-bedders is largely driven by freehold developments. With that in mind, let’s drill down into the specific two-bedder transactions in 2024.
999-year/freehold
New sale
Project | Average price | Average $PSF | Average size (sqft) for units transacted | Transaction volume |
KOON SENG HOUSE | $1,842,857 | $2,345 | 786 | 3 |
MEYER MANSION | $2,000,000 | $2,903 | 689 | 1 |
THE CONTINUUM | $2,003,196 | $2,904 | 690 | 97 |
CLAYDENCE | $2,020,500 | $2,288 | 883 | 4 |
MEYER BLUE | $2,214,580 | $3,246 | 682 | 69 |
Sub sale and resale
Project | Average price | Average $PSF | Average size (sqft) for units transacted | Transaction volume |
STUDIOS@TEMBELING | $820,000 | $1,772 | 463 | 1 |
THE VANDERLINT | $894,500 | $1,614 | 554 | 2 |
VIBES @ EAST COAST | $980,000 | $1,570 | 624 | 1 |
JUPITER 18 | $985,888 | $1,696 | 581 | 1 |
SUITES @ EASTCOAST | $986,667 | $1,604 | 620 | 3 |
ISUITES @ MARSHALL | $1,000,000 | $1,660 | 603 | 2 |
CADENCE LIGHT | $1,020,000 | $1,504 | 678 | 1 |
PARC ELEGANCE | $1,024,000 | $1,552 | 662 | 2 |
JC RESIDENCE | $1,088,888 | $1,510 | 721 | 1 |
RESIDENCE 66 | $1,090,000 | $1,447 | 753 | 1 |
PALM OASIS | $1,095,000 | $1,373 | 802 | 2 |
SUNSHINE LOFT | $1,110,000 | $1,539 | 721 | 1 |
38 I SUITES | $1,119,000 | $1,750 | 639 | 5 |
HAIG 162 | $1,150,000 | $1,978 | 581 | 1 |
RADIX | $1,150,000 | $1,505 | 764 | 1 |
SUITES @ GUILLEMARD | $1,150,000 | $1,444 | 797 | 1 |
91 MARSHALL | $1,160,000 | $1,804 | 646 | 2 |
EVERITT EDGE | $1,200,000 | $1,593 | 753 | 1 |
ONE EIGHTIES RESIDENCES | $1,208,750 | $1,783 | 676 | 4 |
AQUARINE GARDENS | $1,220,000 | $1,667 | 732 | 1 |
THE CRISTALLO | $1,222,963 | $1,378 | 887 | 3 |
COASTARINA | $1,228,888 | $1,812 | 678 | 1 |
SIGLAP V | $1,236,815 | $1,398 | 897 | 6 |
IMPERIAL HEIGHTS | $1,237,000 | $1,810 | 678 | 2 |
CHELSEA LODGE | $1,240,000 | $1,600 | 775 | 1 |
SUNSHINE MANSIONS | $1,240,000 | $1,578 | 786 | 1 |
TIVOLI GRANDE | $1,251,667 | $1,603 | 782 | 3 |
THE ARISTO @ AMBER | $1,257,200 | $1,943 | 646 | 5 |
THE TREELINE | $1,260,000 | $1,582 | 797 | 1 |
SERAYA 9 | $1,265,000 | $1,567 | 808 | 2 |
THE BEACON EDGE | $1,270,000 | $1,873 | 678 | 1 |
THE AMBRA | $1,278,000 | $1,562 | 818 | 1 |
CRESCENDO PARK | $1,280,000 | $1,505 | 850 | 1 |
SANDY EIGHT | $1,300,000 | $1,878 | 692 | 3 |
SHIRO | $1,308,000 | $1,321 | 990 | 1 |
QUESTA @ DUNMAN | $1,320,000 | $1,752 | 753 | 1 |
AQUENE | $1,339,444 | $1,455 | 936 | 2 |
ESPIRA SPRING | $1,350,000 | $1,511 | 893 | 1 |
ONE @ PULASAN | $1,360,000 | $1,560 | 872 | 1 |
BLU CORAL | $1,363,444 | $1,242 | 1168 | 2 |
THE LINE @ TANJONG RHU | $1,370,000 | $2,401 | 570 | 2 |
SUNNY PARC | $1,400,000 | $1,429 | 980 | 1 |
CRANE COURT | $1,420,000 | $1,466 | 969 | 1 |
LA VIDA @ 130 | $1,427,500 | $1,378 | 1050 | 2 |
MABELLE | $1,428,888 | $1,619 | 883 | 1 |
DUNMAN REGENCY | $1,430,000 | $1,795 | 797 | 1 |
SPRING @ LANGSAT | $1,430,000 | $1,601 | 893 | 1 |
PARC BLEU | $1,452,500 | $1,285 | 1130 | 2 |
THE AMARELLE | $1,460,000 | $1,596 | 915 | 1 |
THE MINT RESIDENCES | $1,492,500 | $1,507 | 990 | 2 |
D’ CASTILIA | $1,500,000 | $1,679 | 893 | 1 |
DE CENTURION | $1,500,000 | $1,935 | 775 | 1 |
AURALIS | $1,505,000 | $1,722 | 877 | 2 |
FERNWOOD TOWERS | $1,538,888 | $1,906 | 807 | 1 |
GALAXY TOWERS | $1,560,000 | $1,464 | 1066 | 1 |
RICCHEZZA | $1,560,000 | $1,239 | 1259 | 1 |
THE LUSH | $1,560,000 | $1,907 | 818 | 1 |
THE BALE | $1,572,250 | $1,495 | 1053 | 4 |
CANTIZ @ RAMBAI | $1,600,000 | $1,414 | 1184 | 2 |
ESTIQUE | $1,629,444 | $1,508 | 1093 | 2 |
EASTERN LAGOON | $1,650,000 | $1,847 | 893 | 1 |
PALMERA RESIDENCE | $1,650,000 | $1,869 | 883 | 1 |
FLAMINGO VALLEY | $1,670,429 | $1,702 | 1037 | 7 |
CELESTIA | $1,675,000 | $1,533 | 1120 | 2 |
THE SOUND | $1,680,000 | $2,027 | 829 | 1 |
ENVIO | $1,695,000 | $1,640 | 1033 | 2 |
EAST GALLERIA | $1,700,000 | $1,903 | 893 | 1 |
EAST PALM | $1,700,000 | $1,612 | 1055 | 1 |
ESPIRA RESIDENCE | $1,703,800 | $1,190 | 1432 | 1 |
VERANDA | $1,740,000 | $1,600 | 1087 | 1 |
AMBER 45 | $1,751,250 | $2,584 | 681 | 4 |
ONE MEYER | $1,775,000 | $2,893 | 614 | 2 |
THE NCLAVE | $1,808,000 | $1,388 | 1302 | 1 |
FULCRUM | $1,820,000 | $2,021 | 926 | 2 |
HAIG COURT | $1,850,000 | $1,719 | 1076 | 1 |
THE CAPE | $1,850,000 | $2,176 | 850 | 1 |
NYON | $1,852,667 | $2,383 | 786 | 3 |
FORT GARDENS | $1,860,000 | $1,942 | 958 | 2 |
THE MAKENA | $1,860,000 | $1,819 | 1023 | 1 |
MODA | $1,874,148 | $2,125 | 881 | 6 |
CORALIS | $1,900,000 | $2,153 | 883 | 2 |
THE SEAWIND | $1,900,000 | $2,077 | 915 | 1 |
VERSILIA ON HAIG | $1,900,000 | $1,858 | 1023 | 1 |
CRYSTAL RHU | $1,960,000 | $1,858 | 1055 | 1 |
THE PALLADIUM | $1,965,000 | $2,226 | 883 | 1 |
BUTTERWORTH 8 | $2,000,000 | $1,956 | 1023 | 2 |
SEVENTY SAINT PATRICK’S | $2,019,000 | $2,382 | 848 | 4 |
AMBER PARK | $2,040,401 | $2,839 | 718 | 18 |
THE HACIENDA | $2,068,000 | $1,715 | 1206 | 1 |
PARKSHORE | $2,075,000 | $2,073 | 1001 | 2 |
PALM VISTA | $2,080,000 | $1,475 | 1410 | 1 |
HAIG RESIDENCES | $2,100,000 | $1,682 | 1249 | 1 |
ONE AMBER | $2,182,250 | $2,278 | 958 | 4 |
EMERALD EAST | $2,188,888 | $1,832 | 1195 | 1 |
COASTLINE RESIDENCES | $2,195,000 | $3,044 | 721 | 2 |
THE MEYERISE | $2,221,500 | $2,517 | 883 | 2 |
SPRING @ KATONG | $2,250,000 | $2,133 | 1055 | 1 |
THE ESTA | $2,250,000 | $2,113 | 1071 | 2 |
LA MEYER | $2,265,000 | $1,768 | 1281 | 1 |
THE VIEW @ MEYER | $2,375,000 | $2,229 | 1066 | 1 |
AMBER SKYE | $2,377,600 | $2,340 | 1016 | 5 |
EAST SIGNATURE | $2,380,000 | $1,235 | 1927 | 1 |
VERTIS | $2,380,000 | $1,974 | 1206 | 1 |
THE SEAFRONT ON MEYER | $2,416,667 | $2,268 | 1066 | 3 |
THE ATRIA AT MEYER | $2,450,000 | $2,347 | 1044 | 1 |
MEYER RESIDENCE | $2,451,800 | $2,301 | 1066 | 1 |
CUBIK | $2,480,000 | $1,170 | 2121 | 1 |
THE BELVEDERE | $2,490,000 | $2,461 | 1012 | 1 |
AMBER RESIDENCES | $2,520,000 | $2,168 | 1163 | 1 |
FORTUNE JADE | $2,628,000 | $1,411 | 1862 | 1 |
DUNMAN PLACE | $2,750,000 | $1,907 | 1442 | 1 |
For the new launches, the average two-bedder prices in 2024 ranged tightly between $1.84 million and $2.21 million. In contrast, resale prices had a much bigger range: from as low as $820,000 to as high as $2.75 million.
We will take Koon Seng House as the baseline – the most affordable new launch at $1.84 million. We can see that more than half of the resale projects transacted below this level, pulling the overall resale average down. The reason is exactly as we stated earlier: most resale two-bedders are simply much bigger than today’s new launches.
As we saw earlier, the overall price gap between new and resale two-bedders in District 15 was relatively small at 13 per cent in 2024. This suggests that buyers shopping at the mid- to high-end of the resale market could seriously consider a new launch instead.
For buyers weighing a resale alternative around the same price point as Koon Seng House, Fulcrum comes closest in terms of average pricing.
Let’s take a closer look at how their floor plans compare:

Both projects offer two-bedroom, two-bathroom units, though the one at Koon Seng House is larger in size.
At Koon Seng House, the common bathroom is designed as a Jack and Jill, accessible from both the walkway and the adjacent bedroom; so both bedrooms are ensuite. In Fulcrum, only the master bedroom has an attached bathroom.
Koon Seng House provides an enclosed kitchen, while Fulcrum has an open one (though its design allows it to be enclosed with some work). Both units feature spacious living and dining areas with an attached balcony, but Koon Seng House adds a household shelter, which Fulcrum lacks.
Considering the two ensuite bedrooms, enclosed kitchen, and additional storage space, Koon Seng House offers a more practical layout overall.
Let’s now take a look at the new and resale transactions for leasehold projects in 2024
New sale
Project | Average price | Average $PSF | Average size (sqft) for units transacted | Transaction volume |
EMERALD OF KATONG | $1,778,726 | $2,696 | 660 | 285 |
TEMBUSU GRAND | $1,991,759 | $2,619 | 762 | 29 |
GRAND DUNMAN | $2,034,111 | $2,739 | 743 | 27 |
Sub sale and resale
Project | Average price | Average $PSF | Average size (sqft) for units transacted | Transaction volume |
THE RED HOUSE | $1,225,000 | $1,662 | 737 | 2 |
MANDARIN GARDENS | $1,377,222 | $1,432 | 958 | 4 |
TANJONG RIA CONDOMINIUM | $1,443,500 | $1,627 | 888 | 2 |
SANCTUARY GREEN | $1,448,100 | $1,741 | 832 | 10 |
DUNMAN VIEW | $1,500,000 | $1,764 | 850 | 1 |
LEGENDA AT JOO CHIAT | $1,520,000 | $1,471 | 1033 | 1 |
VILLA MARINA | $1,536,000 | $1,359 | 1130 | 3 |
RIVEREDGE | $1,630,000 | $1,664 | 980 | 1 |
WATER PLACE | $1,650,000 | $1,825 | 904 | 1 |
SEASIDE RESIDENCES | $1,697,389 | $2,293 | 737 | 12 |
COSTA RHU | $1,891,143 | $1,406 | 1347 | 7 |
COTE D’AZUR | $2,027,000 | $1,728 | 1179 | 4 |
CASUARINA COVE | $2,053,333 | $1,602 | 1288 | 3 |
SILVERSEA | $2,076,074 | $2,041 | 1019 | 12 |
PEBBLE BAY | $2,425,200 | $1,785 | 1358 | 5 |
As identified earlier, Emerald of Katong costs more than most resale projects in 2024; and they come with a higher $PSF but lower quantum due to smaller sizes.
On the resale side, three developments – Casuarina Cove, Silversea, and Pebble Bay – registered higher average prices than all three new launches, new to a higher square footage.
While the overall price gap in 2024 was smaller than the freehold segment, discrepancies between individual projects can still be wide. Practically speaking, only buyers with budgets at the higher end of the resale market will be able to cross over into new launch territory.
For those weighing a resale alternative close to Emerald of Katong’s average pricing, Seaside Residences comes the closest.
Let’s compare the floor plans between the two:

Both units are two-bedders with two bathrooms, though the one at Seaside Residences is noticeably larger. For the most part, their layouts are similar, but there are a few key differences.
The unit at Emerald of Katong adopts a dumbbell layout, with bedrooms flanking the living space, while Seaside Residences uses a more conventional configuration. Dumbbell configurations are considered more efficient, because they eliminate the need for hallways (at the cost of some loss of privacy, as noise in the living area will affect both bedrooms). In both cases, only one bedroom is ensuite.
Their living and dining areas are segregated, with the living room extending into a balcony. Both feature open kitchens; Emerald of Katong’s is L-shaped, while Seaside Residences offers a U-shaped design.
Overall, there isn’t a clear discernible winner on layout alone. It will come down to personal preference and the size difference.
Conclusion:
For buyers in District 15, one- and two-bedders show the sharpest and most persistent premiums for new launches, especially in the freehold segment. Leasehold projects tell a more mixed story, but even here, newer units often hold the edge in terms of $PSF, while resale counterparts offer more space for the money.
Still, these are only the smaller formats. Families and long-term owner-occupiers are usually more focused on three-bedders and larger, where the calculus changes: resale units often come with far more generous layouts, and the quantum gaps don’t always favour new. We’ll explore that in the next part of this series, as we dive into three-bedders and up in D15, and see how the balance tips once space and liveability become the priority.
The challenge with one- and two-bedders in D15 isn’t just the price gap; it’s knowing whether to trade space for future liquidity. Too many buyers overpay for size without considering tenant demand and resale appetite.
Now you have a framework for weighing space against efficiency. We’ve applied this same approach to help clients secure smaller units that went on to outperform bulkier resale counterparts.
Interested to see how this works for your budget and timeline? Let’s chat.
Follow us on Stacked Pro for further deep dives into new launch and resale price gaps in the Singapore market.
Ryan J
A seasoned content strategist with over 17 years in the real estate and financial journalism sectors, Ryan has built a reputation for transforming complex industry jargon into accessible knowledge. With a track record of writing and editing for leading financial platforms and publications, Ryan's expertise has been recognised across various media outlets. His role as a former content editor for 99.co and a co-host for CNA 938's Open House programme underscores his commitment to providing valuable insights into the property market.Read next from Property Investment Insights

Property Investment Insights Analysing 10 Years of District 12 Boutique Condo Transactions: Insights Into What Drives Profitability

Property Investment Insights Do Primary Schools Really Matter For Property Prices In Singapore? These 6 Condos Suggest Otherwise

Property Investment Insights New Launch vs Resale Condos in District 7: Which Bedroom Types Offer Better Value Today?

Property Trends Condo vs HDB: The Estates With the Smallest (and Widest) Price Gaps
Latest Posts

Property Market Commentary Why More Families Are Choosing Two-Bedders Over Bigger Properties in 2025

Property Market Commentary What The URA Master Plan Reveals About Marina Bay’s Future (And How It Could Impact Property Values)

Landed Home Tours We Toured An ‘Exclusive’ Freehold Landed Enclave In Singapore That Feels Close To Nature – And Even Has A Canal Running Through It

Singapore Property News Where Condo Prices Rose Fastest (and Slowest) in Singapore’s Outside Central Regions

Overseas Property Investing I Left Singapore for New York and Ended Up Launching a $450M Manhattan Project. Here’s What I Learned About Buying Property Here

On The Market 5 Cheapest Freehold 3-Bedroom Condo Units In Singapore You Can Buy This Week – Including Quiet Spot in Floraville

On The Market Rare Detached Freehold Home On Singapore’s ‘Millionaire’s Row’ Up For Sale At $14m

Editor's Pick The 5 Most Common Property Questions Everyone Asks In Singapore – But No One Can Answer

Editor's Pick A 5-Room HDB In Boon Keng Just Sold For A Record $1.5m – Here’s How Much The Owners Could Have Made

Property Market Commentary 6 Upcoming New Condo Launches To Keep On Your Radar For The Rest Of 2025

Editor's Pick We Toured A Little Known Landed Enclave Where The Last Sale Fetched Under $3 Million

Singapore Property News Decoupling Is No Longer a Property Hack: What the Courts and IRAS Have Made Clear

Editor's Pick The New Condos In Singapore With The Most Efficient Layouts In 2025 Revealed – And What To Look Out For

On The Market The Cheapest 4-Bedroom Condos Under $1.7M You Can Buy Today

Homeowner Stories We Could’ve Sold Our Home for More, But We Didn’t — Here’s Why We Let It Go in Just 24 Hours
