Are Older One- and Two-Bedders in District 10 Holding Up Against the New Launches? We Break It Down

Get The Property Insights Serious Buyers Read First: Join 50,000+ readers who rely on our weekly breakdowns of Singapore’s property market.

A seasoned content strategist with over 17 years in the real estate and financial journalism sectors, Ryan has built a reputation for transforming complex industry jargon into accessible knowledge. With a track record of writing and editing for leading financial platforms and publications, Ryan's expertise has been recognised across various media outlets. His role as a former content editor for 99.co and a co-host for CNA 938's Open House programme underscores his commitment to providing valuable insights into the property market.
Because of areas like Tanglin, Holland V, Grange Road, and parts of Bukit Timah, District 10 (D10) has long been associated with generational wealth and prestige. But beneath the reputation for sprawling family homes, it’s the smaller one- and two-bedroom units that present the more interesting case for analysis for most people. These are typically bought by two distinct groups: owner-occupiers such as young couples and affluent singles who want central living without Orchard Road’s density, and investors who see a steady tenant pool of expats.
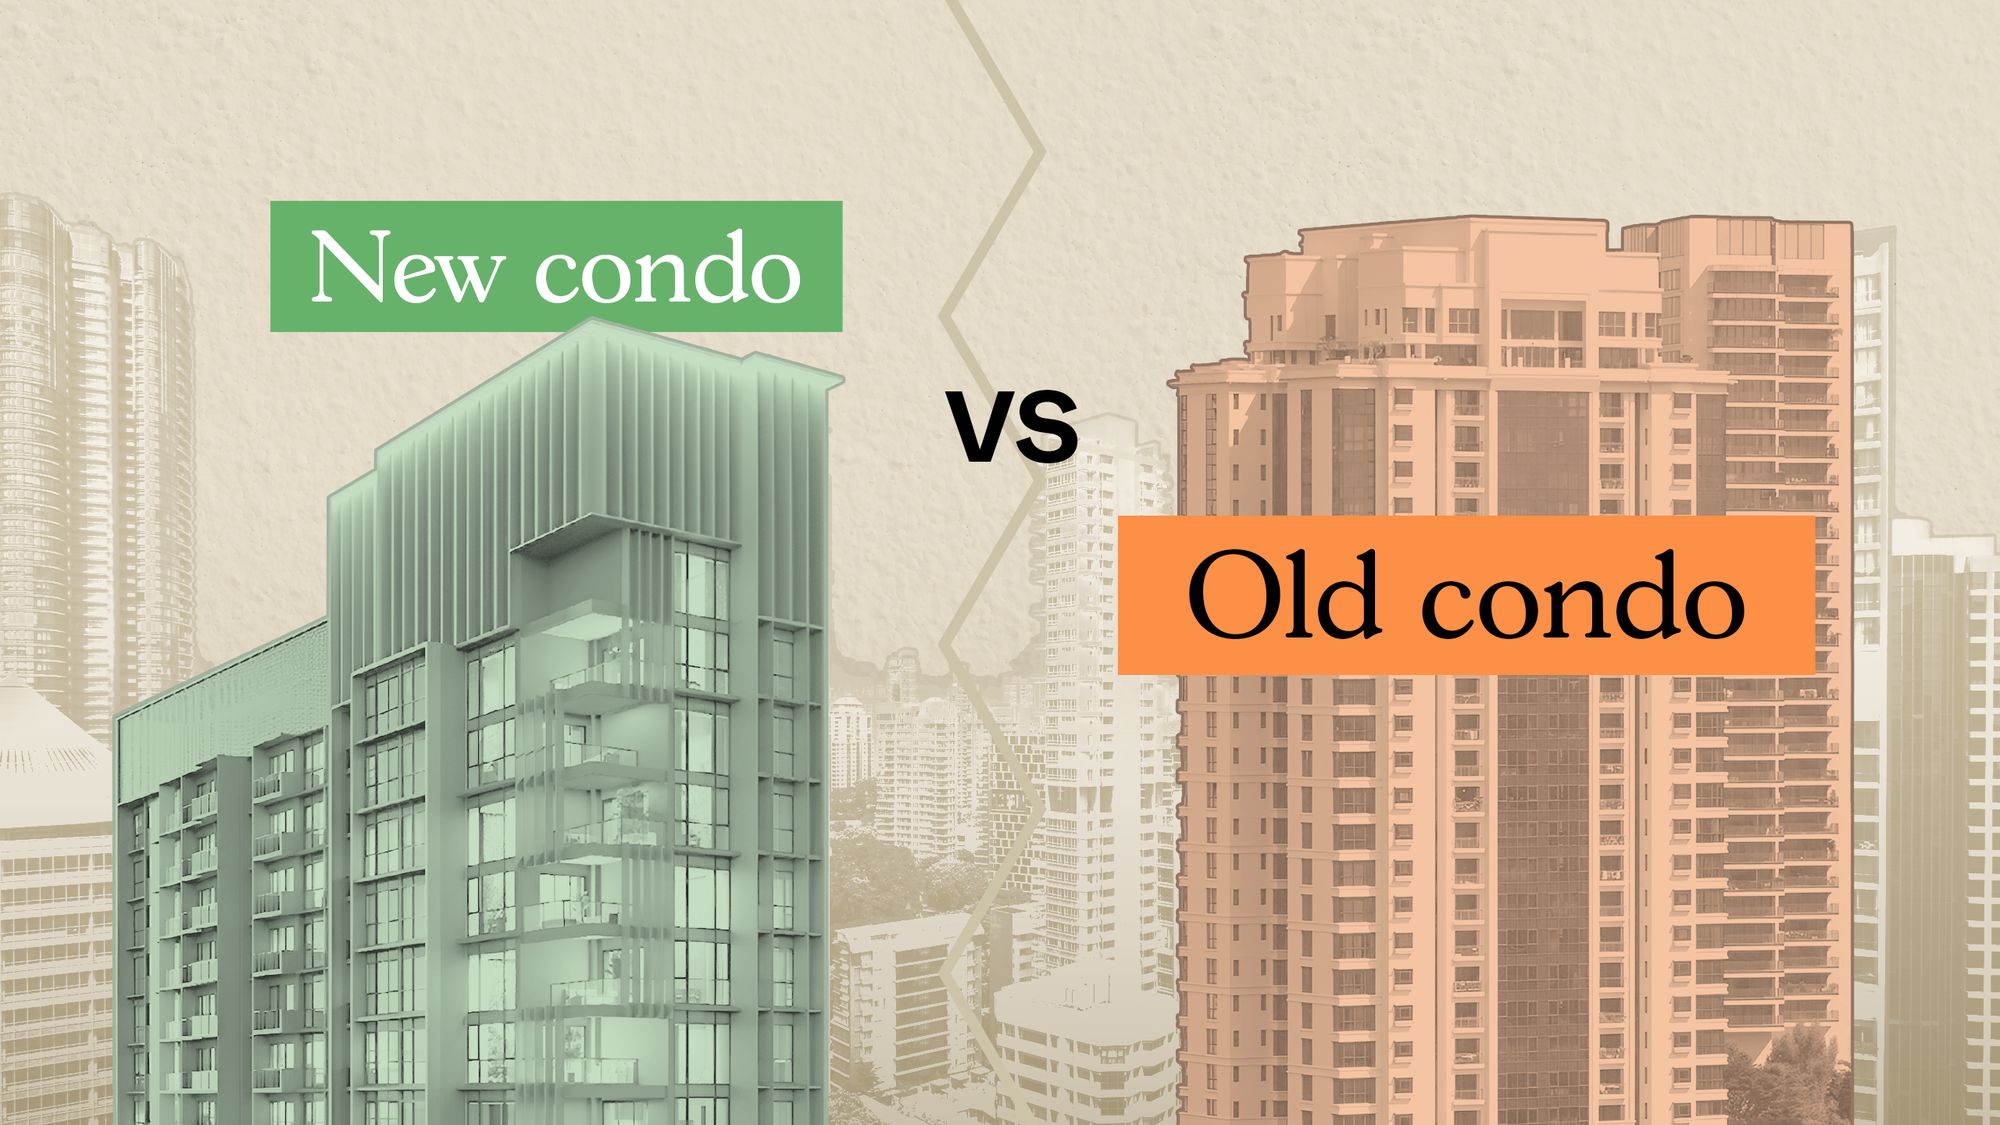
The key question is whether, for these smaller unit types, do newer launches in D10 justify their higher psf, or if older developments (many of which were luxury projects in their day) offer better value once we account for age, lease decay, and rental performance. This article focuses specifically on these smaller units to assess how newer and older condos stack up against each other in today’s market.
Let’s start by looking at the overall performance of condos in D10:
Year | D10 | All non-landed private properties |
2014 | $1,679 | $1,215 |
2015 | $1,735 | $1,197 |
2016 | $1,790 | $1,248 |
2017 | $1,855 | $1,293 |
2018 | $1,896 | $1,323 |
2019 | $1,958 | $1,346 |
2020 | $1,872 | $1,280 |
2021 | $1,989 | $1,354 |
2022 | $2,211 | $1,473 |
2023 | $2,245 | $1,595 |
2024 | $2,347 | $1,681 |
Annualised | 3.41% | 3.30% |

Newer condos have edged out older ones in terms of $PSF increase; but the margin is negligible. This suggests that in D10, location and branding still weigh heavily, even for older projects past the 20-year mark.
But since we want to find out the effect age has on a property, we need to narrow our focus down to 99-year leasehold condos. These are the developments where lease decay becomes a real concern.
So, how have leasehold condos in D10 performed over the past decade?
Year | D10 | All non-landed private properties |
2014 | $1,420 | $1,066 |
2015 | $1,411 | $1,051 |
2016 | $1,485 | $1,140 |
2017 | $1,553 | $1,123 |
2018 | $1,508 | $1,164 |
2019 | $1,527 | $1,189 |
2020 | $1,551 | $1,159 |
2021 | $1,621 | $1,227 |
2022 | $1,752 | $1,370 |
2023 | $1,872 | $1,516 |
2024 | $2,510 | $1,616 |
Annualised | 5.87% | 4.25% |

99-year condos in D10 outperformed the overall market, with annualised gains of 5.87 per cent compared to 4.25 per cent islandwide.
That said, the reason came from a sharp jump between 2023 and 2024, when Cuscaden Reserve entered the resale market. The project’s higher $PSF skewed the average upward, which is why the leasehold segment suddenly showed such a steep rise in the final year.
(In fact, Cuscaden Reserve had such a high $PSF that, at one point, the developer had to relaunch at lower prices.)
Performance would still be solid without Cuscaden Reserve, but it would have been closer to the national benchmark.
For completeness, let’s also take a look at how 999-year and freehold projects in D10 have fared over the same period:
Year | D10 | All non-landed private properties |
2014 | $1,703 | $1,385 |
2015 | $1,782 | $1,366 |
2016 | $1,895 | $1,393 |
2017 | $1,921 | $1,461 |
2018 | $1,975 | $1,524 |
2019 | $2,035 | $1,572 |
2020 | $1,928 | $1,488 |
2021 | $2,078 | $1,586 |
2022 | $2,339 | $1,709 |
2023 | $2,358 | $1,799 |
2024 | $2,281 | $1,855 |
Annualised | 2.96% | 2.97% |

When it comes to 999-year/freehold projects in D10, performance is exactly average. Prices appreciated at an annualised 2.96 per cent, almost identical to the islandwide average of 2.97 per cent.
Lower percentage gains for freehold properties are normal, by the way. Freehold projects command a higher starting price due to the freehold premium; and these higher base prices then translate to lower percentage gains, though absolute gains may be higher.
Let’s now look at how new and old leasehold projects in D10 performed
A quick note on newer versus older
We use 20 years or younger for newer (not new, mind you, but just newer) because most projects in Singapore last 19 to 24 years – so it’s a good middle point. It’s also generally accepted in the market (by convention and no particular authority) that the 20+ age range is when most condos are referred to as “older.”
Year | New | Old | Difference |
2014 | $1,427 | $1,313 | $115 |
2015 | $1,410 | $1,412 | -$2 |
2016 | $1,507 | $1,280 | $227 |
2017 | $1,597 | $1,208 | $389 |
2018 | $1,513 | $1,435 | $79 |
2019 | $1,551 | $1,415 | $136 |
2020 | $1,568 | $1,424 | $144 |
2021 | $1,635 | $1,537 | $98 |
2022 | $1,754 | $1,654 | $99 |
2023 | $1,858 | $1,617 | $241 |
2024 | $1,914 | $1,743 | $171 |
Annualised | 2.98% | 2.88% |

Over the past decade, newer projects have recorded a slightly higher annualised growth rate than older developments, at 2.98 per cent versus 2.88 per cent. The gap isn’t huge, which again suggests that older projects are still holding their ground very well in D10. This may be due to how even the “older” condos here are, ultimately, still high-end luxury homes with strong locations.
That said, $PSF tells only half the story. Older properties tend to have lower $PSF, because they’re often larger in size. So let’s take a look at their actual quantum/actual prices instead:
Year | New | Old | Difference |
2014 | $2,084,914 | $1,950,000 | $134,914 |
2015 | $1,583,118 | $2,109,154 | -$526,036 |
2016 | $2,258,726 | $1,835,167 | $423,560 |
2017 | $2,481,871 | $1,847,615 | $634,255 |
2018 | $2,406,713 | $2,685,486 | -$278,773 |
2019 | $2,343,661 | $1,757,813 | $585,849 |
2020 | $2,083,237 | $2,089,375 | -$6,138 |
2021 | $2,247,031 | $1,908,053 | $338,978 |
2022 | $2,345,902 | $2,172,444 | $173,458 |
2023 | $2,287,002 | $2,493,000 | -$205,998 |
2024 | $2,516,923 | $2,555,952 | -$39,030 |
% increase from 2014 to 2024 | 20.72% | 31.07% |

From 2014 to 2024, the price gap between new and old projects has narrowed significantly. We see that by 2024, older projects cost more on average than newer ones. There were also several years – such as 2015, 2018, and more recently from 2023 onwards – when older projects transacted at higher average prices than their newer counterparts.
So while older units look cheaper on a $PSF basis, their larger sizes push up the absolute quantum. Also, when it comes to the overall average price, the older ones actually outperform new launches in terms of overall appreciation.
More from Stacked
A Review Of New Launch Condos Performance In 2023: Here’s How Major Launches Have Fared So Far
As we approach the mid-year mark in 2023, we thought it would be appropriate to look back and see how…
That said, average prices can be skewed by the mix of units sold in a given year.
To get a clearer picture, let’s break this down further by unit types. There are no old leasehold one-bedroom units built before 1993, so we’ll only look at two-bedders here; our subsequent article will cover the larger three and four-bedders.
2-bedroom units
Average $PSF
Year | New | Old | Difference |
2014 | $1,398 | ||
2015 | $1,405 | $1,548 | -$143 |
2016 | $1,681 | $1,419 | $262 |
2017 | $1,683 | $1,399 | $284 |
2018 | $1,534 | $1,552 | -$18 |
2019 | $1,607 | $1,521 | $86 |
2020 | $1,613 | $1,546 | $67 |
2021 | $1,628 | $1,577 | $51 |
2022 | $1,706 | $1,696 | $10 |
2023 | $1,769 | $1,841 | -$72 |
2024 | $1,879 | $1,858 | $21 |
Annualised | 3.28% | 2.05% |

As there were no old two-bedroom transactions in 2014, we’ll take 2015 as the starting point.
From 2015 to 2024, newer leasehold two-bedders saw a higher annualised growth rate than their older counterparts. In 2015, the $PSF of older two-bedders was actually higher than newer ones; but by 2016, the reverse was true, and the gap has gradually narrowed since.
From 2016 to 2024, the difference in average $PSF between new and old projects has remained modest, with the two segments almost converging by 2024.
While newer two-bedders generally have the upper hand in appreciation, older two-bedders in D10 continue to hold strong; and they show a good ability to defy lease decay by continuing to appreciate.
Now let’s take a look at quantum instead of $PSF:
Average price
Year | New | Old | Difference |
2014 | $1,287,286 | ||
2015 | $1,368,921 | $1,566,667 | -$197,746 |
2016 | $1,623,554 | $1,425,556 | $197,998 |
2017 | $1,751,574 | $1,389,000 | $362,574 |
2018 | $1,478,536 | $1,570,000 | -$91,464 |
2019 | $1,791,612 | $1,539,125 | $252,487 |
2020 | $1,631,033 | $1,551,250 | $79,783 |
2021 | $1,656,115 | $1,582,921 | $73,195 |
2022 | $1,792,760 | $1,690,625 | $102,135 |
2023 | $1,750,114 | $1,832,500 | -$82,386 |
2024 | $1,810,103 | $1,857,000 | -$46,897 |
% increase from 2015 to 2024 | 32.23% | 18.53% |

The price difference between new and old two-bedders has narrowed, with older two-bedders still costing more on average by 2024. That said, there were several years when the average price of new two-bedders exceeded that of older ones. This is unusual to see in most districts, where newer condos tend to pull ahead more decisively; so again, this appears to be a D10 quirk, where older leasehold projects hold their ground much better.
That being said, the average price of new two-bedders has risen by a much higher percentage than older ones: about 32 per cent versus 18.5 per cent.
Could this be due to newer two-bedders being smaller, and thus having a lower quantum that makes percentage gains easier? Let’s take a look:
Average size (based on units transacted)
Year | New | Old |
2014 | 930 | |
2015 | 967 | 1012 |
2016 | 963 | 1005 |
2017 | 1046 | 993 |
2018 | 956 | 1012 |
2019 | 1097 | 1012 |
2020 | 1006 | 1004 |
2021 | 1021 | 1004 |
2022 | 1053 | 997 |
2023 | 990 | 996 |
2024 | 965 | 1001 |

From 2015 to 2024, the average sizes of new and old two-bedders in D10 were actually quite comparable. Newer two-bedders ranged from around 960 to 1,090 sq ft, while older ones averaged about 995 to 1,015 sq ft. In fact, in several years, the newer units were slightly larger than their older counterparts.
This suggests that the faster appreciation of newer two-bedders cannot simply be attributed to size differences.
Instead, it suggests stronger buyer preference for newer projects – possibly due to modern layouts, better facilities, or simply a longer remaining lease. So whilst older leasehold two-bedders in D10 are remarkably resilient, there may still be higher gains when you buy new.
Here’s the total number of transactions we saw:
No. of transactions
Year | New | Old |
2014 | 7 | |
2015 | 14 | 3 |
2016 | 29 | 9 |
2017 | 55 | 7 |
2018 | 28 | 1 |
2019 | 17 | 8 |
2020 | 18 | 8 |
2021 | 51 | 14 |
2022 | 50 | 8 |
2023 | 42 | 4 |
2024 | 29 | 5 |
Next, let’s look at the specific projects where our two-bedders transacted:
New
Project | Average $PSF | Average price | Average size | No. of units sold | Lease start year |
TANGLIN REGENCY | $1,688 | $1,367,500 | 813 | 4 | 1994 |
THE SIENA | $1,758 | $1,400,000 | 797 | 1 | 2013 |
MON JERVOIS | $1,809 | $1,770,000 | 980 | 2 | 2012 |
DUCHESS CREST | $1,792 | $1,810,000 | 1012 | 4 | 1995 |
D’LEEDON | $1,963 | $1,857,063 | 950 | 16 | 2010 |
THE LOFT | $1,921 | $2,130,000 | 1109 | 1 | 1999 |
DRAYCOTT EIGHT | $1,858 | $3,000,000 | 1615 | 1 | 1997 |
Old
Project | Average $PSF | Average price | Average size | No. of units sold | Lease start year |
SPRING GROVE | $1,788 | $1,808,750 | 1012 | 4 | 1991 |
THE MERASAGA | $2,140 | $2,050,000 | 958 | 1 | 1991 |
The price range is rather wide for newer projects: from around $1.37 million at Tanglin Regency to $3 million at Draycott Eight. Notably, three of the newer developments (Tanglin Regency, The Siena, and Mon Jervois) recorded average prices below Spring Grove, which is the more affordable of the two older projects. This is despite Spring Grove’s units being larger on average.
The Merasaga – an older development from 1991 – posted the highest $PSF of the group at $2,140 psf; but this came from a single transaction, so it may not be representative.
Overall, the average prices of older two-bedders sit comfortably within the range of newer projects, which reinforces the point that they’re very resistant to lease decay.
With that in mind, let’s examine how these individual projects have performed over the past 10 years:
Year | TANGLIN REGENCY | THE SIENA | MON JERVOIS | DUCHESS CREST | D’LEEDON | THE LOFT | DRAYCOTT EIGHT | SPRING GROVE | THE MERASAGA |
2014 | $1,379 | $1,393 | $1,667 | ||||||
2015 | $1,298 | $1,250 | $1,712 | $1,779 | $1,548 | ||||
2016 | $1,307 | $1,335 | $1,728 | $1,800 | $1,418 | $1,425 | |||
2017 | $1,301 | $2,041 | $1,345 | $1,645 | $1,437 | $1,713 | $1,387 | $1,430 | |
2018 | $1,406 | $1,442 | $1,621 | $1,790 | $1,889 | $1,552 | |||
2019 | $1,320 | $1,745 | $1,904 | $1,633 | $1,952 | $1,521 | |||
2020 | $1,408 | $1,629 | $1,789 | $1,602 | $1,971 | $1,540 | $1,584 | ||
2021 | $1,412 | $1,648 | $1,529 | $1,659 | $1,834 | $1,786 | $1,565 | $1,650 | |
2022 | $1,578 | $1,805 | $1,840 | $1,689 | $1,714 | $1,957 | $1,683 | $1,737 | |
2023 | $1,655 | $1,741 | $1,904 | $1,729 | $1,758 | $2,036 | $1,822 | $1,900 | |
2024 | $1,688 | $1,758 | $1,809 | $1,792 | $1,963 | $1,921 | $1,858 | $1,788 | $2,140 |
Annualised (2015 to 2024) | 2.96% | 4.08% | 1.54% | 0.48% | 1.61% |
Since there are no transactions in certain years, we can’t calculate proper annual growth rates for the past 10 years. Instead, we’ll look at the 2015 to 2024 window.
From 2015 to 2024, some of the newer two-bedders outperformed their older peers. Tanglin Regency and Duchess Crest posted higher annualised growth rates than the older Spring Grove.
On the other hand, Spring Grove managed to outpace newer projects like D’Leedon and Draycott Eight, showing that not all newer condos automatically guarantee stronger returns.
This reinforces our same point from earlier: newer projects may carry advantages in layout and facilities, but older leasehold condos in D10 can still prove remarkably resilient. Despite their age, they can sometimes outperform their newer counterparts in D10. The project’s location, reputation, and transaction mix are all factors that might weigh more than age.
To get a fuller sense of how these two-bedders compare from an investor’s perspective, let’s also take a look at their rental yields.
Project | Average price in 2024 | Average monthly rent (June 2024 – June 2025) | Rental yield |
THE MERASAGA | $2,050,000 | $5,025 | 2.94% |
DUCHESS CREST | $1,810,000 | $4,567 | 3.03% |
DRAYCOTT EIGHT | $3,000,000 | $7,619 | 3.05% |
SPRING GROVE | $1,808,750 | $4,806 | 3.19% |
D’LEEDON | $1,857,063 | $5,232 | 3.38% |
THE SIENA | $1,400,000 | $4,150 | 3.56% |
TANGLIN REGENCY | $1,367,500 | $4,127 | 3.62% |
THE LOFT | $2,130,000 | $6,450 | 3.63% |
MON JERVOIS | $1,770,000 | $5,423 | 3.68% |
The newer two-bedders are seeing higher rental yields than the older ones. Projects like Mon Jervois (3.68 per cent), The Loft (3.63 per cent), and Tanglin Regency (3.62 per cent) all edge past the older developments, even though they’re leasehold and not insulated from age-related concerns.
Part of the reason lies in price points. Three of the newer projects – Tanglin Regency, The Siena, and Mon Jervois – had lower average prices than Spring Grove, the more affordable of the two older projects. This helped to keep the yield attractive, even if actual monthly rents are not significantly higher.
The takeaway here is that in D10, newer two-bedders can offer not just stronger capital appreciation, but also better rental yields compared to their older peers. For investors, this makes them compelling options – and it’s an inversion of the common saying that landlords chasing yields should aim for cheaper, older projects.
Conclusion:
Overall, the numbers show that older leasehold two-bedders in D10 are remarkably resilient.
They continue to see strong absolute prices, often outpricing newer units despite being past the 20-year mark. At the same time, newer two-bedders have delivered stronger capital appreciation over the past decade.
Unusually for Singapore, newer two-bedders here can also deliver higher rental yields. This inversion of the usual pattern suggests that in D10, investors can’t simply assume “older = cheaper = better yield.” This is likely because they’re dealing with a different demographic of tenants, who can be more particular about newer facilities or layouts.
If you add the relative affordability of some newer projects, two-bedders in D10 tip in favour of newer projects.
In part two of this series, we’ll move on to examine three- and four-bedders in D10, to see if the same dynamics hold true for larger family-sized units.
If you’d like to get in touch for a more in-depth consultation, you can do so here.
Ryan J
A seasoned content strategist with over 17 years in the real estate and financial journalism sectors, Ryan has built a reputation for transforming complex industry jargon into accessible knowledge. With a track record of writing and editing for leading financial platforms and publications, Ryan's expertise has been recognised across various media outlets. His role as a former content editor for 99.co and a co-host for CNA 938's Open House programme underscores his commitment to providing valuable insights into the property market.Read next from Property Investment Insights

Property Investment Insights Old vs New Family-Sized Condos in District 9: A Data-Driven Analysis of Value in 2025

Property Investment Insights Are Older One- and Two-Bedders in District 9 Holding Up Against the New Launches? We Break It Down

Property Investment Insights Old vs New Condos In District 15: Which Offers Better Value In 2025?

Property Advice Condo Vs HDB Price Gap Analysis: Singapore Estates Where Resale HDBs Present A Clearer Value Case Than Condos
Latest Posts

Property Market Commentary Are Singapore’s Oldest HDB Flats Finally Losing Value? A 2025 Price Update

Singapore Property News The World’s Real Estate Is Now Worth US$393 Trillion In 2025. Here’s Where Singapore Fits In

Property Trends The Room That Changed the Most in Singapore Homes: What Happened to Our Kitchens?

Landed Home Tours We Toured A Unique Landed Street Where No One Has Sold a Property for 14 Years

Singapore Property News Why Old ECs Now Make More Sense Than Million-Dollar Flats

New Launch Condo Reviews Skye At Holland Condo Review: Attractive Entry Price To Holland Village From $2,598 PSF

On The Market A Rare 1930s Art Deco Home In Alexandra With 33,000 Sq Ft of Land Is Up For Rent

On The Market The Cheapest 4-Room HDB Flats Still Available Right Now – From $410,000

Property Market Commentary 5 Ways Singapore’s Condo Layouts Have Changed Over The Years (And What We No Longer Value)

Editor's Pick Why These “Ulu” Estates May Be The Next Property Investment Hotspots In Singapore (By 2035)

On The Market 5 Biggest Condos In Singapore You Can Buy Right Now For Less Than $1.8M

Property Advice 5 Telltale Signs to Watch Before Property Prices Move In Singapore

Editor's Pick Queenstown’s First New Launch In 7 Years Comes With Full Facilities — Even With Just 462 Units

Editor's Pick I Toured A Freehold Landed Estate by a Flyover Where Homes Still Sell for $6M+

Singapore Property News The Harsh Math Of HDB Ownership After SERS
