


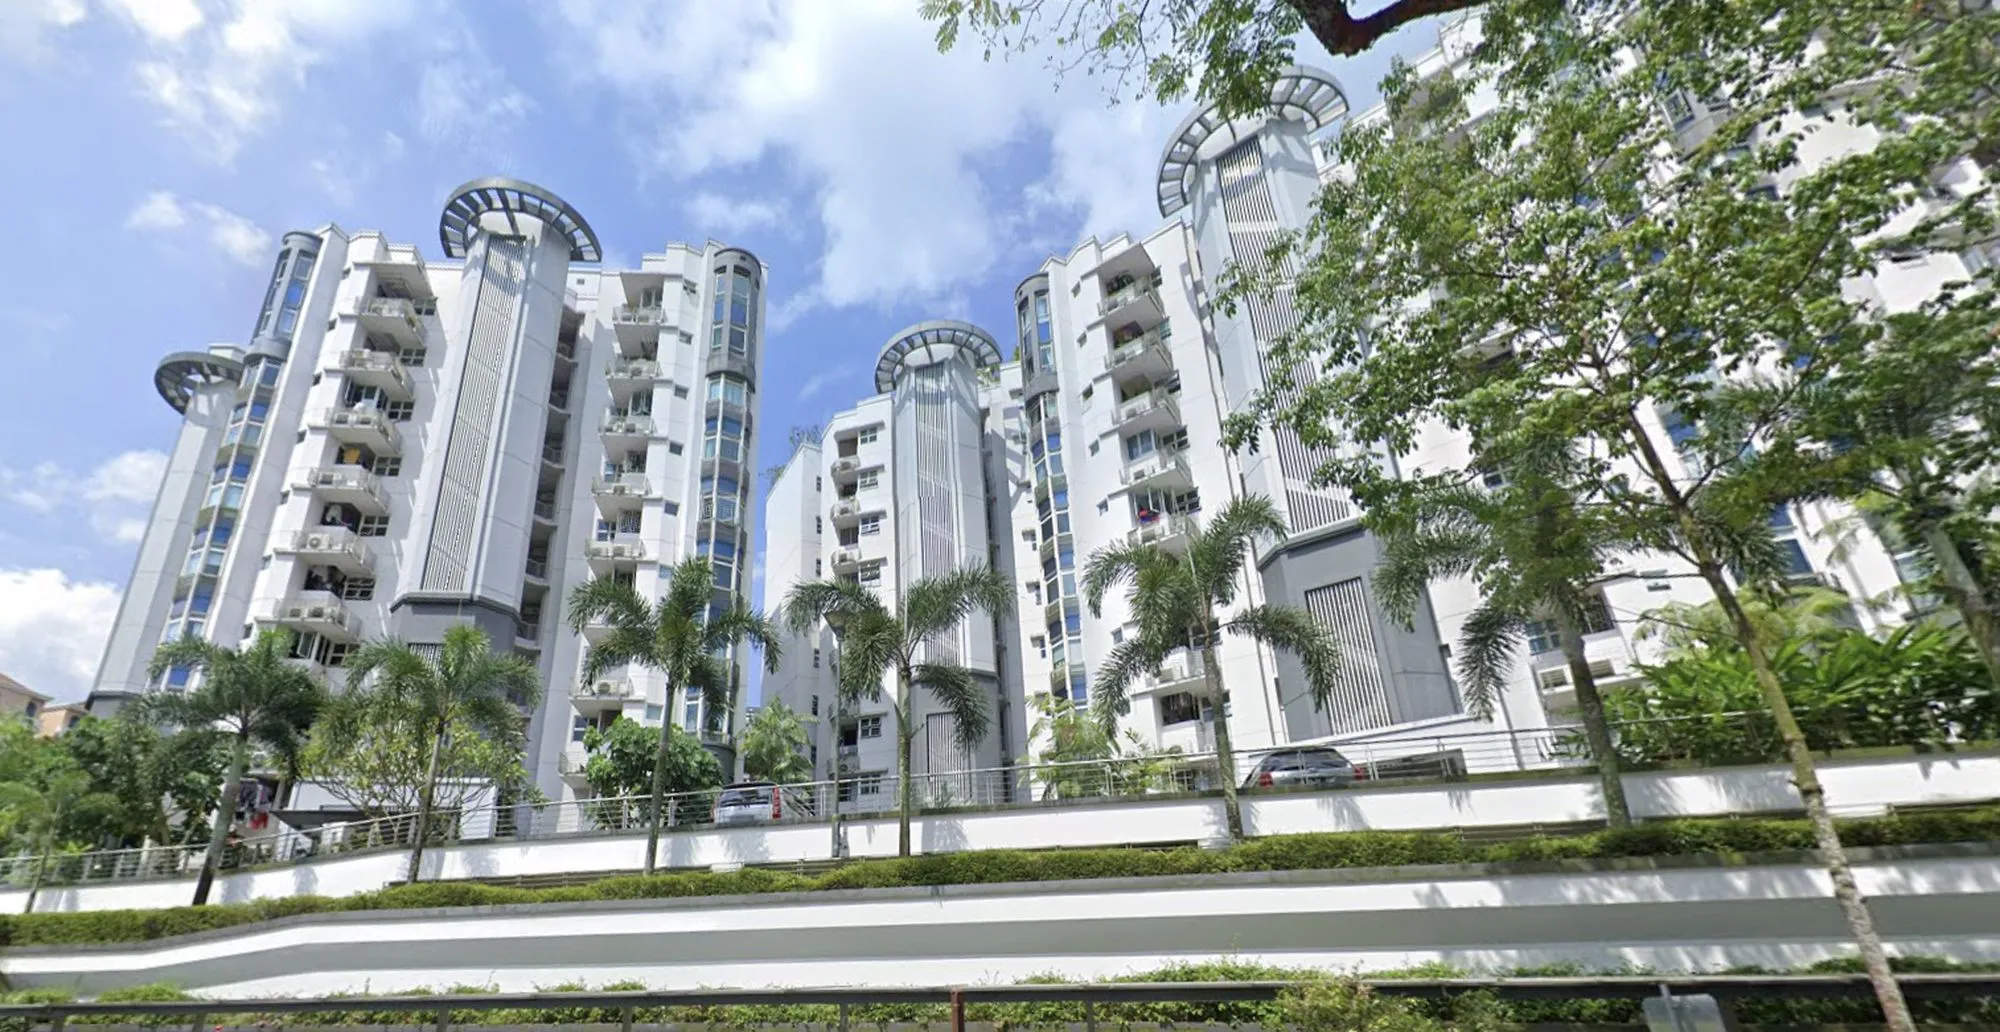


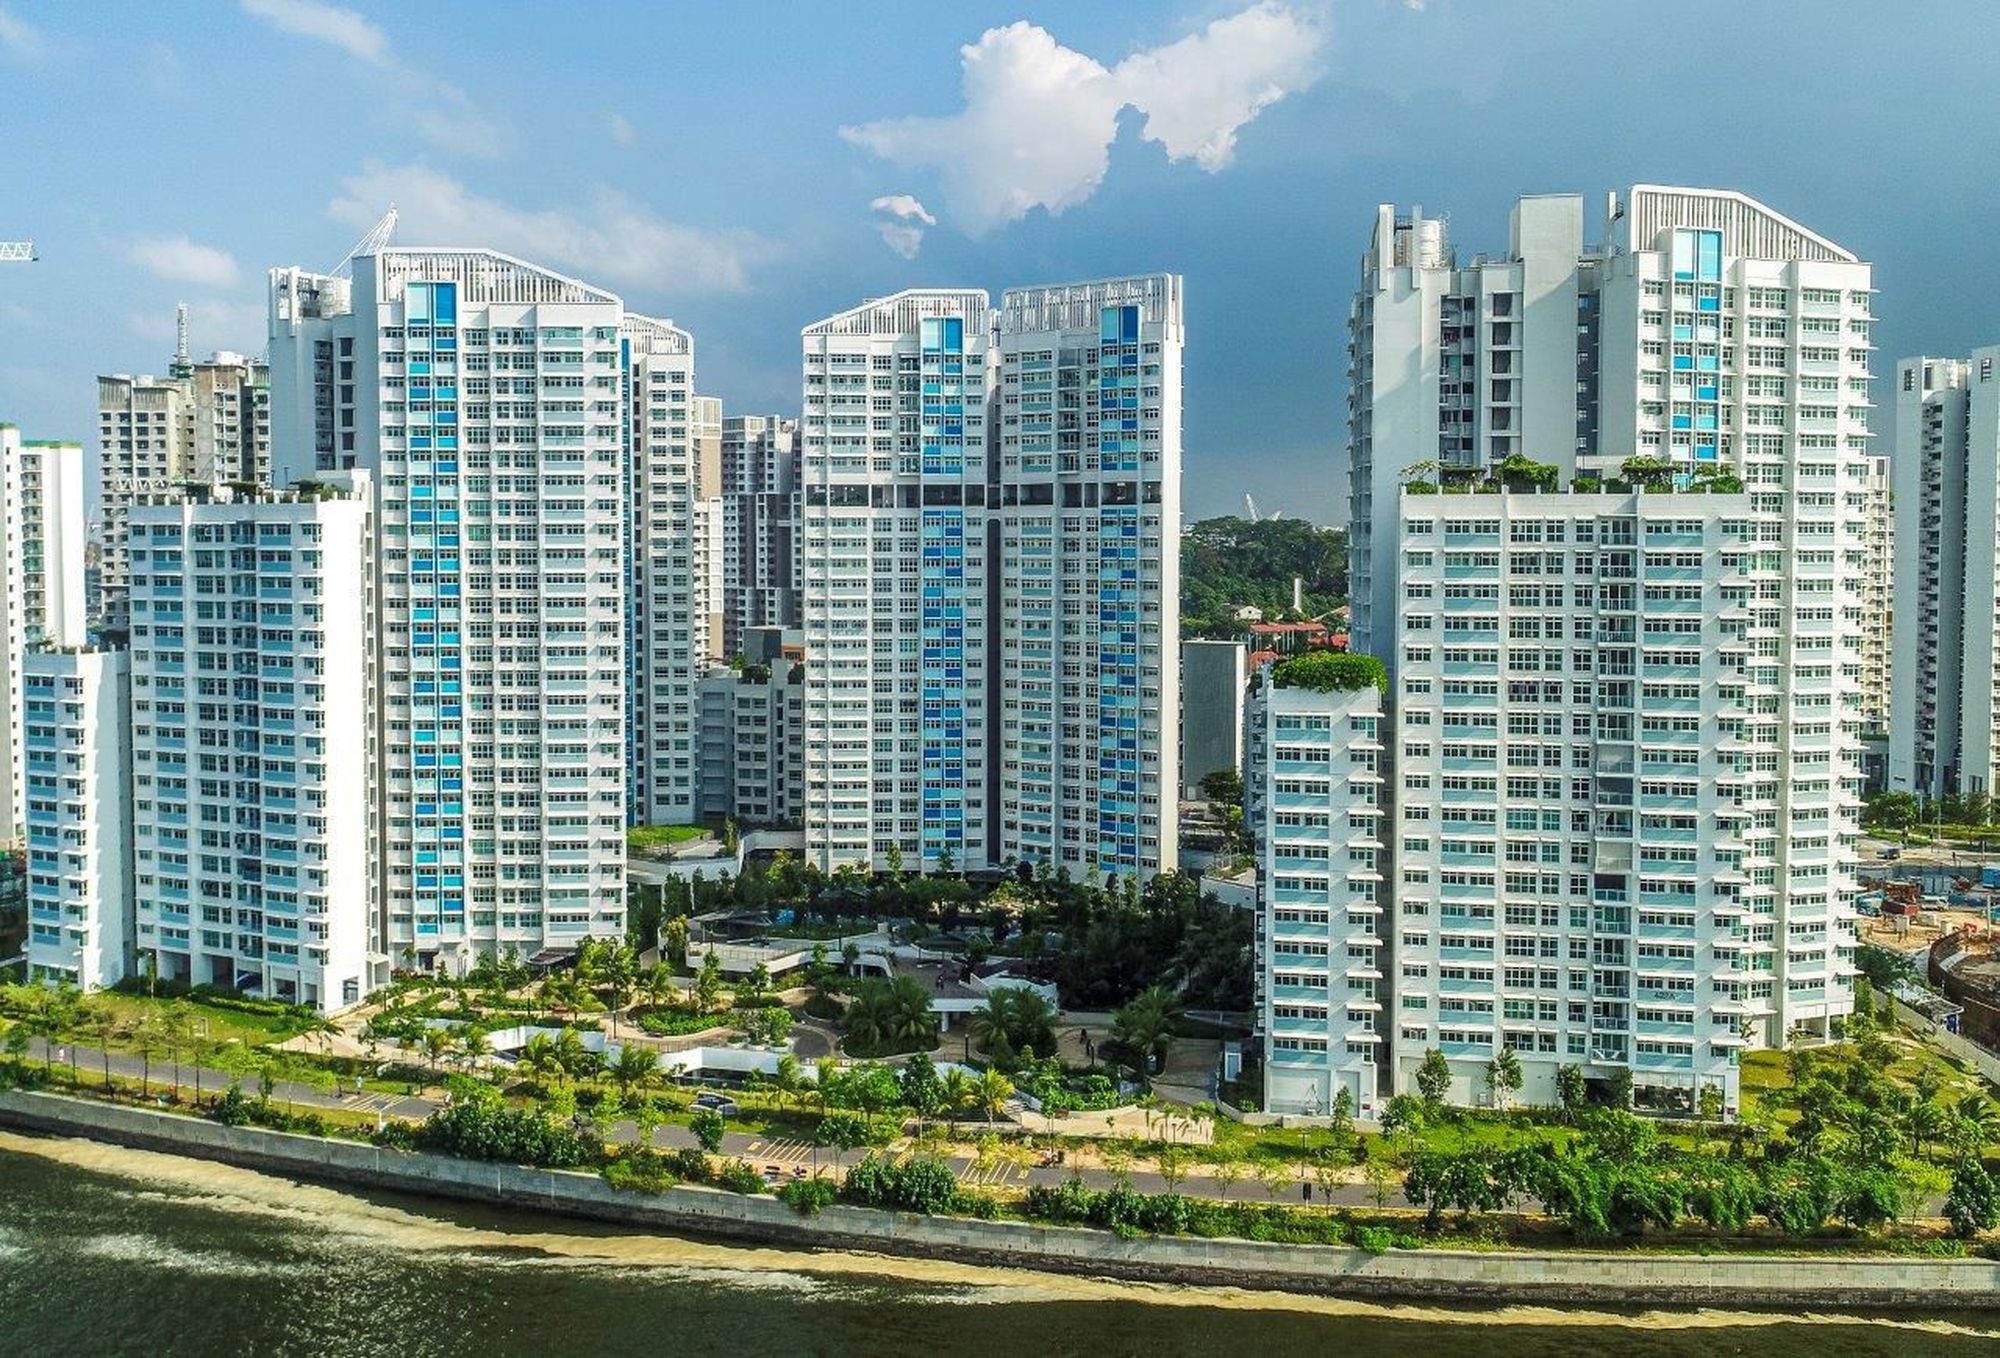


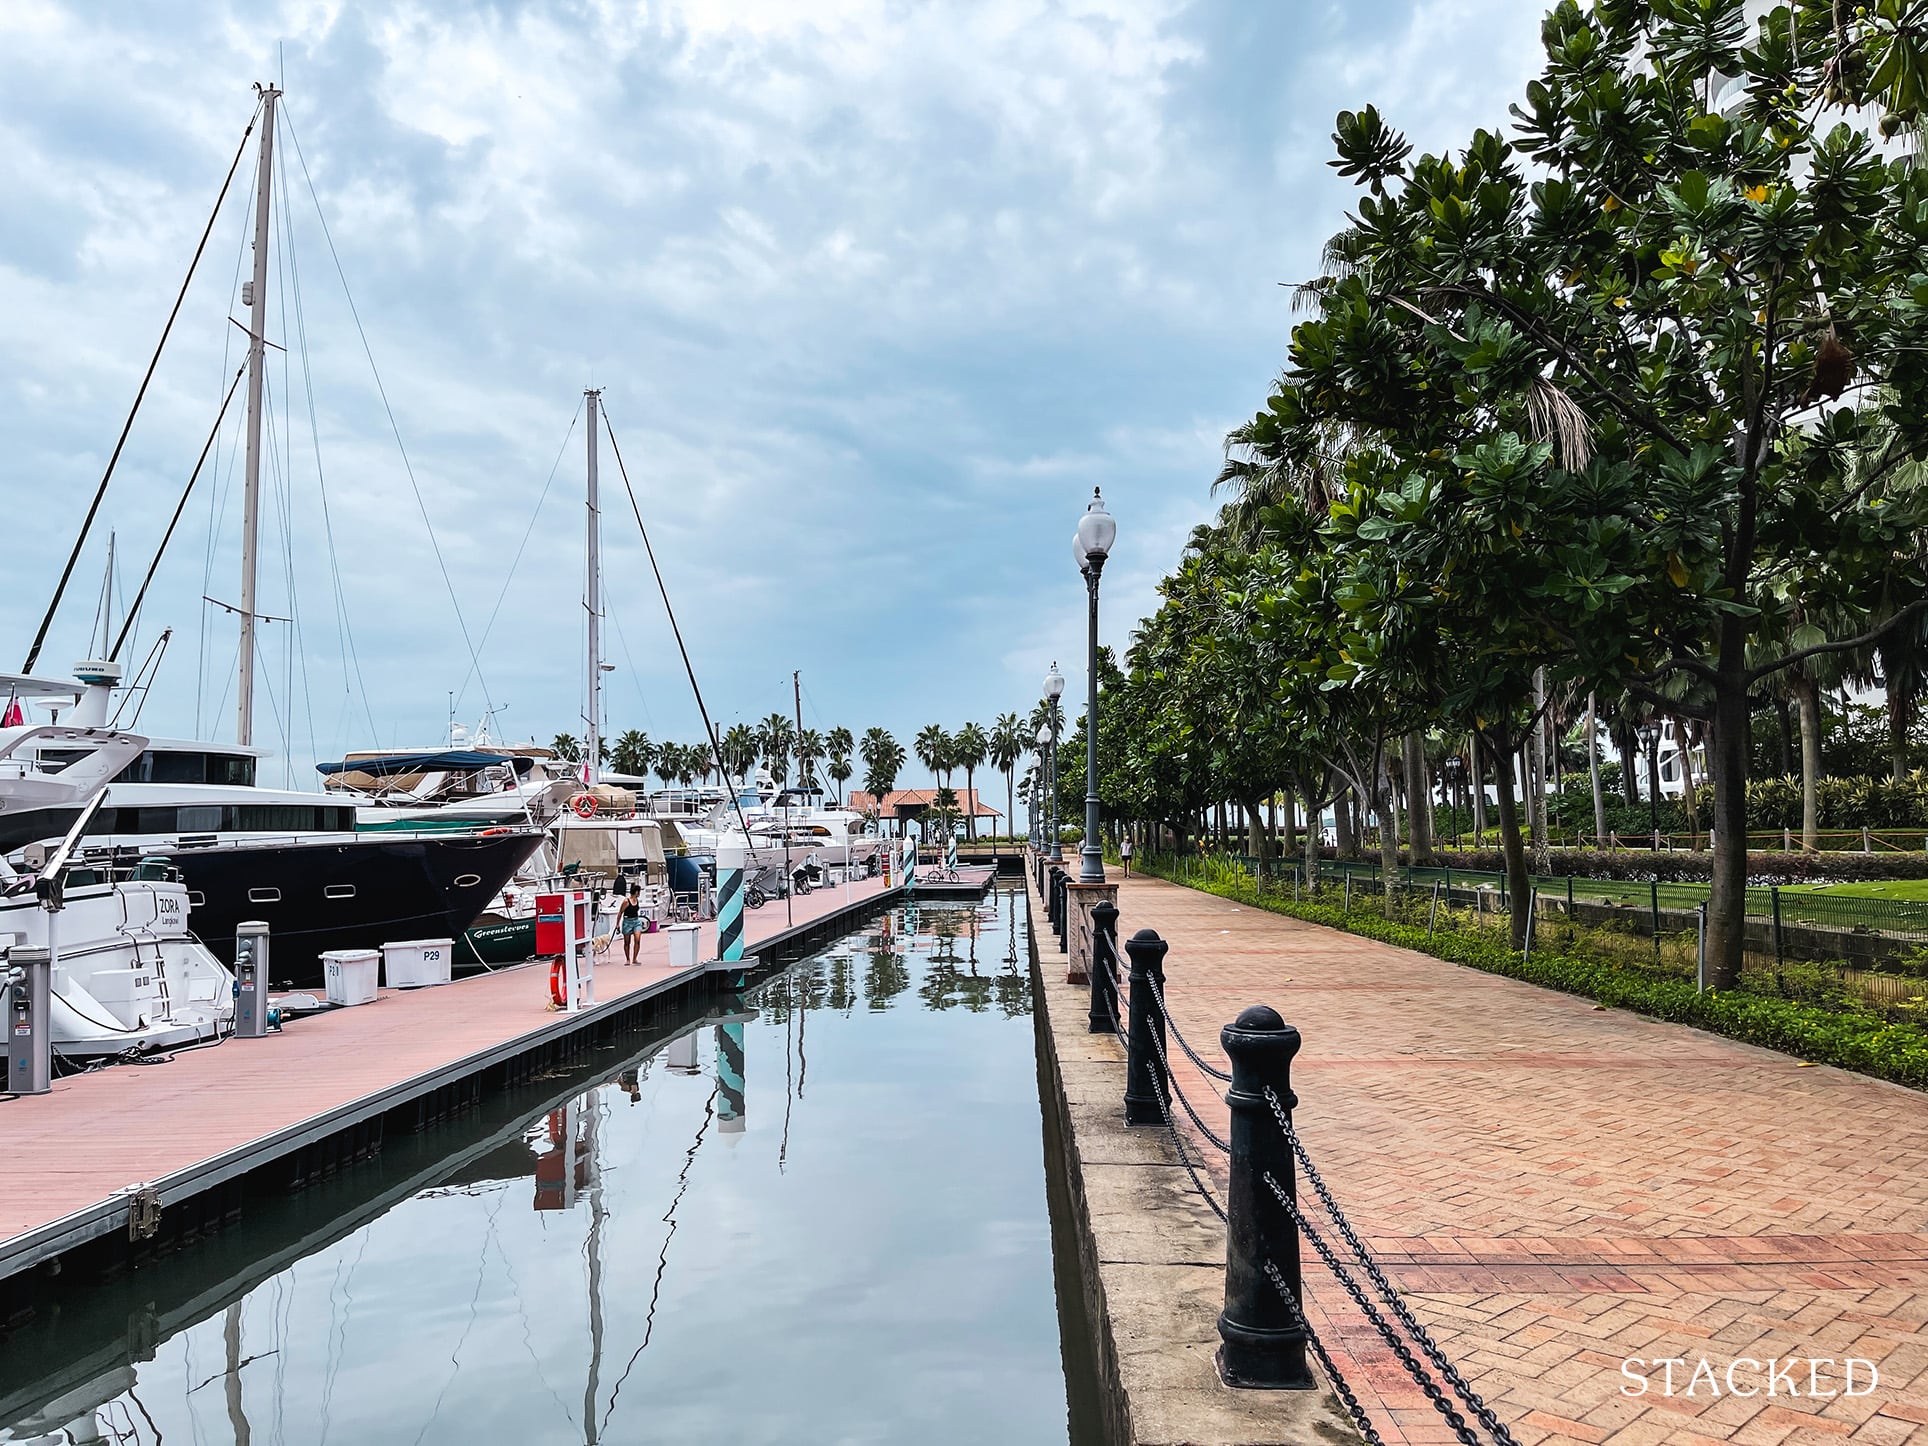
With prices at the recent The Residences at W slashed by over 40 per cent, there has been much talk and excitement about Sentosa properties again.
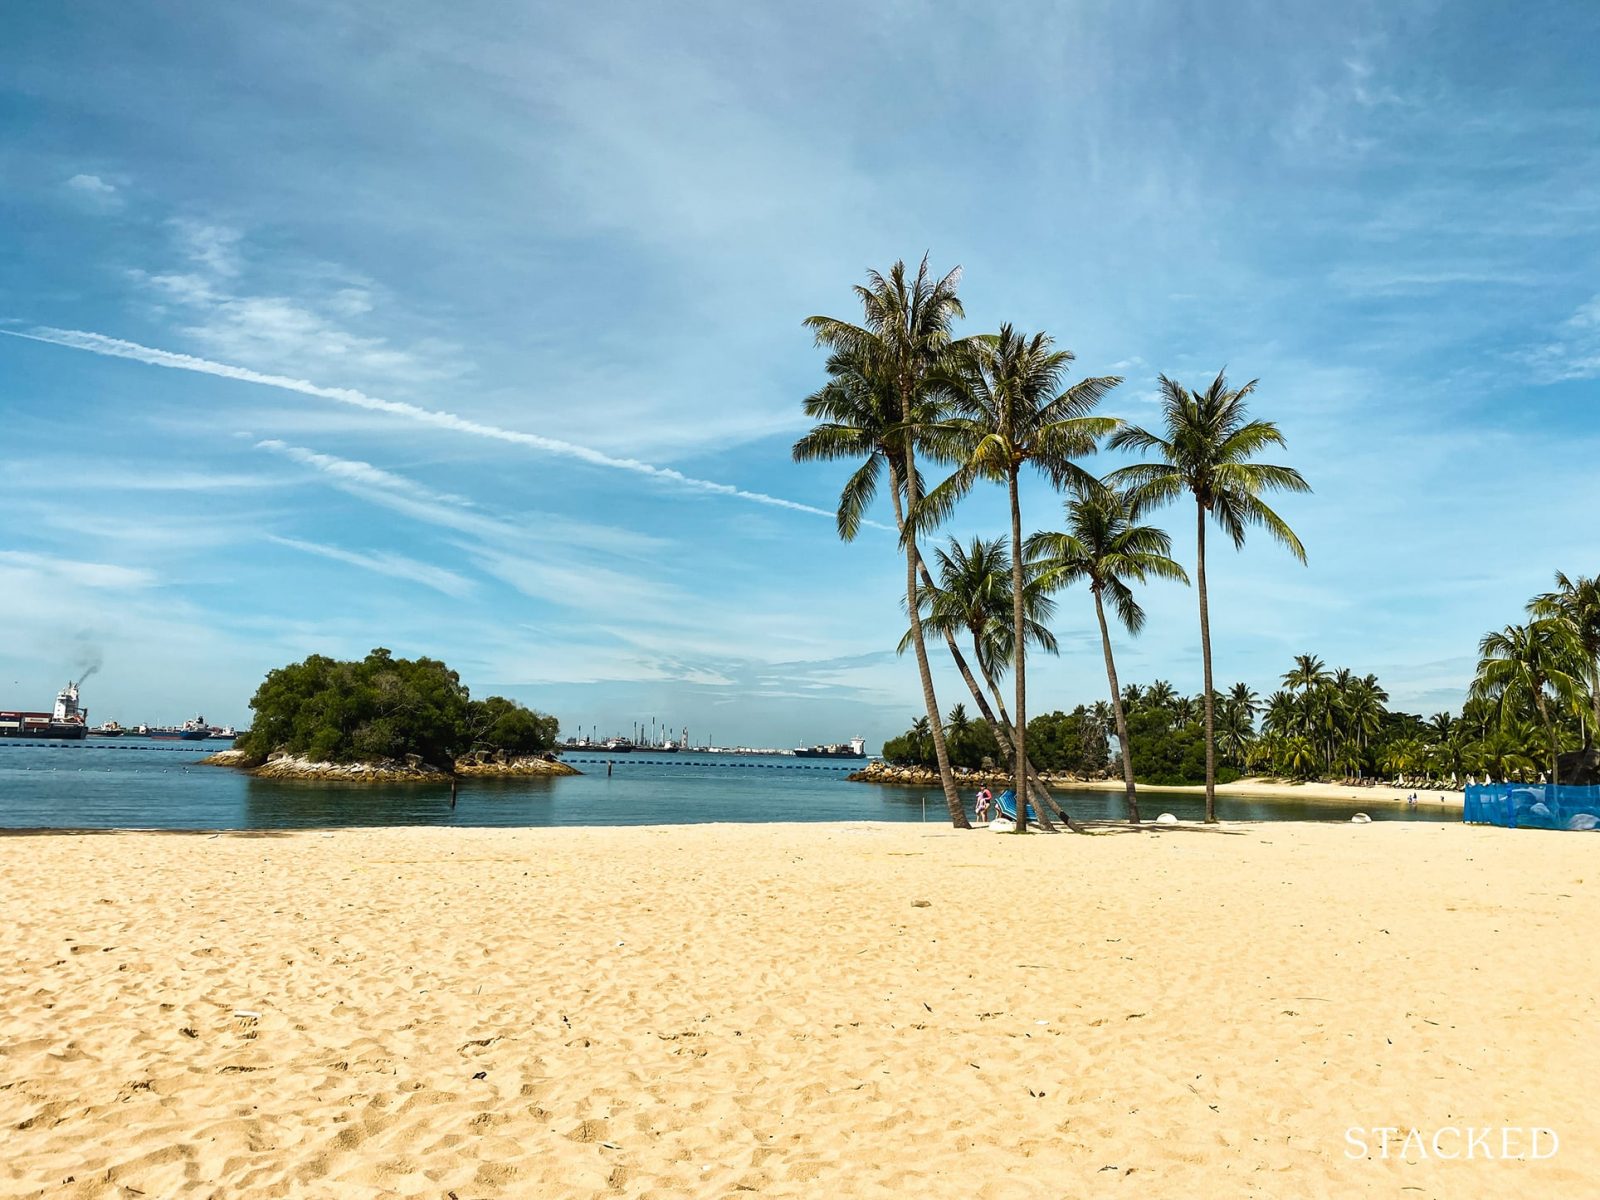
But frankly for anyone looking at buying in Sentosa, they fill a very clear niche: they are luxury lifestyle homes for owners to indulge in, first and foremost. Investment purposes are mostly secondary. If you just want to make money, there are condos elsewhere with better yields, resale track records, and lower cash outlays.
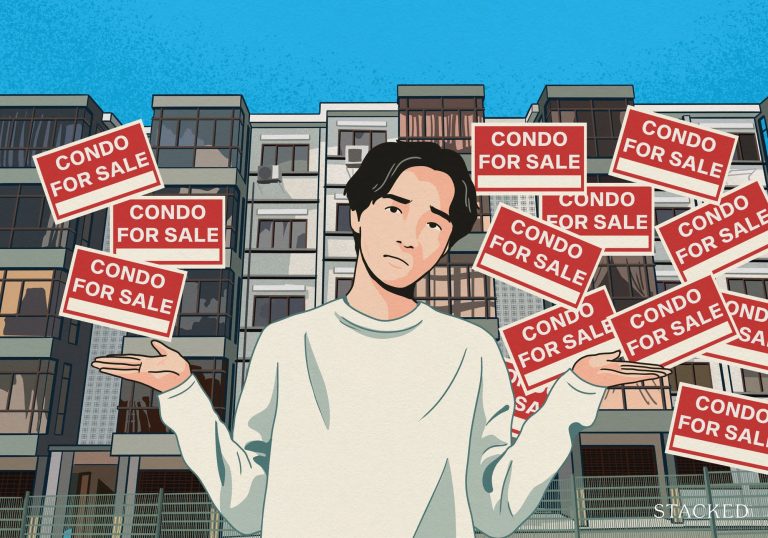
So we figured given the poor performance of Sentosa properties, it would be interesting to look at the rare ones that have been profitable and what we can learn. Here’s an overview:
The challenge for many buyers today isn't access to information.
It's interpreting that information in a way that makes sense for their finances, goals, and stage of life.
Over time, that's also why we decided to work with agents who shared the same data-driven and advisory-led approach behind our editorial, consultants who could help readers think through decisions more objectively, rather than simply push transactions.
Today, the team has worked with more than 2,000 clients across over $5B in property transactions.
Top overall performers
| Project | No of Buy/Sell Transactions | Average Gains | Average Returns | Average annualised returns | Average holding period (years) |
| THE BERTH BY THE COVE | 202 | $605,634 | 39.8% | 24.1% | 5.5 |
| THE AZURE | 118 | $676,736 | 36.3% | 25.7% | 4.3 |
| THE OCEANFRONT @ SENTOSA COVE | 276 | $389,943 | 15.0% | 20.6% | 5.4 |
| THE COAST AT SENTOSA COVE | 171 | $235,938 | 7.1% | 13.6% | 6.5 |
The Berth by the Cove is one of the more recognisable names at Sentosa Cove. Besides having an advantage from strong sub sales (see below), the Berth had a first-mover advantage: this was the first condo at Sentosa Cove. Plus, at the time of its launch, it had the novelty of being one of the first residential projects to offer berthing for yachts.
The Azure is the only one that’s come out ahead of The Berth, and this was the second condo right after it. It also saw strong sub sales, as we cover below. But in fairness, The Azure is one of the cove’s most iconic projects. The developer capitalised on the unique land parcel which was on the absolute easternmost tip of Sentosa: the shoreline forms the perimeter of this condo. Because of this, the Azure is said to have the best beach view in Singapore (270-degree panoramic view), with exceptionally large patios and balcony spaces that open up to it.
As some of these condos were built before 2010, there’s a possibility the highest profits were in sub sales.
Sellers Stamp Duty (SSD) was introduced only in 2010, so there was no penalty for “flipping” a Sentosa Cove condo in the years before that. Some of the better profits at Sentosa Cove can be attributed to these sub sales:
| Projects | No of Buy/Sell Transactions | Average Returns ($) | Average Returns (%) | Average annualised returns (%) | Average holding period |
| CORAL ISLAND | 4 | $4,100,000 | 64.8% | 22.2% | 2.8 |
| KASARA | 2 | $2,372,000 | 16.4% | 24.2% | 0.7 |
| OCEAN 8 | 1 | $1,800,000 | 62.5% | 83.5% | 0.8 |
| PARADISE ISLAND | 6 | $2,934,358 | 30.4% | 44.9% | 1.7 |
| SANDY ISLAND | 1 | $1,220,000 | 9.9% | 4.8% | 2.0 |
| THE AZURE | 35 | $896,733 | 46.0% | 44.8% | 1.7 |
| THE BERTH BY THE COVE | 55 | $675,837 | 44.9% | 33.9% | 1.7 |
| THE BERTHSIDE | 3 | $1,549,257 | 67.5% | 34.8% | 1.5 |
| THE COAST AT SENTOSA COVE | 45 | $574,532 | 14.1% | 33.8% | 1.6 |
| THE OCEANFRONT @ SENTOSA COVE | 100 | $884,085 | 30.6% | 36.6% | 1.8 |
| THE VILLAS @ SENTOSA COVE | 2 | $2,380,000 | 92.3% | 56.0% | 1.3 |
| TURQUOISE | 1 | -$594,770 | -9.0% | -3.2% | 2.9 |
We’re not sure if it’s fair to include Ocean 8, as it’s actually a leasehold landed project. But one of the reasons it had such a high sub sale gain is its scarcity: there are only eight available houses. So if someone with the purchasing power really wanted one, it explains the 83.5 per cent gain.
Perhaps the most unusual transaction here is Turquoise, as it is rare to accept a loss on a sub sale. This may have been a seller facing a drastic change in financial situation, issues over bank financing, etc.
The Oceanfront @ Sentosa Cove is a good reflection of why the SSD happened. This project was completed in 2010, just before the period when SSD was implemented; and notice how high the number of sub sales was (100 transactions). House-flipping really was a major issue at the time.
From the above, sub sale transactions account for about a third of the profits for the following condos:
| Projects | New to sub sale | Total | % New to sub sale |
| THE AZURE | 35 | 118 | 30% |
| THE BERTH BY THE COVE | 55 | 202 | 27% |
| THE COAST AT SENTOSA COVE | 45 | 171 | 26% |
| THE OCEANFRONT @ SENTOSA COVE | 100 | 276 | 36% |
| TURQUOISE | 1 | 28 | 4 |
For these condos, we have to attribute at least part of their good performance to sub sales and the lack of SSD at the time. This isn’t a repeatable phenomenon for them.
Now let’s eliminate sub sales, and look at the new-to-resale market:
| Projects | No of Buy/Sell Transactions | Average Returns ($) | Average Returns (%) | Average Annualised Returns (%) | Average Holding Period | First sale date |
| THE BERTH BY THE COVE | 63 | $1,095,940 | 71.0% | 11.5% | 8.2 | 25/11/04 |
| THE AZURE | 22 | $1,641,087 | 81.7% | 10.4% | 7.3 | 9/9/05 |
| THE OCEANFRONT @ SENTOSA COVE | 42 | $635,780 | 23.2% | 2.2% | 11.9 | 13/7/06 |
| THE COAST AT SENTOSA COVE | 63 | $272,887 | 7.5% | 1.9% | 9.8 | 7/10/06 |
| TURQUOISE | 21 | -$2,834,535 | -43.8% | -5.7% | 10.7 | 24/10/07 |
| MARINA COLLECTION | 12 | -$2,008,322 | -29.3% | -2.9% | 12.2 | 8/12/07 |
| SEVEN PALMS SENTOSA COVE | 1 | -$7,120,000 | -44.5% | -6.3% | 9.0 | 8/9/09 |
| THE RESIDENCES AT W SINGAPORE SENTOSA COVE | 1 | -$1,460,800 | -39.9% | -3.7% | 13.4 | 7/4/10 |
| SEASCAPE | 14 | -$2,671,679 | -33.8% | -4.6% | 9.7 | 26/3/10 |
There are stellar performers: The Oceanfront @ Sentosa Cove joins The Berth and The Azure. Many of the reasons were already discussed above. However, if we look at the dates of initial purchase, we can see they were all bought between 2004 to 2006. Condos purchased after this point are the ones that tend to lose money.
As such, you can see that the main winners of Sentosa were those who took the plunge and bought early. Most of the rest who bought in 2007 (which coincided with a property high), were those who lost big.
Speculatively, this may be due to the nature of the luxury market. When you have luxury projects very close to each other (and Sentosa Cove has nothing but luxury), developers have to differentiate their products somehow. This may result in increasingly pricey finishings, more upscale facilities, etc. to outdo the neighbouring condos.
Couple this with how new launches are always priced higher than existing resale counterparts, and a buyer demographic that doesn’t have to care too much about returns: what you end up with are very pricey homes, which are increasingly intended as indulgences and not investments.
But given the relative age of some of these condos now, besides the allure of the waterfront lifestyle, they may just be losing out in terms of the hard product to newer luxurious projects on the mainland.
Finally, if you do want to consider investment returns, here’s a look at how big and small the losses/gains have been:
Most Profitable
| Project Name | Transacted Price ($) | Area (SQFT) | Unit Price ($ PSF) | Sale Date | Returns ($) | Returns (%) | Type of Sale | Holding Period (Years) | Annualised Returns (%) |
| THE BERTH BY THE COVE | $997,040 | 1367 | $729 | 12/28/2004 | $1,502,960 | 151% | New Sale to Resale | 5.4 | 18.6% |
| THE BERTH BY THE COVE | $2,208,800 | 3089 | $715 | 12/27/2004 | $3,320,510 | 150% | New Sale to Resale | 2.7 | 40.5% |
| THE AZURE | $1,691,000 | 1927 | $878 | 10/19/2005 | $2,509,000 | 148% | New Sale to Resale | 5.8 | 17.0% |
| THE AZURE | $1,697,850 | 1744 | $974 | 10/26/2005 | $2,487,750 | 147% | New Sale to Sub Sale | 1.8 | 65.1% |
| THE AZURE | $1,632,000 | 1744 | $936 | 10/24/2005 | $2,268,000 | 139% | New Sale to Resale | 5.2 | 18.2% |
| THE BERTH BY THE COVE | $1,382,400 | 1658 | $834 | 5/9/2005 | $1,809,250 | 131% | New Sale to Resale | 2.6 | 38.0% |
| THE BERTH BY THE COVE | $1,838,700 | 1905 | $965 | 2/1/2005 | $2,352,300 | 128% | New Sale to Resale | 2.8 | 34.2% |
| THE AZURE | $1,687,950 | 1711 | $986 | 10/18/2005 | $2,158,378 | 128% | New Sale to Sub Sale | 1.7 | 62.3% |
| THE AZURE | $2,395,050 | 2271 | $1,055 | 11/4/2005 | $3,055,350 | 128% | New Sale to Sub Sale | 2.4 | 40.9% |
| THE BERTH BY THE COVE | $2,240,100 | 3089 | $725 | 12/10/2004 | $2,679,900 | 120% | New Sale to Resale | 2.8 | 32.4% |
Least Profitable
| Project Name | Transacted Price ($) | Area (SQFT) | Unit Price ($ PSF) | Sale Date | Returns ($) | Returns (%) | Type of Sale | Holding Period (Years) | Annualised Returns (%) |
| TURQUOISE | $9,532,280 | 3746 | $2,545 | 11/7/2007 | -$5,132,280 | -54% | Sub Sale to Resale | 10.8 | -6.9% |
| THE COAST AT SENTOSA COVE | $11,469,600 | 4779 | $2,400 | 8/16/2007 | -$6,169,600 | -54% | Sub Sale to Resale | 13.2 | -5.7% |
| TURQUOISE | $6,038,490 | 2185 | $2,763 | 10/29/2007 | -$3,138,490 | -52% | New Sale to Resale | 7.7 | -9.1% |
| SEASCAPE | $12,800,000 | 4069 | $3,146 | 6/28/2010 | -$6,600,000 | -52% | New Sale to Resale | 6.6 | -10.4% |
| SEASCAPE | $6,265,000 | 2336 | $2,682 | 3/26/2010 | -$3,165,000 | -51% | New Sale to Resale | 9.2 | -7.4% |
| THE AZURE | $7,200,000 | 3165 | $2,275 | 10/29/2007 | -$3,600,000 | -50% | Sub Sale to Resale | 13.4 | -5.0% |
| MARINA COLLECTION | $9,295,000 | 3272 | $2,841 | 3/27/2008 | -$4,645,000 | -50% | New Sale to Resale | 15 | -4.5% |
| TURQUOISE | $9,132,075 | 3735 | $2,445 | 11/6/2007 | -$4,429,575 | -49% | New Sale to Resale | 13.5 | -4.8% |
| TURQUOISE | $5,426,960 | 2088 | $2,599 | 11/2/2007 | -$2,626,960 | -48% | New Sale to Resale | 12.3 | -5.2% |
| SEASCAPE | $11,000,000 | 4133 | $2,661 | 12/21/2011 | -$5,200,000 | -47% | Resale to Resale | 3.4 | -17.2% |
The recent ABSD measures, hiking up rates to 60 per cent for foreigners, unfortunately, bodes ill for Sentosa Cove.
At Stacked, we like to look beyond the headlines and surface-level numbers, and focus on how things play out in the real world.
If you’d like to discuss how this applies to your own circumstances, you can reach out for a one-to-one consultation here.
And if you simply have a question or want to share a thought, feel free to write to us at stories@stackedhomes.com — we read every message.
0 Comments