

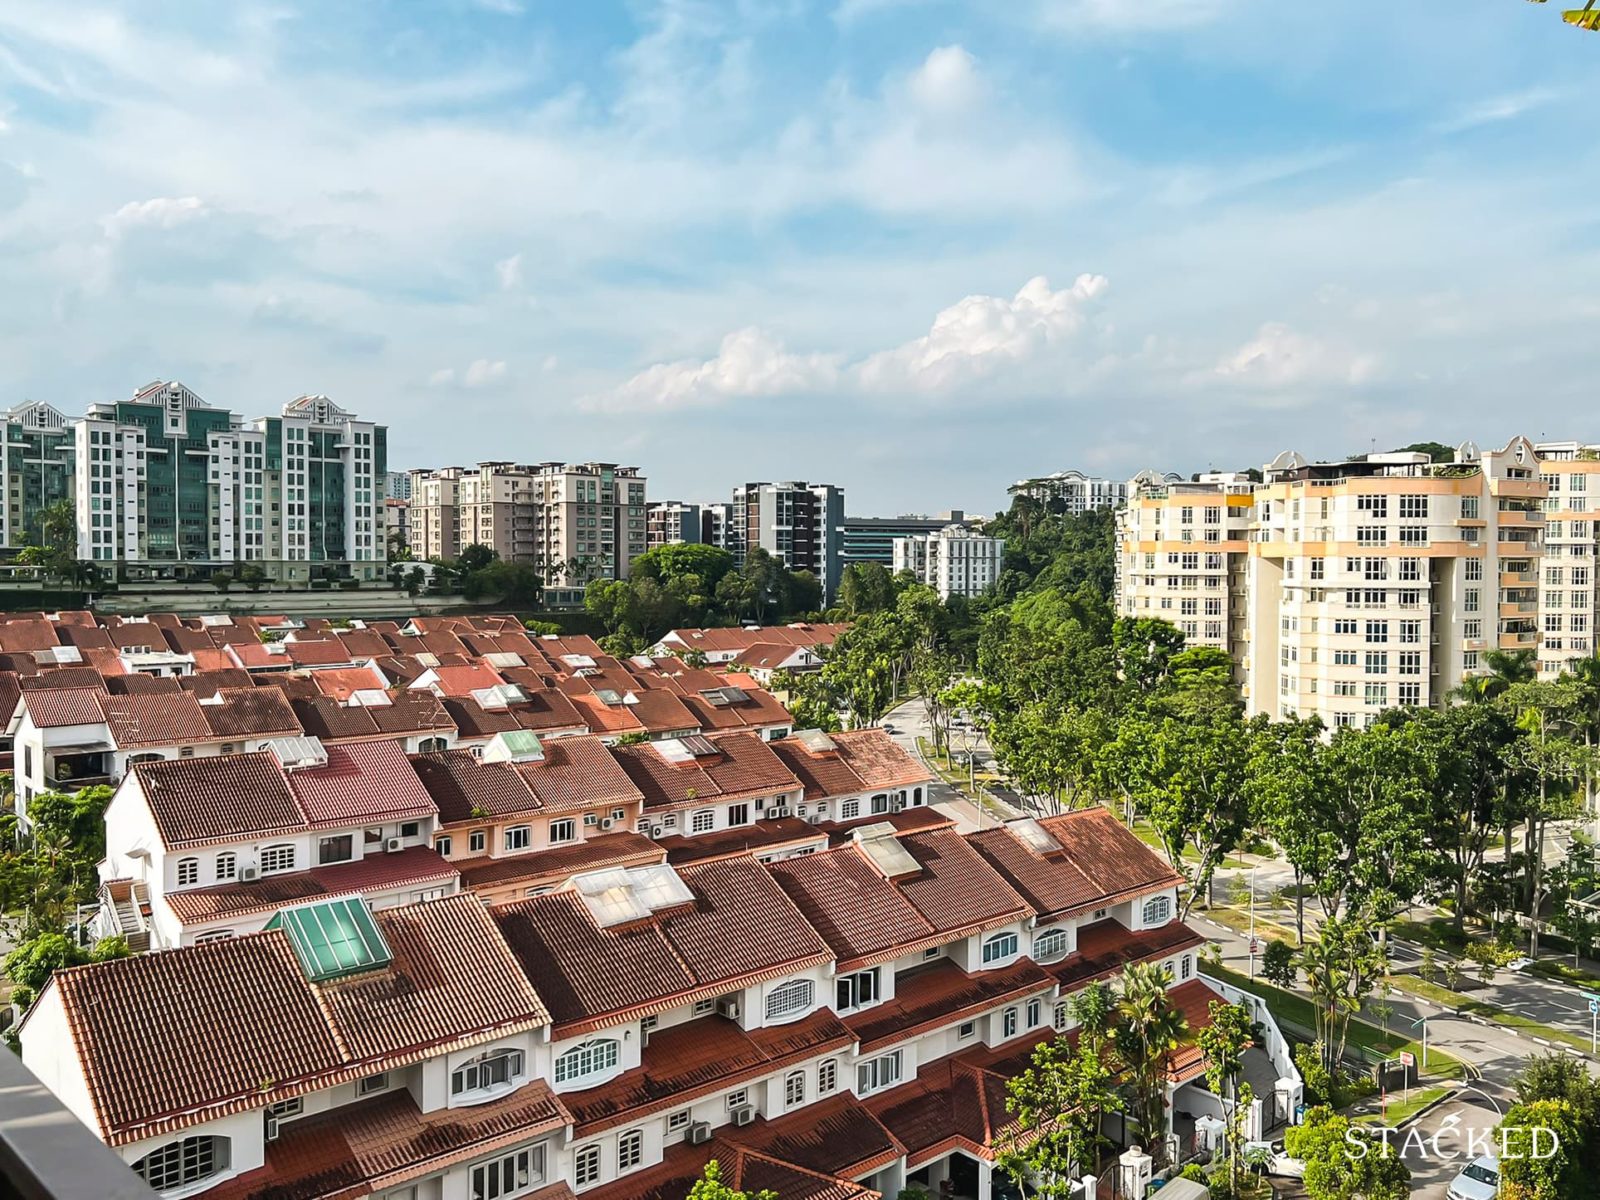
An ongoing assumption about condos is that, it is all about location location, and location. And while no one is really going to argue about the importance of that, it does make you wonder about the more obscure and less accessible plots. Given Singapore is so small and the addition of new MRT lines in the last decade, can even the more "ulu" condos still do well? Let’s take a look and find out:
The challenge for many buyers today isn't access to information.
It's interpreting that information in a way that makes sense for their finances, goals, and stage of life.
Over time, that's also why we decided to work with agents who shared the same data-driven and advisory-led approach behind our editorial, consultants who could help readers think through decisions more objectively, rather than simply push transactions.
Today, the team has worked with more than 2,000 clients across over $5B in property transactions.
Picking out some “ulu” condos
Let's start by saying that there isn’t a strict definition per se, but for the most part, we consider these to be condos with low accessibility to public transport (particularly MRT stations). As a related factor, areas that are far from train stations also tend to be more sparse in terms of amenities, as train stations are usually built near the neighbourhood hub.
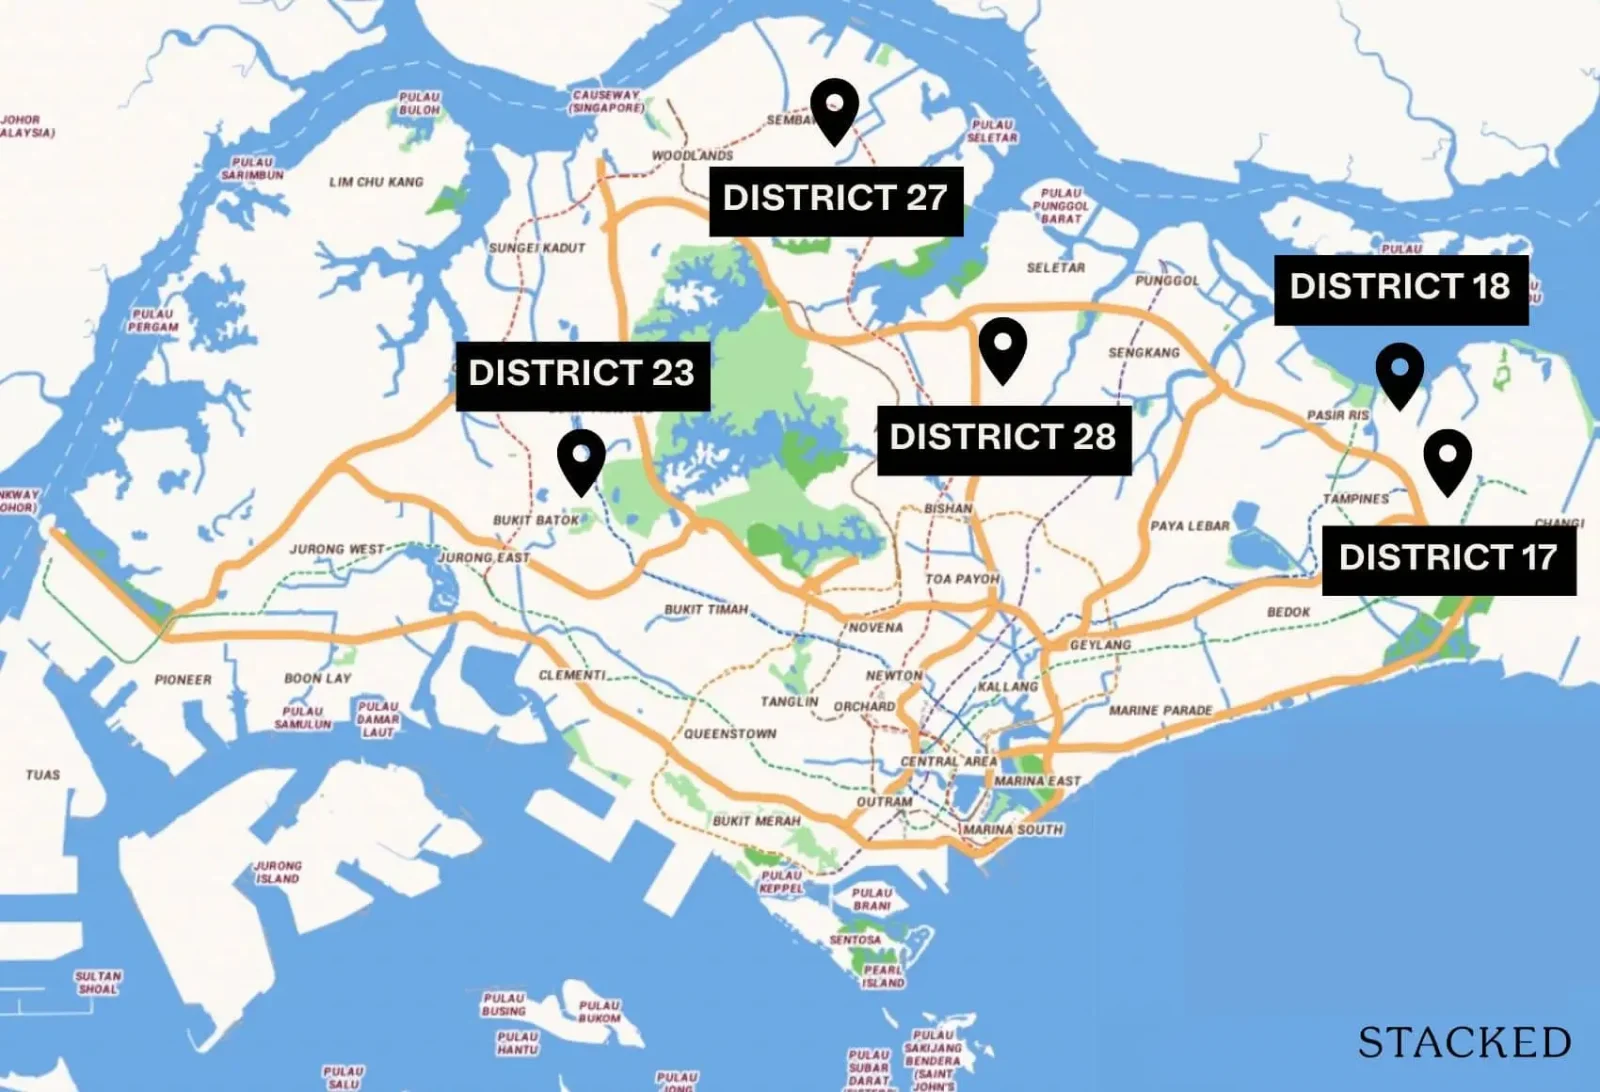
We found that generally, these types of condos can be found in clusters around districts 17, 18, 23, 27, and 28. We also looked only at non-landed residential properties, which had resale transactions up till the end of 2017. We tracked their growth in (resale) price per square foot from 2013 to 2023. Doing it this way filters out new launches entering the resale market in the past 6 years, which would skew the apparent price and drastically change the annualised returns.
We also narrowed the ulu condos down to 62 condos across these districts. This is by no means an exhaustive list, as ulu can be subjective as well.
Here’s how they performed against the overall condo market between 2013 - 2023:
| Year | Not Ulu | Ulu Condos |
| 2013 | $1,420 | $953 |
| 2014 | $1,359 | $892 |
| 2015 | $1,358 | $849 |
| 2016 | $1,393 | $810 |
| 2017 | $1,461 | $831 |
| 2018 | $1,481 | $878 |
| 2019 | $1,506 | $931 |
| 2020 | $1,443 | $909 |
| 2021 | $1,564 | $968 |
| 2022 | $1,676 | $1,075 |
| 2023 | $1,753 | $1,202 |
| Annualised Returns | 2.13% | 2.35% |
| Year | Not Ulu | Ulu Condos |
| 2013 | $1,115 | $805 |
| 2014 | $1,060 | $786 |
| 2015 | $1,073 | $926 |
| 2016 | $1,179 | $980 |
| 2017 | $1,151 | $973 |
| 2018 | $1,187 | $959 |
| 2019 | $1,174 | $983 |
| 2020 | $1,138 | $966 |
| 2021 | $1,219 | $1,003 |
| 2022 | $1,328 | $1,113 |
| 2023 | $1,441 | $1,225 |
| Annualised Returns | 2.60% | 4.28% |
In a general overview, a comparison between freehold ulu and non-ulu condos yielded minor differences in annualised returns. However, the ulu condos outperformed their more accessible counterparts when looking at leasehold condos only. One reason for this could be the fact that ulu condos are located in the OCR (Outside of Central Region) which outperformed the CCR (Core Central Region) over the past 10 years. However, this may not be the most accurate way to see things, as there could be different results when we go into specific districts.
So instead, let’s compare specific districts versus the wider market, starting with District 17
These are the projects we considered 'ulu' in district 17:
| Projects | District | Tenure |
| Le Loyang | 17 | 999 yrs from 29/05/1885 |
| Celadon View | 17 | 999 yrs from 29/05/1885 |
| Coastal Breeze Residences | 17 | 99 yrs from 08/04/2008 |
| Watercrest | 17 | 999 yrs from 07/09/1885 |
| Lighthouse | 17 | 99 yrs from 08/04/1993 |
| Sandy Palm | 17 | 99 yrs from 21/03/1996 |
| JLB Residences | 17 | 946 yrs from 27/11/1937 |
| Clydescove | 17 | 999 yrs from 27/11/1884 |
| Riz Haven | 17 | 946 yrs from 01/01/1938 |
| Bluwaters | 17 | 946 yrs from 23/06/1938 |
| Casa Pasir Ris | 17 | 946 yrs from 01/01/1938 |
| Bluwaters 2 | 17 | 946 yrs from 01/01/1938 |
| Avila Gardens | 17 | Freehold |
| Estella Gardens | 17 | Freehold |
| Azalea Park Condominium | 17 | 999 yrs from 12/10/1885 |
| Carissa Park Condominium | 17 | Freehold |
| Ferraria Park Condominium | 17 | Freehold |
| Palm Isles | 17 | 99 yrs from 14/09/2011 |
| Parc Olympia | 17 | 99 yrs from 25/01/2012 |
| Dahlia Park Condominium | 17 | Freehold |
| The Gale | 17 | Freehold |
| Ballota Park Condominium | 17 | Freehold |
| Edelweiss Park Condominium | 17 | Freehold |
| The Inflora | 17 | 99 yrs from 25/05/2012 |
| Hedges Park Condominium | 17 | 99 yrs from 28/07/2010 |
Leasehold comparison
Only 7 out of the 25 here are leasehold
| Year | D17 Ulu Condos | All of Singapore |
| 2013 | $761 | $1,113 |
| 2014 | $809 | $1,058 |
| 2015 | $841 | $1,071 |
| 2016 | $1,009 | $1,175 |
| 2017 | $942 | $1,145 |
| 2018 | $945 | $1,176 |
| 2019 | $950 | $1,166 |
| 2020 | $937 | $1,130 |
| 2021 | $971 | $1,207 |
| 2022 | $1,091 | $1,316 |
| 2023 | $1,217 | $1,433 |
| Annualised Returns | 4.81% | 2.56% |
Here we begin to see why leasehold ulu condos may have outperformed overall. If we focus on leasehold condos in District 17, we can see they significantly outperformed their leasehold counterparts in the overall market: a notable 4.81 per cent annualised return, versus 2.56 per cent across all leasehold projects in Singapore.
Comparison with freehold condos in District 17
| Year | D17 Ulu Condos | All of Singapore |
| 2013 | $945 | $1,420 |
| 2014 | $894 | $1,359 |
| 2015 | $817 | $1,358 |
| 2016 | $789 | $1,393 |
| 2017 | $790 | $1,461 |
| 2018 | $835 | $1,481 |
| 2019 | $879 | $1,506 |
| 2020 | $844 | $1,443 |
| 2021 | $914 | $1,564 |
| 2022 | $1,015 | $1,676 |
| 2023 | $1,107 | $1,753 |
| Annualised Returns | 1.59% | 2.13% |
In the case of freehold, the performance is the opposite. Since 2013, D17 ulu freehold condos gained 1.59% on an annualised basis compared to the 2.13% compared to freehold projects in Singapore.
District 18 gives us a smaller list of effectively two “ulu” condos:
| Projects | District | Tenure |
| Ripple Bay | 18 | 99 yrs from 10/08/2011 |
| Sea Esta | 18 | 99 yrs from 09/01/2012 |
| Seastrand | 18 | 99 yrs from 03/01/2011 |
All of the projects here are leasehold. As they have a lease start year of 2011/2012, we only saw the first resale transaction in 2016.
| Year | D18 Ulu Condos | All of Singapore |
| 2016 | $1,019 | $1,175 |
| 2017 | $1,013 | $1,145 |
| 2018 | $1,011 | $1,176 |
| 2019 | $1,052 | $1,166 |
| 2020 | $1,009 | $1,130 |
| 2021 | $1,064 | $1,207 |
| 2022 | $1,172 | $1,316 |
| 2023 | $1,294 | $1,433 |
| Annualised Returns | 3.46% | 2.88% |
Note: We eliminated 2015 for comparison purposes, as only a single condo saw a transaction that year.
Price movements did mirror the wider market somewhat, as 2016 was a property low point, and 2023 as we know saw property prices peak. But overall, the annualised returns outperformed the wider market, with Seastrand and Ripplebay doing most of the heavy lifting. Sea Esta seemed to just keep ahead of inflation.
Here's a breakdown by condos:
| Year | RIPPLE BAY | SEA ESTA | SEASTRAND |
| 2016 | $1,049 | $1,049 | $980 |
| 2017 | $1,036 | $1,029 | $960 |
| 2018 | $1,045 | $995 | $974 |
| 2019 | $1,100 | $1,023 | $996 |
| 2020 | $1,032 | $1,023 | $965 |
| 2021 | $1,089 | $1,070 | $1,025 |
| 2022 | $1,213 | $1,152 | $1,122 |
| 2023 | $1,352 | $1,235 | $1,225 |
| Annualised | 3.69% | 2.37% | 3.24% |
Next, let’s look at District 23
| Project | District | Tenure |
| The Petals | 23 | Freehold |
| Meralodge | 23 | Freehold |
| Hillview Apartments | 23 | Freehold |
| The Lanai | 23 | 999 yrs from 12/10/1885 |
| Hillview 128 | 23 | 999 yrs from 12/10/1885 |
| Hillview Residence | 23 | 999 yrs from 12/10/1885 |
| The Amston | 23 | 999 yrs from 12/10/1885 |
| Montrosa | 23 | 999 yrs from 12/10/1885 |
| Merawoods | 23 | 999 yrs from 12/10/1885 |
District 23 has all freehold properties only. The performance of “ulu” condos here has been impressive over the past decade.
| Year | D23 Ulu Condos | All of Singapore |
| 2013 | $975 | $1,420 |
| 2014 | $906 | $1,359 |
| 2015 | $957 | $1,358 |
| 2016 | $857 | $1,393 |
| 2017 | $931 | $1,461 |
| 2018 | $1,000 | $1,481 |
| 2019 | $1,023 | $1,506 |
| 2020 | $1,051 | $1,443 |
| 2021 | $1,162 | $1,564 |
| 2022 | $1,292 | $1,676 |
| 2023 | $1,435 | $1,753 |
| Annualised Returns | 3.94% | 2.13% |
Here’s a look at the various “ulu” projects and how they’ve fared individually:
| Year | HILLVIEW 128 | HILLVIEW APARTMENTS | HILLVIEW RESIDENCE | MERALODGE | MERAWOODS | MONTROSA | THE AMSTON | THE LANAI | THE PETALS |
| 2013 | $936 | $866 | $941 | $944 | $1,021 | $1,016 | $911 | $1,010 | |
| 2014 | $966 | $1,060 | $908 | $761 | |||||
| 2015 | $900 | $932 | $937 | $878 | $1,633 | $902 | |||
| 2016 | $881 | $821 | $852 | $901 | $987 | $781 | |||
| 2017 | $927 | $846 | $902 | $923 | $958 | $856 | $874 | $1,258 | $893 |
| 2018 | $976 | $1,019 | $1,021 | $1,033 | $912 | $959 | $1,344 | $951 | |
| 2019 | $979 | $883 | $1,020 | $1,016 | $912 | $1,006 | $1,323 | $948 | |
| 2020 | $1,000 | $1,028 | $988 | $1,063 | $982 | $1,017 | $1,334 | $919 | |
| 2021 | $1,031 | $1,083 | $1,148 | $1,096 | $1,151 | $1,006 | $1,394 | $1,430 | $1,042 |
| 2022 | $1,087 | $1,190 | $1,296 | $1,182 | $1,326 | $1,223 | $1,334 | $1,487 | $1,342 |
| 2023 | $1,316 | $1,373 | $1,404 | $1,266 | $1,405 | $1,369 | $1,380 | $1,574 | $1,156 |
Note that the one exception to the strong gains, the Lanai, is due to a transaction with a high initial price psf in 2015 (it appears that someone overpaid for a 1,378 sq. ft. unit).
In District 27, the freehold properties were the main outperformed:
| Year | D27 Ulu Condos | All of Singapore |
| 2016 | $740 | $1,393 |
| 2017 | $741 | $1,461 |
| 2018 | $811 | $1,481 |
| 2019 | $815 | $1,506 |
| 2020 | $853 | $1,443 |
| 2021 | $923 | $1,564 |
| 2022 | $1,070 | $1,676 |
| 2023 | $1,117 | $1,753 |
| Annualised Returns | 6.07% | 3.34% |
Sembawang/Yishun attracts a lot of less positive comments about being underdeveloped, but freehold condos here have moved from just $700 psf to around $1,000 psf in seven years. This may be due to a lot of condos here having room for appreciation, as it’s precisely their “ulu” reputation that caused them to be priced much lower at the start.
District 28 has just two freehold properties that fit the “ulu” descriptor:
| Projects | District | Tenure |
| Seletaris | 27 | Freehold |
| The Sensoria | 27 | Freehold |
| Skies Miltonia | 27 | 99 yrs from 20/02/2012 |
| The Miltonia Residences | 27 | 99 yrs from 30/11/2010 |
Again, we can see both properties outperformed the wider market.
Why has this happened? It’s multifactorial, and some of the things to consider are:
- “Ulu” condos were priced cheaper to begin with, and had more room for gains when conditions allowed the property market to rise.
- Accessibility issues don’t always factor into weaker gains, because most condo buyers can buy a car and don’t care as much about MRT stations as we assume.
- Due to Singapore’s excellent infrastructure and compact size, even the most “ulu” condo is probably no more than an hour from the nearest mall or entertainment hub (if not Orchard itself); so the value is still there for buyers.
- There are more malls, more MRT stations, and more decentralised hubs every few years; and there’s strong buyer confidence that, in the long run, all such issues will be fixed with time. These assumptions have never been proven wrong so far, by the way, as even HDB is now scrapping the mature/non-mature system as it loses relevance.
The two leasehold properties performed rather averagely when compared to the overall market:
| Year | D27 Ulu Condos | All of Singapore |
| 2016 | $975 | $1,175 |
| 2017 | $1,020 | $1,145 |
| 2018 | $920 | $1,176 |
| 2019 | $971 | $1,166 |
| 2020 | $1,004 | $1,130 |
| 2021 | $1,016 | $1,207 |
| 2022 | $1,104 | $1,316 |
| 2023 | $1,187 | $1,433 |
| Annualised Returns | 2.85% | 2.88% |
The “ulu” factor may be more of a concern for landlords, than owner-investors or owner-occupiers
Being in an inaccessible location does affect rentability (if not always rental yield). Tenants are certainly not going to wait for years and years for amenities to build up; and not every foreign worker is an affluent executive who can drive - or be driven - everywhere. So for landlords, this is definitely a huge concern; but those focused on resale gains may be able to use the age-old approach of just holding on for long enough.
At Stacked, we like to look beyond the headlines and surface-level numbers, and focus on how things play out in the real world.
If you'd like to discuss how this applies to your own circumstances, you can reach out for a one-to-one consultation here.
And if you simply have a question or want to share a thought, feel free to write to us at stories@stackedhomes.com. We read every message.





0 Comments