

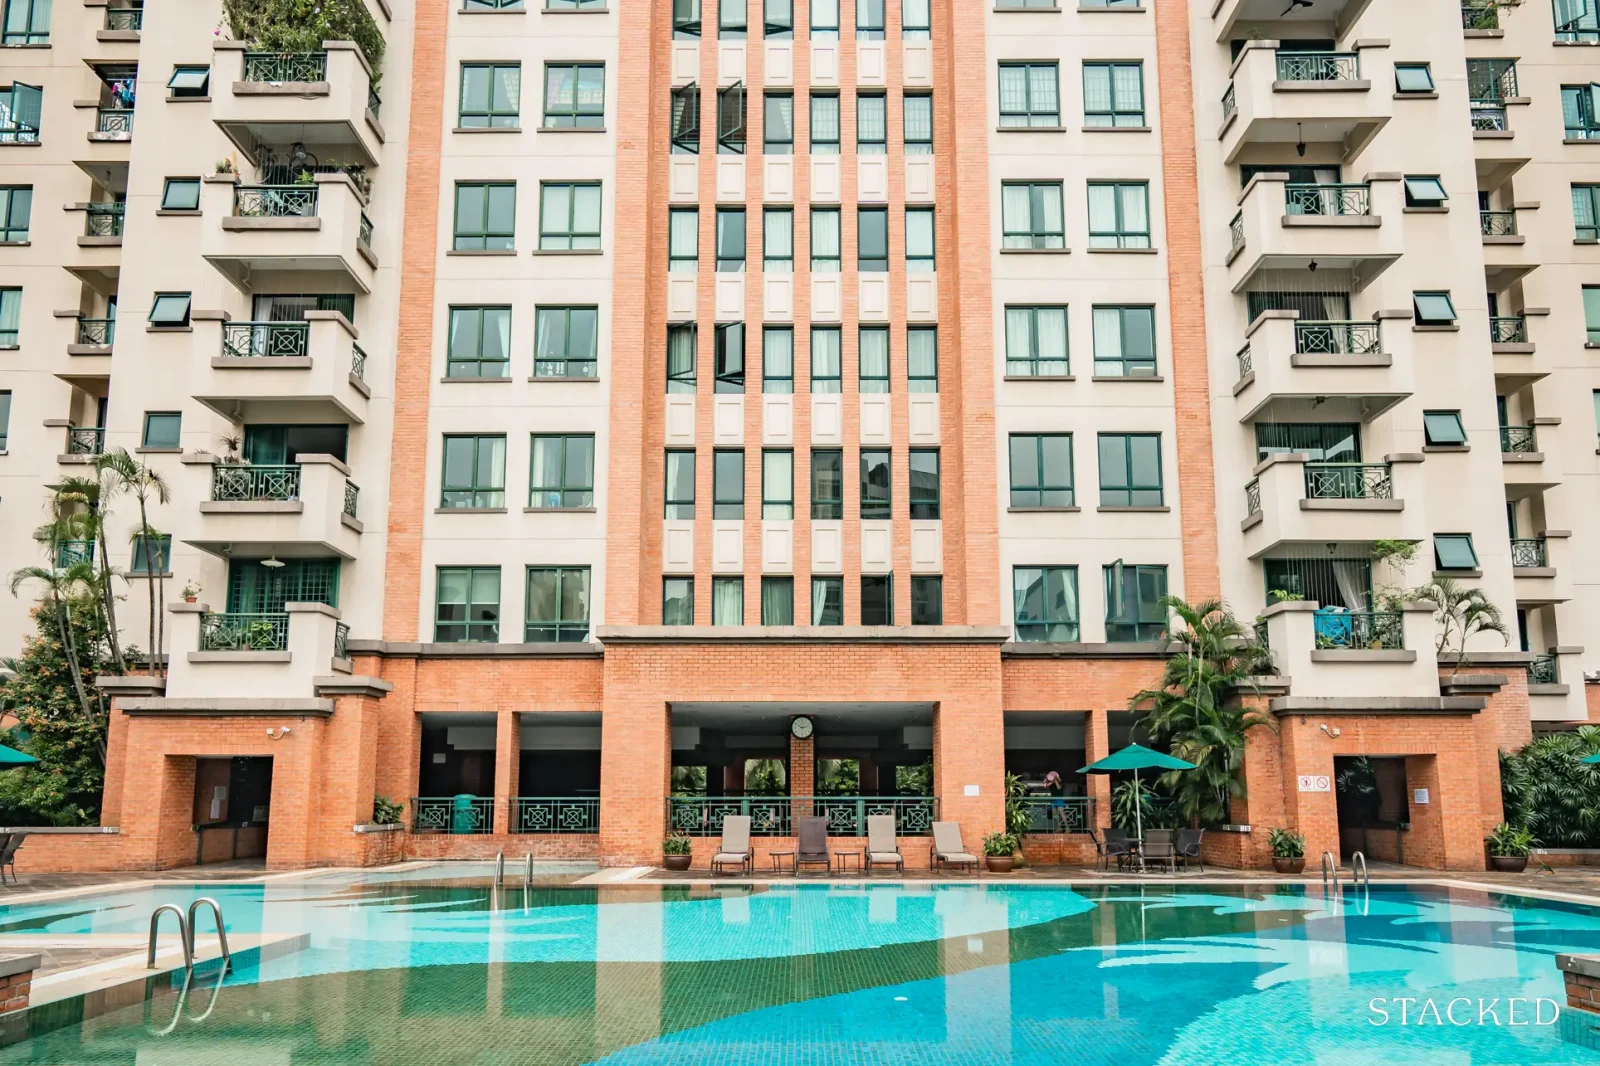
In theory, freehold condos should continue to appreciate well over the years. One common argument you’ll hear, for example, is that because developers won’t need to top up the lease, freehold projects have better en-bloc value and potential. But there’s growing skepticism these days, as some ponder whether maintaining a condo for 40+ years is truly viable - and with new projects appearing nearby, could a very old condo still appreciate well, even if it’s freehold? We took a look:
The challenge for many buyers today isn't access to information.
It's interpreting that information in a way that makes sense for their finances, goals, and stage of life.
Over time, that's also why we decided to work with agents who shared the same data-driven and advisory-led approach behind our editorial, consultants who could help readers think through decisions more objectively, rather than simply push transactions.
Today, the team has worked with more than 2,000 clients across over $5B in property transactions.
Average freehold condo prices based on age:
| Year/Age | Less Than 10 Years Old | Less Than 20 Years Old | Less Than 30 Years Old | Less Than 40 Years Old | 40 Years Or More | Grand Total |
| 2014 | $1,609 | $1,249 | $1,212 | $1,194 | $1,003 | $1,510 |
| 2015 | $1,588 | $1,222 | $1,124 | $1,148 | $1,029 | $1,441 |
| 2016 | $1,663 | $1,210 | $1,100 | $1,140 | $1,051 | $1,475 |
| 2017 | $1,705 | $1,235 | $1,167 | $1,180 | $1,172 | $1,505 |
| 2018 | $1,821 | $1,345 | $1,238 | $1,320 | $1,264 | $1,620 |
| 2019 | $2,118 | $1,444 | $1,308 | $1,342 | $1,279 | $1,804 |
| 2020 | $1,963 | $1,423 | $1,290 | $1,359 | $1,169 | $1,695 |
| 2021 | $2,057 | $1,621 | $1,384 | $1,445 | $1,364 | $1,816 |
| 2022 | $2,280 | $1,741 | $1,507 | $1,625 | $1,622 | $1,999 |
| 2023 | $2,459 | $1,846 | $1,617 | $1,671 | $1,567 | $2,117 |
| 2024 | $2,427 | $1,873 | $1,702 | $1,627 | $1,592 | $2,000 |
| Grand Total | $1,944 | $1,492 | $1,346 | $1,375 | $1,381 | $1,730 |
This shows the average price per square foot of a freehold condo, upon each decade it ages. For those who are interested in how it measures up versus leasehold, you can compare it to this article.
Based on the linked article, leasehold condos that are 10 years old or under average $1,410 psf, which is about 31.8 per cent lower than a freehold equivalent.
At 40+ years old, the average leasehold condo is around $997 psf, which is about 32.9 per cent lower than a freehold counterpart. This is a very slim difference, and suggests that leasehold may not fall as drastically as expected versus freehold; not even after 40+ years.
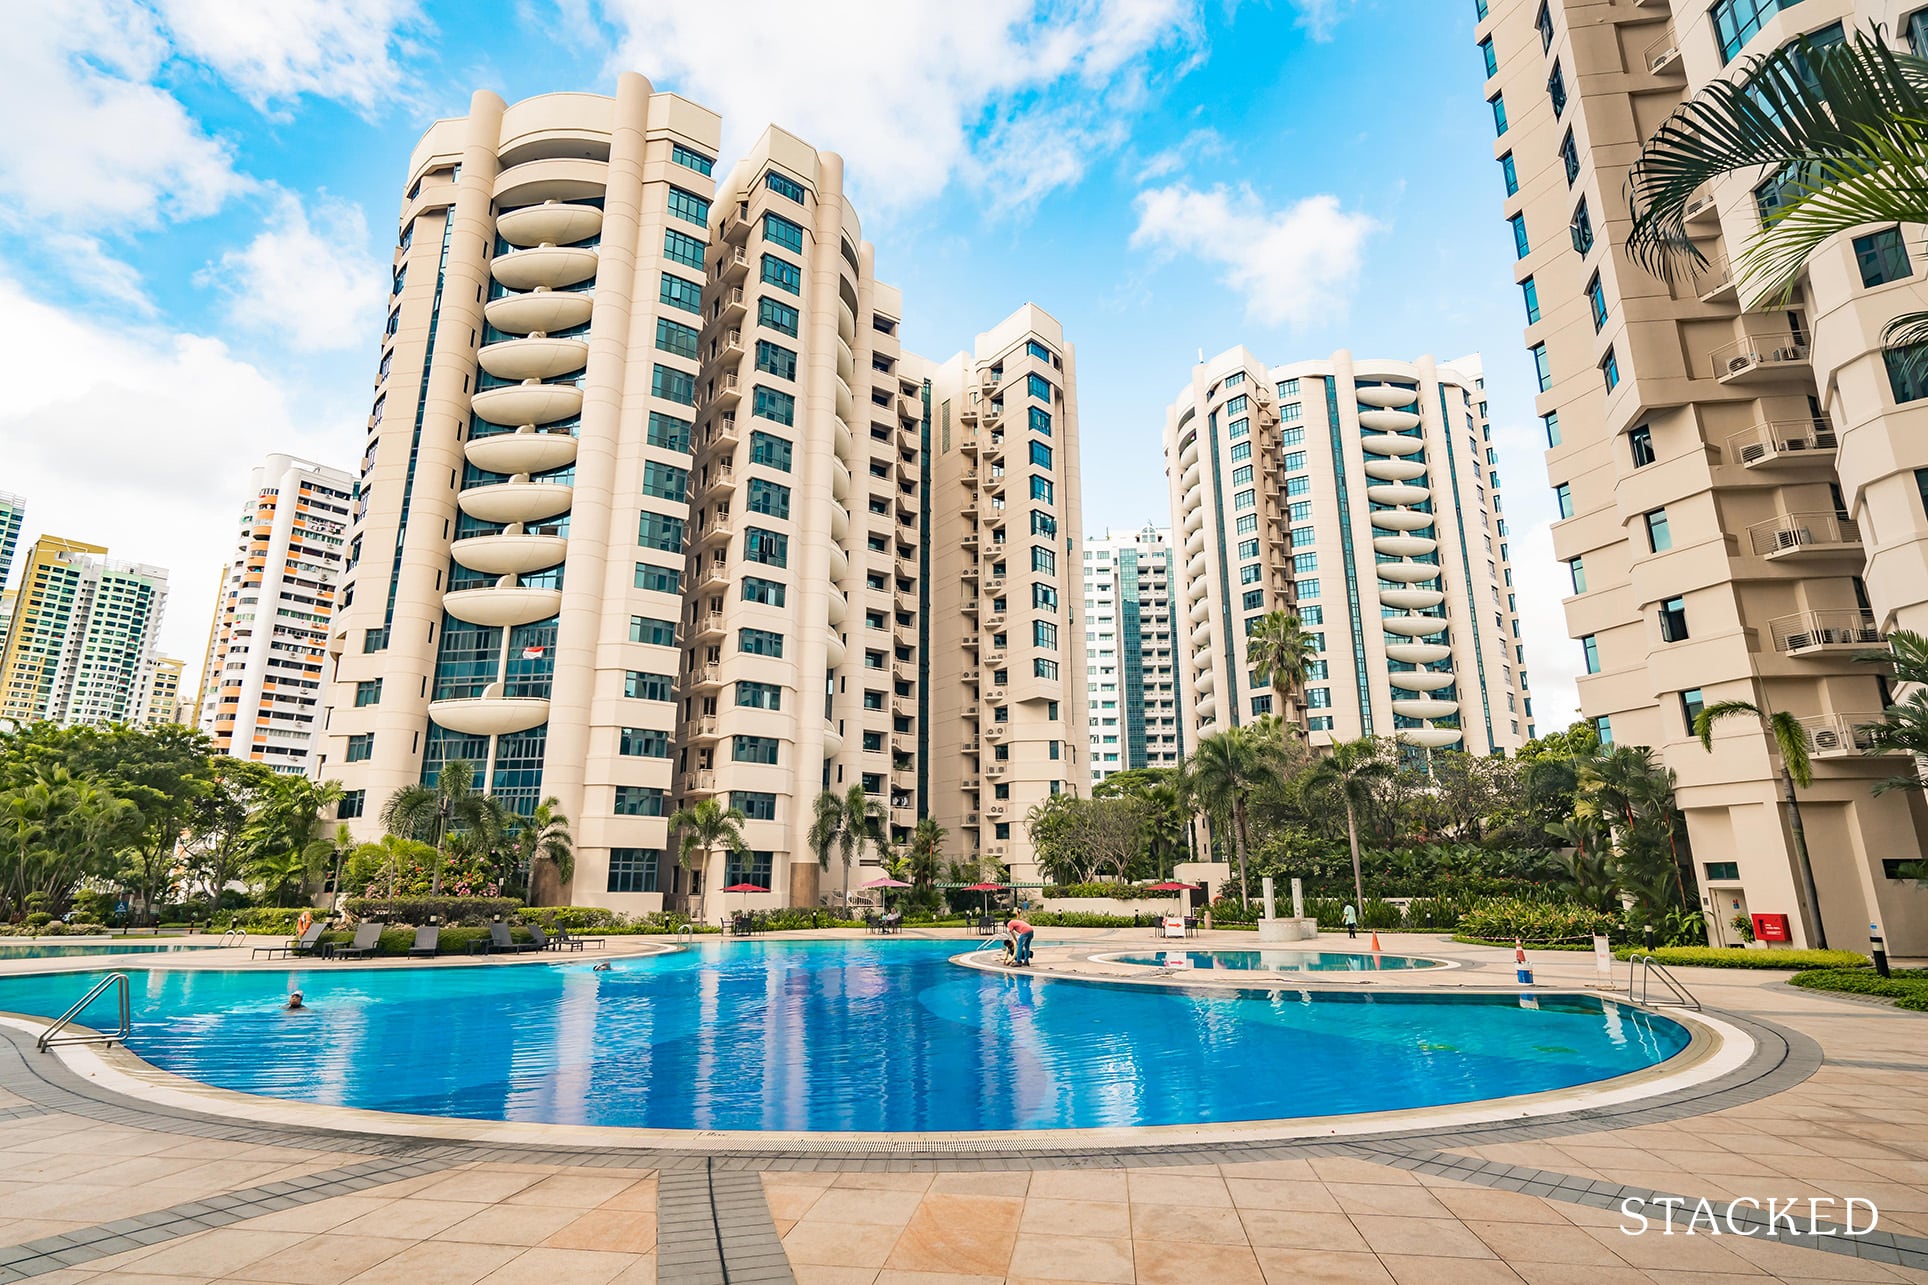
Another interesting point here is that, if you’re willing to settle for a condo that’s 30+ years old, you may be looking at a quantum of $1.6 million to $1.7 million for a 1,000 sq. ft. (roughly three-bedder) unit.
So a freehold, family-sized condo unit may still be within reach for upgraders in 2024, if they can bear with an ageing property located further away.
Let’s look at how much freehold condos appreciate on average, based on age:
| Year/Age | Less Than 10 Years Old | Less Than 20 Years Old | Less Than 30 Years Old | Less Than 40 Years Old | 40 Years Or More |
| 2014 | |||||
| 2015 | -1.33% | -2.12% | -7.27% | -3.85% | 2.65% |
| 2016 | 4.75% | -1.02% | -2.20% | -0.69% | 2.17% |
| 2017 | 2.50% | 2.13% | 6.14% | 3.53% | 11.47% |
| 2018 | 6.84% | 8.91% | 6.11% | 11.83% | 7.83% |
| 2019 | 16.32% | 7.33% | 5.65% | 1.63% | 1.19% |
| 2020 | -7.35% | -1.47% | -1.37% | 1.29% | -8.61% |
| 2021 | 4.81% | 13.96% | 7.26% | 6.31% | 16.69% |
| 2022 | 10.84% | 7.38% | 8.89% | 12.52% | 18.89% |
| 2023 | 7.84% | 6.05% | 7.27% | 2.82% | -3.39% |
| 2024 | -1.31% | 1.46% | 5.28% | -2.66% | 1.64% |
| Grand Total | 4.39% | 4.26% | 3.58% | 3.27% | 5.05% |
| Total Volume | 33277 | 14368 | 7136 | 2195 | 569 |
The condos seem to fare better in the first two decades (perhaps because the condo isn’t considered “very old” yet), or toward the 40+ year mark, when we may be seeing a long holding period show its rewards.
Average percentage gains or losses during transactions
| Row Labels | Less Than 10 Years Old | Less Than 20 Years Old | Less Than 30 Years Old | Less Than 40 Years Old | More Than 40 Years Old | Grand Total |
| 2014 | 7.8% | 20.7% | 26.4% | 13.0% | 31.3% | 11.0% |
| 2015 | 11.9% | 24.6% | 29.1% | 31.7% | 46.0% | 16.4% |
| 2016 | 14.6% | 31.0% | 31.3% | 35.3% | 21.5% | 20.3% |
| 2017 | 15.6% | 29.1% | 31.8% | 34.4% | 24.4% | 21.0% |
| 2018 | 11.7% | 21.1% | 23.8% | 34.7% | 28.9% | 16.0% |
| 2019 | 13.7% | 26.4% | 33.3% | 33.1% | 24.7% | 19.5% |
| 2020 | 18.4% | 30.6% | 34.5% | 32.8% | 34.2% | 24.6% |
| 2021 | 13.7% | 24.0% | 24.4% | 7.5% | 32.1% | 18.9% |
| 2022 | 8.1% | 33.3% | 12.4% | 6.3% | 15.0% | |
| 2023 | 1.5% | 4.1% | 2.5% | |||
| Grand Total | 12.5% | 25.9% | 29.0% | 31.8% | 26.9% | 17.5% |
The highest percentage gains seem to come from selling between the 30 to 40-year mark, but not after. Similar to leasehold counterparts, profits may weaken past the 40-year mark due to financing issues. Banks tend to lower the maximum loan quantum at that point, which necessitates a higher cash outlay; and this may in turn exert downward pressure on prices.
Looking at performance by District
Profitability
| Year/District | D1 | D2 | D3 | D4 | D5 | D7 | D8 | D9 | D10 | D11 | D12 | D13 | D14 | D15 | D16 | D17 | D18 | D19 | D20 | D21 | D23 | D26 | D27 | D28 | Grand Total |
| 2014 | 7% | 8% | 6% | 12% | 7% | 5% | 12% | 11% | 9% | 14% | 7% | 17% | 17% | 5% | 4% | 10% | 8% | 18% | 21% | 1% | 9% | 14% | 11% | ||
| 2015 | 6% | 31% | 21% | 9% | 13% | 20% | 14% | 12% | 18% | 13% | 18% | 27% | 17% | 9% | 11% | 11% | 26% | 21% | 26% | 16% | 23% | 16% | |||
| 2016 | 31% | 9% | 21% | 7% | 16% | 16% | 22% | 20% | 18% | 13% | 12% | 23% | 25% | 20% | 15% | 14% | 33% | 29% | 33% | 27% | 24% | 20% | |||
| 2017 | 31% | 8% | 33% | 11% | 22% | 15% | 17% | 21% | 18% | 20% | 16% | 14% | 24% | 30% | 27% | 17% | 20% | 30% | 31% | 33% | 47% | 35% | 21% | ||
| 2018 | 5% | 13% | 14% | 13% | 12% | 15% | 15% | 14% | 16% | 14% | 17% | 19% | 23% | 31% | 17% | 17% | 25% | 21% | 11% | 38% | 34% | 16% | |||
| 2019 | 9% | 21% | 6% | 18% | 22% | 9% | 19% | 21% | 13% | 32% | 17% | 22% | 28% | 21% | 27% | 17% | 26% | 26% | 39% | 32% | 20% | ||||
| 2020 | 13% | 22% | 25% | 24% | 9% | 27% | 19% | 25% | 25% | 23% | 28% | 24% | 35% | 26% | 15% | 22% | 33% | 41% | 44% | 25% | |||||
| 2021 | 10% | 33% | -15% | 9% | 8% | 18% | 12% | 12% | 16% | 14% | 27% | 27% | 43% | 15% | 19% | ||||||||||
| 2022 | 3% | 16% | 37% | 4% | 7% | 15% | 11% | 15% | |||||||||||||||||
| 2023 | 0% | 2% | -2% | 10% | 3% | ||||||||||||||||||||
| Grand Total | 23% | 8% | 21% | 9% | 17% | 7% | 12% | 12% | 19% | 16% | 15% | 18% | 13% | 21% | 24% | 20% | 8% | 15% | 14% | 26% | 26% | 26% | 29% | 24% | 18% |
Volume
| Year/District | D1 | D2 | D3 | D4 | D5 | D7 | D8 | D9 | D10 | D11 | D12 | D13 | D14 | D15 | D16 | D17 | D18 | D19 | D20 | D21 | D23 | D26 | D27 | D28 | Grand Total |
| 2014 | 1 | 10 | 7 | 58 | 43 | 98 | 109 | 66 | 72 | 5 | 109 | 163 | 18 | 29 | 5 | 74 | 12 | 52 | 28 | 5 | 4 | 6 | 974 | ||
| 2015 | 4 | 1 | 33 | 27 | 76 | 116 | 60 | 62 | 24 | 71 | 163 | 18 | 26 | 3 | 64 | 22 | 46 | 22 | 8 | 2 | 6 | 854 | |||
| 2016 | 10 | 11 | 23 | 1 | 28 | 76 | 121 | 62 | 45 | 10 | 67 | 151 | 13 | 16 | 49 | 23 | 44 | 28 | 8 | 7 | 10 | 803 | |||
| 2017 | 2 | 18 | 9 | 4 | 42 | 30 | 100 | 162 | 72 | 85 | 25 | 97 | 199 | 23 | 35 | 63 | 10 | 68 | 36 | 11 | 4 | 4 | 1099 | ||
| 2018 | 6 | 7 | 38 | 20 | 75 | 95 | 55 | 96 | 10 | 87 | 141 | 15 | 21 | 1 | 55 | 7 | 39 | 25 | 5 | 3 | 2 | 803 | |||
| 2019 | 19 | 4 | 2 | 15 | 3 | 28 | 34 | 26 | 27 | 6 | 40 | 89 | 8 | 18 | 23 | 6 | 11 | 12 | 3 | 1 | 375 | ||||
| 2020 | 2 | 1 | 9 | 4 | 15 | 20 | 11 | 18 | 4 | 21 | 34 | 2 | 10 | 12 | 2 | 27 | 14 | 3 | 1 | 210 | |||||
| 2021 | 1 | 1 | 1 | 3 | 5 | 11 | 2 | 5 | 1 | 6 | 21 | 4 | 1 | 3 | 65 | ||||||||||
| 2022 | 1 | 2 | 2 | 2 | 1 | 3 | 1 | 12 | |||||||||||||||||
| 2023 | 1 | 2 | 1 | 1 | 5 | ||||||||||||||||||||
| Grand Total | 3 | 56 | 43 | 19 | 222 | 1 | 157 | 474 | 672 | 357 | 410 | 85 | 499 | 965 | 97 | 159 | 9 | 341 | 82 | 291 | 165 | 43 | 21 | 29 | 5200 |
Unfortunately, this isn’t too useful, because freehold properties tend to cluster heavily in some areas but are very rare in others.
In Districts 9 and 10 for example (the Orchard to Bukit Timah areas), it’s more common to find older freehold rather than leasehold properties; conversely, District 25 (Woodlands) doesn’t even appear, as almost everything there is leasehold.
For some of these districts, the transaction volume is so low that the “average” gains don’t mean much, and prices can be volatile. So the gains in Districts like 9 or 10 may provide a more accurate depiction of the area (we’d be careful with District 15, as the area includes many boutique freehold condos that can be quite volatile).
When is the freehold premium worth paying?
In general, the freehold premium (about 15 to 20 per cent higher than a leasehold) only starts to pay for itself much later on. If you’re going to sell within a short period like 10 years, for example, the freehold status doesn’t really mean much; but if you’re selling only in 30+ years, then it may prove its worth without the lease decay.
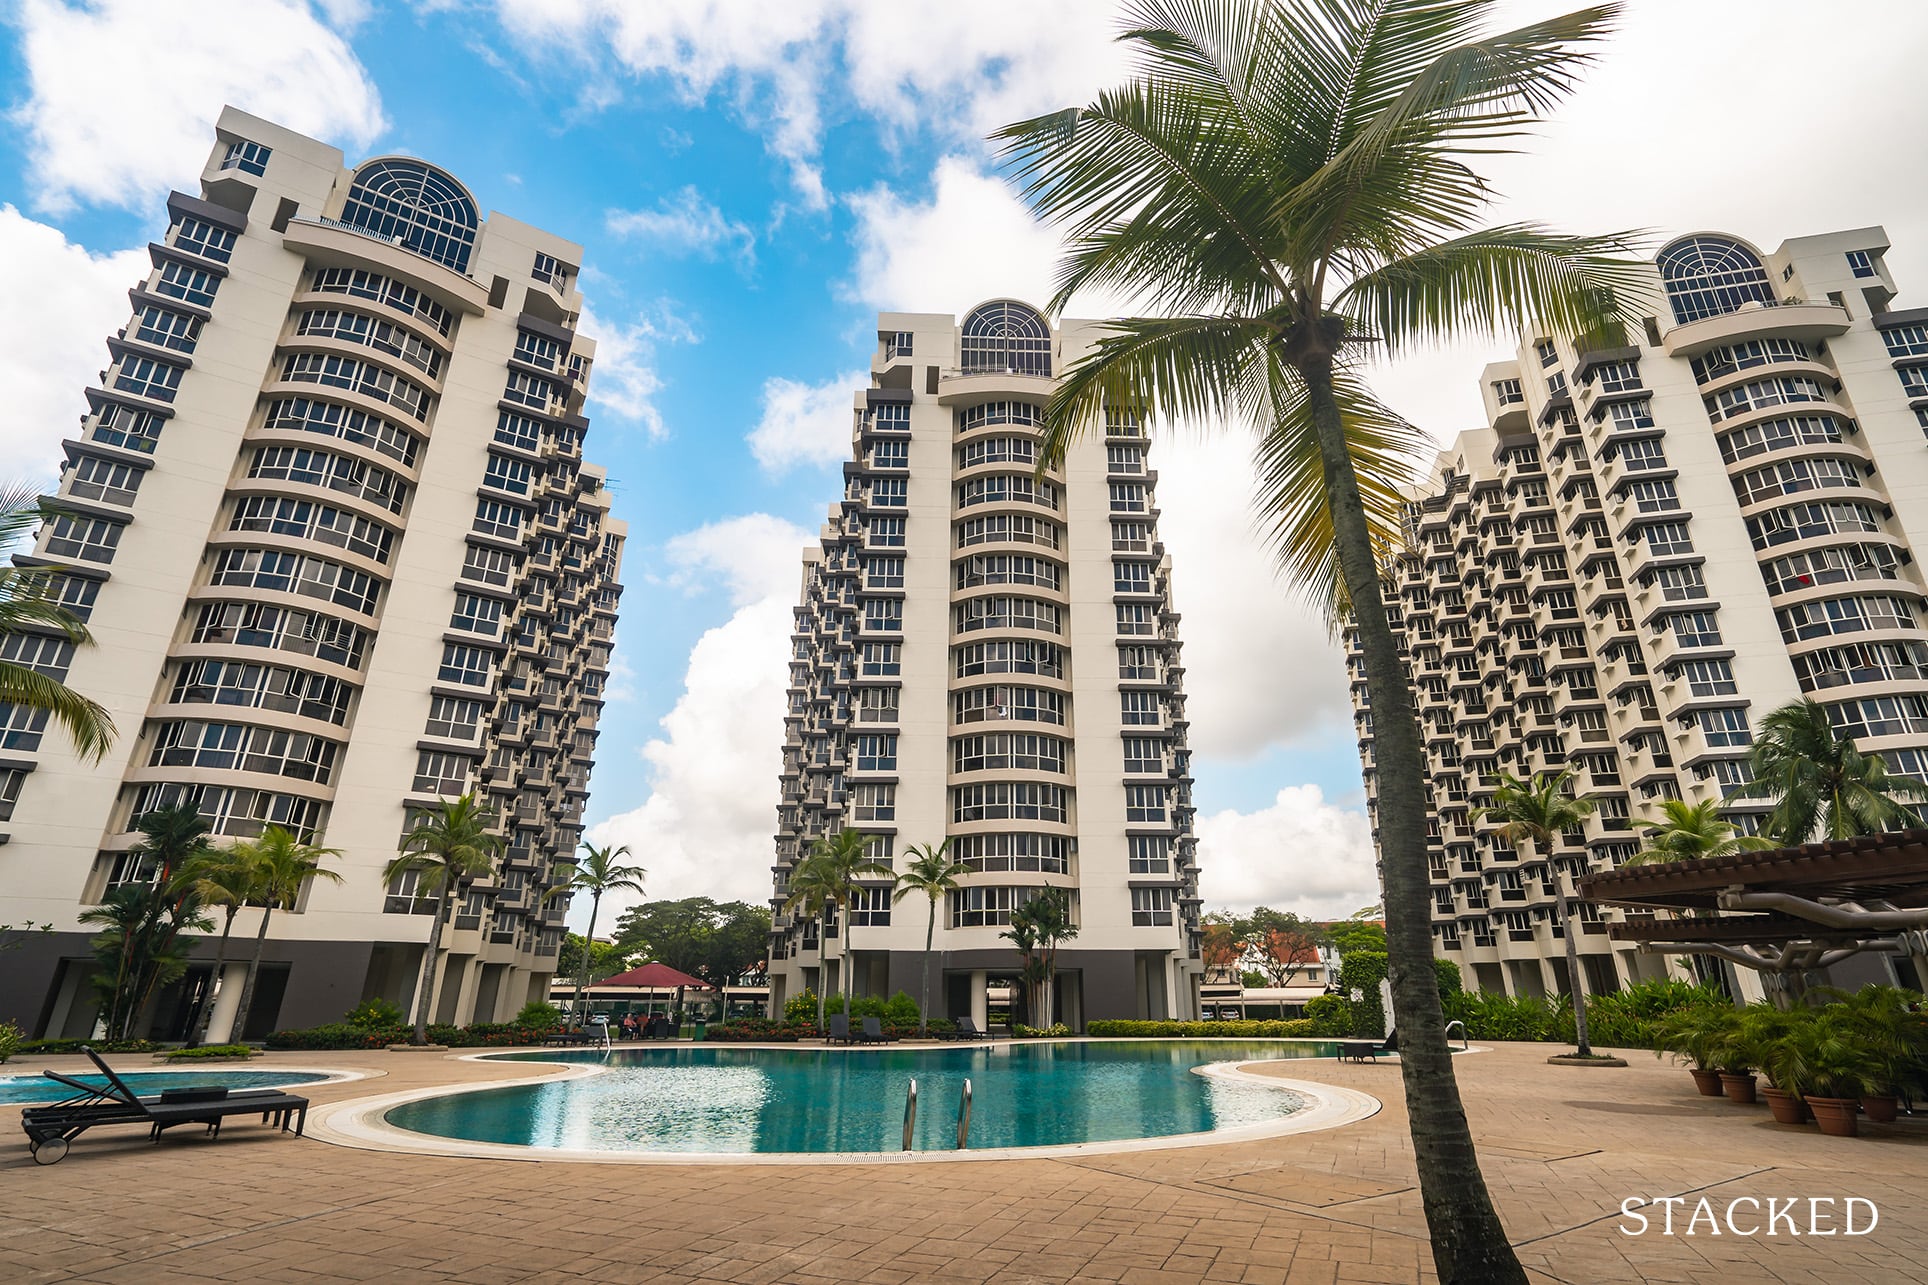
Due to the long holding period, a concern for homeowners is how well the condo is maintained. This could be an issue in very big developments with lots of facilities - you have to question if the multiple swimming pools, landscaped areas, BBQ pits, etc. will still look good after you hold for so long. Freehold status protects your property from lease decay, but not from declining condo management.
At Stacked, we like to look beyond the headlines and surface-level numbers, and focus on how things play out in the real world.
If you'd like to discuss how this applies to your own circumstances, you can reach out for a one-to-one consultation here.
And if you simply have a question or want to share a thought, feel free to write to us at stories@stackedhomes.com. We read every message.





2 Comments
Maybe an old condo comes with a plot ratio that is lower than maximum allowance,
whereas newer condos would have been built to latest max plot ratio allowed