

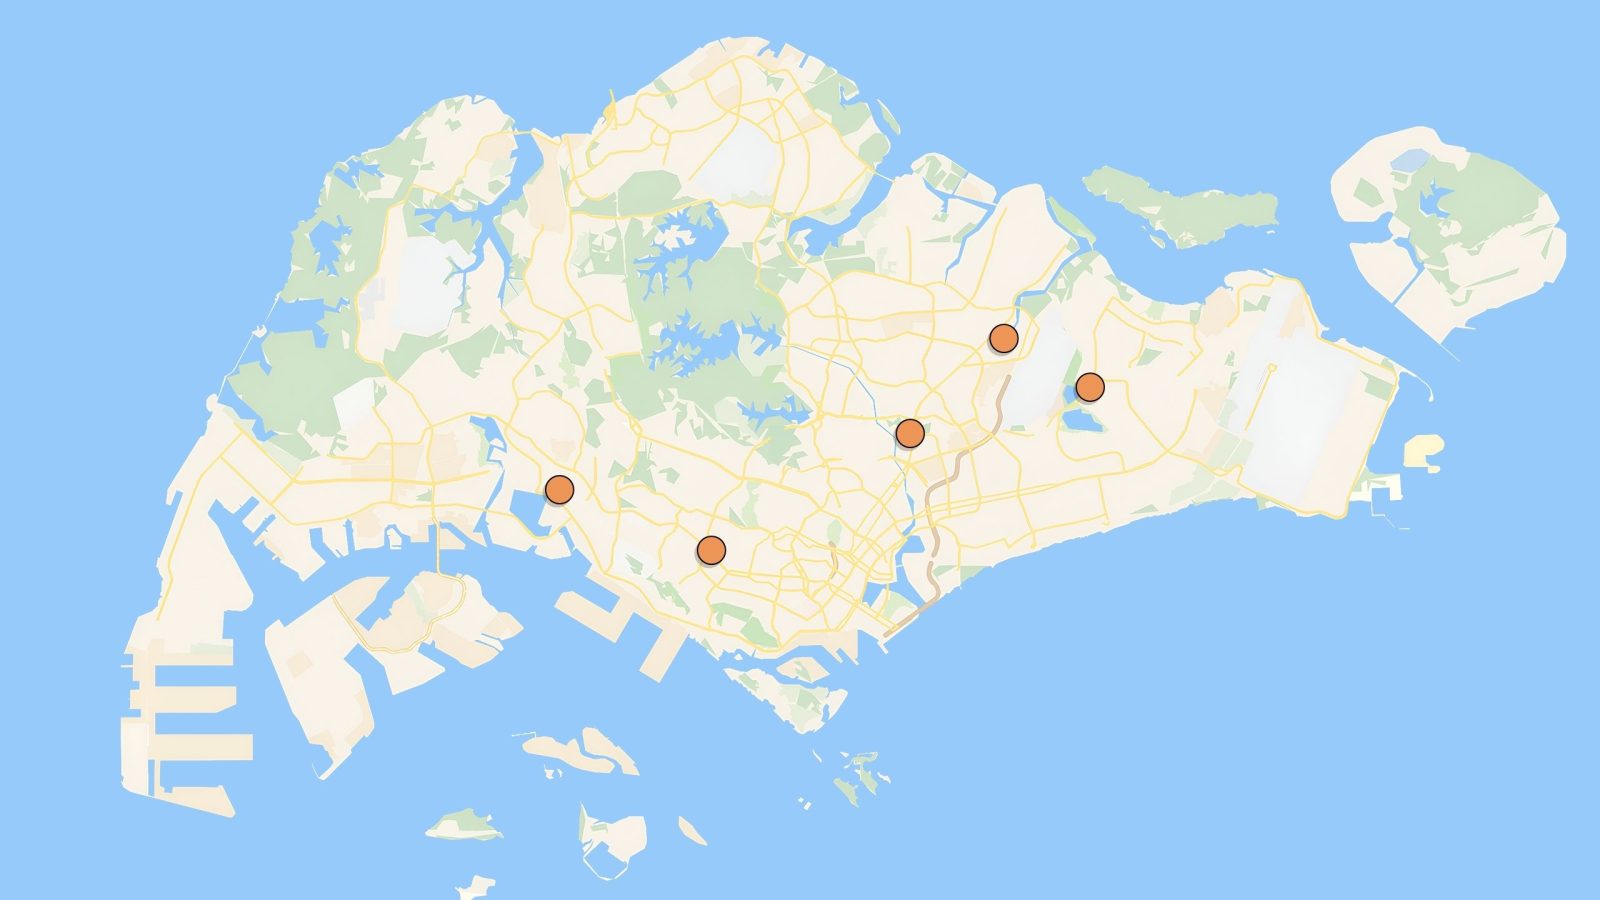
2018 was when the property market began recovering, after the trough years of 2016/17. At the time, most of us market watchers had the sense that home prices were about to start rising again; but many of us were caught flat-footed when cooling measures came again later in the year. For the projects that did well at launch though, did the wisdom of the crowds prevail? Does a project that sells well also resell well?
Here’s a quick peek at the launches of 2018, in order of how quickly they moved:
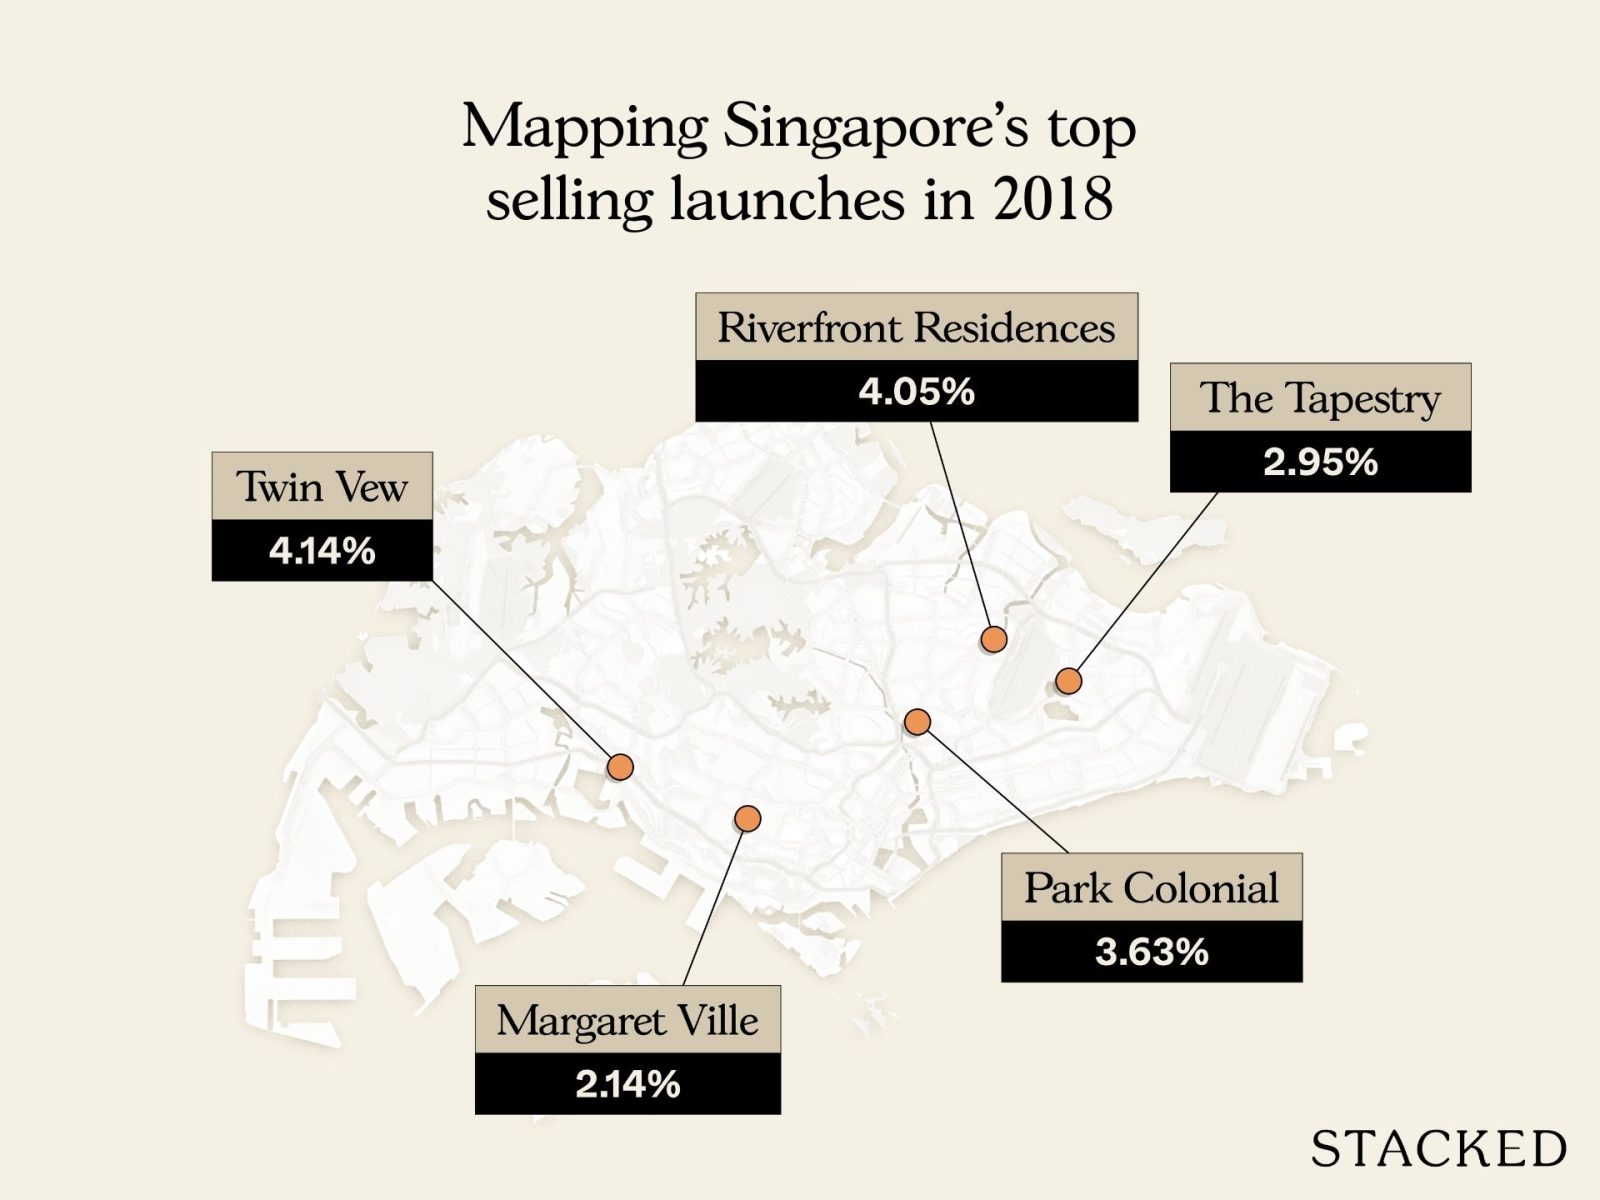
- Twin Vew
- Park Colonial
- The Tapestry
- Riverfront Residences
- Margaret Ville
These were the top five projects, in order of how quickly they moved on their launch weekend:
The challenge for many buyers today isn't access to information.
It's interpreting that information in a way that makes sense for their finances, goals, and stage of life.
Over time, that's also why we decided to work with agents who shared the same data-driven and advisory-led approach behind our editorial, consultants who could help readers think through decisions more objectively, rather than simply push transactions.
Today, the team has worked with more than 2,000 clients across over $5B in property transactions.
1. Twin Vew
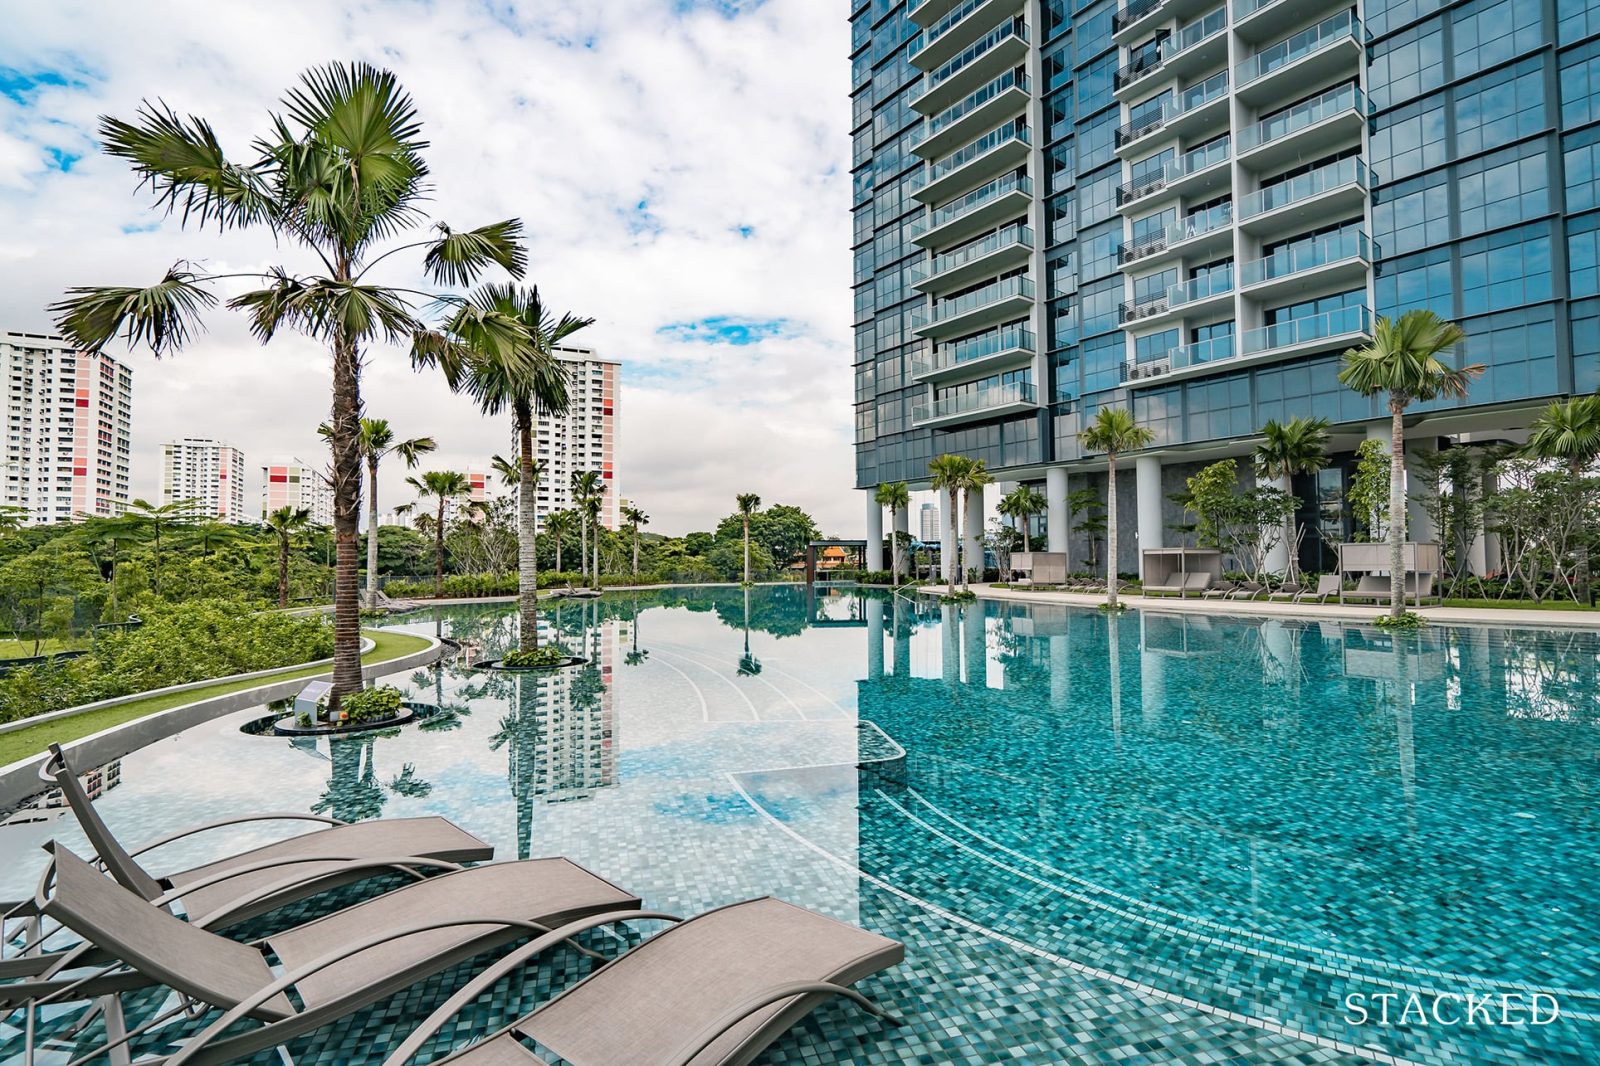
Twin VEW is a 99-year leasehold project with 520 units. It’s located along West Coast Vale in District 5, in a quieter pocket of the West Coast enclave.
Twin VEW launched in May 2018 and was one of the fastest-selling launches of the year: it sold 442 of its 520 units (about 85 per cent) over its launch weekend. Pricing more than location may have been the appeal: because West Coast Vale is not as developed as, say, Clementi, launch pricing averaged around $1,400 psf. At the time, three-bedroom units from $1.4 million were an easy reach for most HDB upgraders (around $1.6 million was considered affordable at the time).
It was also believed that the one-bedders, which were only around $650,000 (due to being a very compact 484 sq ft.), would find ready tenants from nearby business parks or Jurong. That’s probably not a sentiment that’s as widely shared today, with competition like LakeGarden Residences, J’Den, etc. having appeared in Jurong in recent years.
The location came with some known trade-offs, such as weaker public transport access. But this was offset with greenery views, a childcare centre, and partial views over the Sungei Pandan.
Here’s how it has fared today:
Overall performance
| Year | Average $PSF |
| 2018 | $1,400 |
| 2019 | $1,476 |
| 2020 | $1,485 |
| 2021 | $1,540 |
| 2022 | $1,625 |
| 2023 | $1,758 |
| 2024 | $1,790 |
| 2025 (up till June) | $1,860 |
| Annualised | 4.14% |
| Year | Average price |
| 2018 | $1,268,645 |
| 2019 | $1,457,143 |
| 2020 | $1,860,125 |
| 2021 | $1,779,759 |
| 2022 | $1,441,342 |
| 2023 | $1,478,722 |
| 2024 | $1,689,118 |
| 2025 (up till June) | $1,873,230 |
| % increase from 2018 to June 2025 | 47.66% |
Performance by bedroom
| Year | 1-bedroom | 2-bedroom | 3-bedroom | 4-bedroom | 5-bedroom |
| 2018 | $1,514 | $1,426 | $1,346 | $1,332 | $1,513 |
| 2019 | $1,509 | $1,440 | $1,482 | ||
| 2020 | $1,491 | $1,479 | |||
| 2021 | $1,692 | $1,554 | $1,548 | $1,514 | $1,556 |
| 2022 | $1,667 | $1,620 | $1,640 | $1,570 | |
| 2023 | $1,748 | $1,759 | $1,757 | $1,774 | |
| 2024 | $1,787 | $1,751 | $1,828 | $1,787 | |
| 2025 (up till June) | $1,780 | $1,897 | $1,918 | ||
| Annualised | - | 3.21% | 5.02% | 5.34% | - |
| Year | 1-bedroom | 2-bedroom | 3-bedroom | 4-bedroom | 5-bedroom |
| 2018 | $798,788 | $1,067,794 | $1,423,439 | $1,856,530 | $3,033,000 |
| 2019 | $1,099,333 | $1,684,000 | $1,850,000 | ||
| 2020 | $1,679,375 | $2,040,875 | |||
| 2021 | $866,233 | $1,179,611 | $1,681,846 | $2,075,400 | $2,998,000 |
| 2022 | $875,000 | $1,201,450 | $1,855,200 | $2,172,500 | |
| 2023 | $906,800 | $1,289,714 | $1,976,667 | $2,375,000 | |
| 2024 | $943,000 | $1,304,750 | $1,977,838 | $2,650,000 | |
| 2025 (up till June) | $1,328,500 | $1,903,381 | $2,559,333 | ||
| % increase from 2018 to June 2025 | - | 24.42% | 33.72% | 37.86% | - |
Profitability
| Number of bedrooms | Gains | Loss | ||
| Average ROI | No. of units | Average ROI | No. of units | |
| 1-bedroom | 18.05% | 14 | ||
| 2-bedroom | 19.00% | 41 | ||
| 3-bedroom | 24.57% | 45 | ||
| 4-bedroom | 26.49% | 21 | ||
| 5-bedroom |
Twin VEW has outperformed most 2018 peers, with the average $PSF rising roughly 4.14 per cent. Across unit types, the three and four-bedroom layouts have been the best performers, posting annualised $PSF growth of around five per cent and quantum gains of roughly 34 to 38 per cent.
Profitability is strong across the board, and recorded transactions for one to four-bedroom units have been profitable. So overall, Twin VEW has seen above-average gains for its launch buyers. It would seem that, despite some initial qualms about a less accessible location, Twin VEW came out ahead anyway, thanks to competitive initial pricing.
2. Park Colonial

Park Colonial is a 99-year leasehold project with 805 units, located on Woodleigh Lane. This is beside Woodleigh MRT (NEL) in District 13.
When Park Colonial launched in June 2018, it got a lot of attention due to said MRT station. Note that just one year earlier, Woodleigh Mall had already been announced (as part of the mixed-use T Woodleigh Residences) - so buyers were aware of this huge upcoming amenity. As an added bonus, Woodleigh is just one stop from Serangoon, where NEX Megamall is located.
So more than 300 units were sold during its 5th July launch weekend; and by an amazing stroke of luck, it dodged the 6th July 2018 cooling measures that came the next day. And cooling measures or not, Park Colonial ended up one of the top-selling RCR projects between July to September 2018.
Park Colonial wasn’t exactly cheap either. As mentioned earlier, $1.6 million was around the sweet spot for HDB upgraders; but Park Colonial’s three-bedders were past this at around $1.66 million. So, given its pricing was on the higher side for its cohort (albeit expected for an RCR location), and the fact that cooling measures fell in the middle of its launch process, the pace of sales was impressive.
Here’s how it fared over time:
Overall performance
| Year | Average $PSF |
| 2018 | $1,748 |
| 2019 | $1,800 |
| 2020 | $1,933 |
| 2021 | $1,940 |
| 2022 | $2,021 |
| 2023 | $2,097 |
| 2024 | $2,237 |
| 2025 (up till June) | $2,244 |
| Annualised | 3.63% |
| Year | Average price |
| 2018 | $1,302,098 |
| 2019 | $1,649,975 |
| 2020 | $1,754,171 |
| 2021 | $1,670,690 |
| 2022 | $1,584,959 |
| 2023 | $1,547,061 |
| 2024 | $1,632,065 |
| 2025 (up till June) | $1,803,856 |
| % increase from 2018 to June 2025 | 38.53% |
Performance by bedroom
| Year | 1-bedroom | 2-bedroom | 3-bedroom | 4-bedroom | 5-bedroom |
| 2018 | $1,790 | $1,789 | $1,665 | $1,655 | $1,731 |
| 2019 | $1,907 | $1,866 | $1,756 | $1,723 | $1,667 |
| 2020 | $2,102 | $2,040 | $1,849 | $1,752 | $1,792 |
| 2021 | $2,078 | $1,991 | $1,884 | $1,884 | $1,730 |
| 2022 | $2,059 | $2,059 | $1,978 | $1,912 | |
| 2023 | $2,119 | $2,084 | $2,155 | $1,957 | $2,115 |
| 2024 | $2,117 | $2,241 | $2,307 | $2,249 | |
| 2025 (up till June) | $2,076 | $2,188 | $2,488 | $2,410 | $2,178 |
| Annualised | 2.14% | 2.92% | 5.91% | 5.52% | 3.34% |
| Year | 1-bedroom | 2-bedroom | 3-bedroom | 4-bedroom | 5-bedroom |
| 2018 | $828,319 | $1,168,504 | $1,666,721 | $2,176,077 | $2,961,750 |
| 2019 | $882,500 | $1,218,953 | $1,776,514 | $2,258,696 | $2,967,250 |
| 2020 | $972,667 | $1,317,570 | $1,844,818 | $2,193,109 | $3,067,006 |
| 2021 | $961,960 | $1,333,999 | $1,911,011 | $2,402,000 | $2,955,403 |
| 2022 | $953,056 | $1,346,144 | $1,996,462 | $2,389,500 | |
| 2023 | $980,597 | $1,394,611 | $2,130,857 | $2,715,000 | $3,620,000 |
| 2024 | $979,852 | $1,423,991 | $2,284,571 | $2,704,444 | |
| 2025 (up till June) | $960,740 | $1,471,000 | $2,544,841 | $3,183,333 | $3,728,000 |
| % increase from 2018 to June 2025 | 15.99% | 25.89% | 52.69% | 46.29% | 25.87% |
Profitability
| Number of bedrooms | Gains | Loss | ||
| Average ROI | No. of units | Average ROI | No. of units | |
| 1-bedroom | 16.63% | 33 | ||
| 2-bedroom | 18.83% | 88 | ||
| 3-bedroom | 29.41% | 42 | ||
| 4-bedroom | 27.18% | 11 | -8.45% | 1 |
| 5-bedroom | 23.22% | 2 |
Despite competition from the later Woodleigh Residences, Park Colonial continues to deliver strong performance: the average $PSF has been rising by about 3.63 per cent annually.
Unsurprising for its family-oriented location, the three-bedroom units were the standout performers, with annualised $PSF growth of about 5.91 per cent. The four-bedroom units also did well, posting around 5.52 per cent annualised $PSF growth.
Frankly, it’s hard for Park Colonial to go wrong, given the high demand for its Woodleigh-Bidadari location. The buyers knew that at launch, and the predictions have panned out as expected.
3. The Tapestry
The Tapestry is a 99-year leasehold project with 861 units. It’s located at 59 Tampines Street in District 18.
CDL began previews of the Tapestry in March 2018, with the official launch taking place on 24 March 2018. At its launch weekend, CDL released 450 units and sold 315 by the end of the weekend (about 75 per cent sold).
What’s interesting is that the response was so strong, despite being in one of the weaker locations in Tampines: The Tapestry is closer to the Tampines West area, which is close to the boundary of Bedok Reservoir. Nonetheless, buyers seemed to be drawn by pricing; in particular, three-bedders that were $1.345 million were eminently affordable.
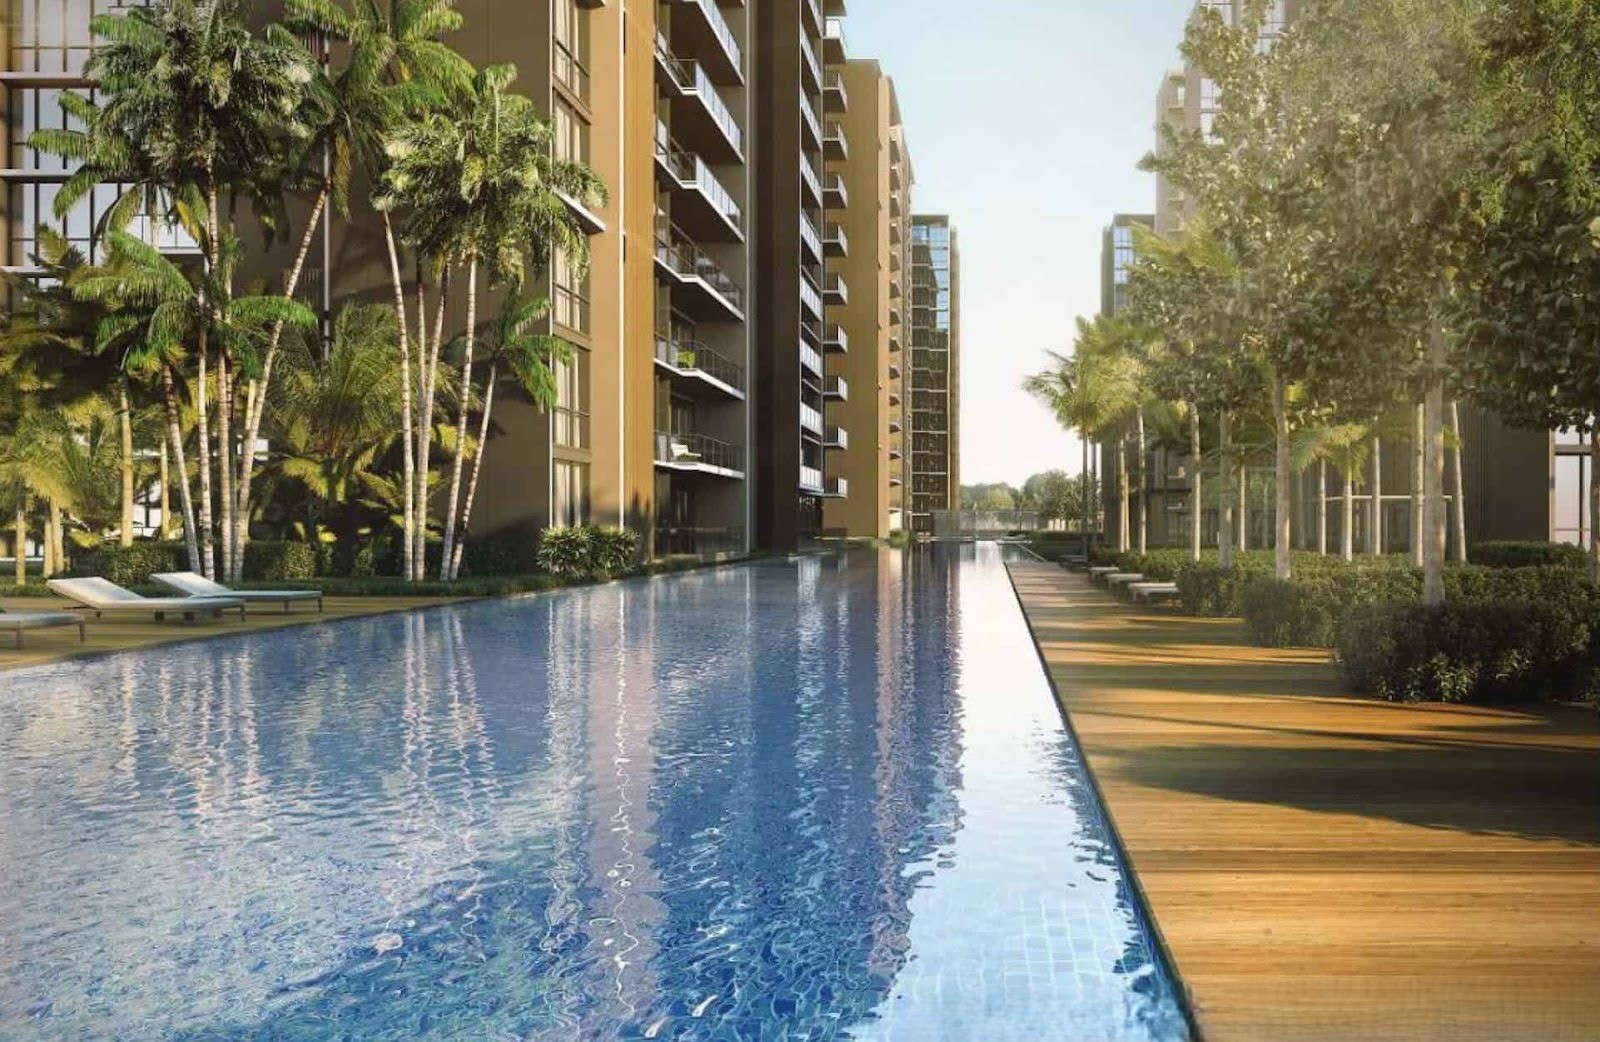
The facilities were also unusual for a mass-market project at the time: The Tapestry even has a 100-metre infinity pool and a “residential services team” (a concierge service). These are usually found in higher-end luxury condos, so it was quite an attention-grabber.
Here’s how it has performed over the years:
Overall performance
| Year | Average $PSF |
| 2018 | $1,384 |
| 2019 | $1,336 |
| 2020 | $1,376 |
| 2021 | $1,490 |
| 2022 | $1,578 |
| 2023 | $1,646 |
| 2024 | $1,680 |
| 2025 (up till June) | $1,697 |
| Annualised | 2.95% |
| Year | Average price |
| 2018 | $951,574 |
| 2019 | $1,172,120 |
| 2020 | $1,094,730 |
| 2021 | $1,241,476 |
| 2022 | $1,069,821 |
| 2023 | $1,068,870 |
| 2024 | $1,271,620 |
| 2025 (up till June) | $1,219,743 |
| % increase from 2018 to June 2025 | 28.18% |
Performance by bedroom
| Year | 1-bedroom | 2-bedroom | 3-bedroom | 4-bedroom | 5-bedroom |
| 2018 | $1,454 | $1,398 | $1,278 | $1,192 | $1,222 |
| 2019 | $1,508 | $1,430 | $1,270 | $1,197 | $1,268 |
| 2020 | $1,559 | $1,409 | $1,295 | $1,165 | $1,259 |
| 2021 | $1,555 | $1,554 | $1,457 | $1,331 | |
| 2022 | $1,621 | $1,577 | $1,566 | $1,442 | |
| 2023 | $1,663 | $1,657 | $1,598 | $1,579 | |
| 2024 | $1,721 | $1,667 | $1,652 | $1,694 | $1,661 |
| 2025 (up till June) | $1,697 | $1,710 | $1,683 | ||
| Annualised | 2.23% | 2.93% | 4.01% | - | - |
| Year | 1-bedroom | 2-bedroom | 3-bedroom | 4-bedroom | 5-bedroom |
| 2018 | $670,078 | $901,695 | $1,345,966 | $1,729,721 | $2,223,897 |
| 2019 | $671,745 | $873,878 | $1,336,541 | $1,785,813 | $2,237,780 |
| 2020 | $695,170 | $887,659 | $1,288,129 | $1,730,970 | $2,222,774 |
| 2021 | $719,481 | $1,033,611 | $1,478,950 | $1,965,250 | |
| 2022 | $751,589 | $1,041,111 | $1,450,000 | $2,090,000 | |
| 2023 | $765,329 | $1,085,684 | $1,589,333 | $2,260,000 | |
| 2024 | $782,329 | $1,055,796 | $1,706,773 | $2,493,472 | $2,932,500 |
| 2025 (up till June) | $774,659 | $1,040,021 | $1,816,731 | ||
| % increase from 2018 to June 2025 | 15.61% | 15.34% | 34.98% | - | - |
Profitability
| Number of bedrooms | Gains | Loss | ||
| Average ROI | No. of units | Average ROI | No. of units | |
| 1-bedroom | 12.98% | 78 | ||
| 2-bedroom | 16.41% | 76 | -8.11% | 1 |
| 3-bedroom | 27.29% | 55 | ||
| 4-bedroom | 26.51% | 13 | ||
| 5-bedroom | 30.53% | 2 |
Appreciation for The Tapestry has been okay. Not exceptional at 2.95 per cent per annum, but still profitable. The three-bedroom units have been the standout performers in this project, achieving around four per cent annualised $PSF growth and close to 35 per cent quantum gains.
The smaller units have seen a more modest performance, with $PSF gains at 2.23 per cent per year for one-bedders and 2.93 per cent for two-bedders. Overall, this resulted in just around 15 to 16 per cent quantum gains.
Only one of the two-bedders registered a loss, but a single transaction can be considered an outlier.
Overall, it’s been reasonably profitable, though not really a front-runner.
4. Riverfront Residences
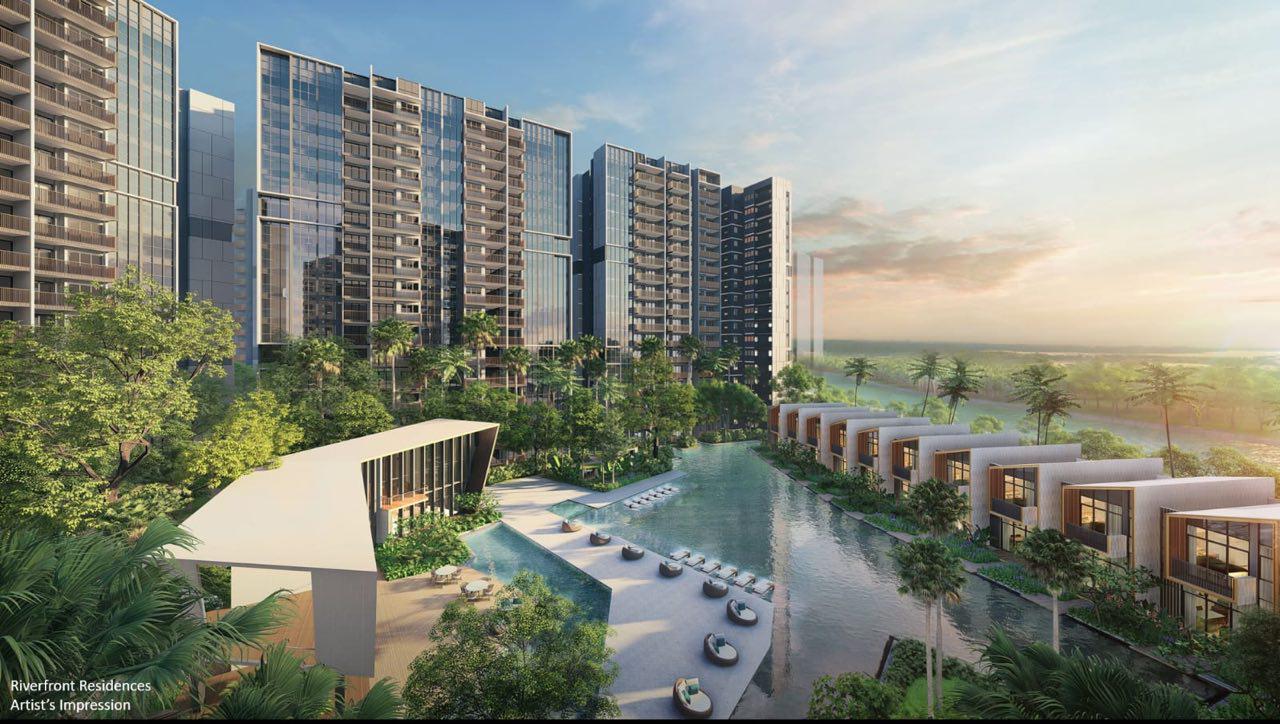
Riverfront Residences is a 99-year leasehold mega-development with 1,472 units, along Hougang Avenue 7 in District 19. This project had a very exciting launch incident.
Riverfront was one of the biggest OCR launches in 2018, as you can see from the mega-development status. This project came about from an en-bloc sale of the former Rio Casa; and because the developer secured the land just before land prices started to rise later in the year.
For this reason, plus the high unit count, the developer had leeway to price very aggressively. As you can see below, a three-bedder was just around $1.3 million, and a four-bedder came in at just under $2 million.
Also, more than 70 per cent of the units had either a full or partial river view, which made it seem like even more of a bargain for the price.
During the launch, the developer had moved the sales of Riverfront forward to 5th July 2018; coincidentally, hours before the latest ABSD and LTV cooling measures were announced. Just as we saw with Park Colonial, buyers who secured an Option to Purchase (OTP) before midnight could still qualify for the lower ABSD rates, thus creating a surge of demand, and that surge was significant given the sheer number of units this condo has.
Thanks to this surge, Riverfront Residences had sold more than half its 1,472 units in the first month alone, propelling it to the top-selling launch of 2018. This also defied many predictions that the developer would struggle to move so many units before the ABSD deadline.
Here’s how the project has fared to date:
Overall performance
| Year | Average $PSF |
| 2018 | $1,313 |
| 2019 | $1,324 |
| 2020 | $1,350 |
| 2021 | $1,353 |
| 2022 | $1,496 |
| 2023 | $1,635 |
| 2024 | $1,667 |
| 2025 (up till June) | $1,733 |
| Annualised | 4.05% |
| Year | Average price |
| 2018 | $910,988 |
| 2019 | $1,056,128 |
| 2020 | $1,095,593 |
| 2021 | $1,458,376 |
| 2022 | $1,049,750 |
| 2023 | $1,227,814 |
| 2024 | $1,286,633 |
| 2025 (up till June) | $1,426,496 |
| % increase from 2018 to June 2025 | 56.59% |
| Performance by bedroom | |||||
| Year | 1-bedroom | 2-bedroom | 3-bedroom | 4-bedroom | 5-bedroom |
| 2018 | $1,338 | $1,310 | $1,282 | $1,284 | $1,229 |
| 2019 | $1,373 | $1,314 | $1,292 | $1,296 | $1,278 |
| 2020 | $1,387 | $1,341 | $1,326 | $1,336 | $1,261 |
| 2021 | $1,461 | $1,423 | $1,362 | $1,351 | $1,303 |
| 2022 | $1,532 | $1,490 | $1,506 | $1,394 | |
| 2023 | $1,611 | $1,630 | $1,648 | $1,772 | $1,683 |
| 2024 | $1,624 | $1,665 | $1,711 | $1,635 | $1,679 |
| 2025 (up till June) | $1,644 | $1,765 | $1,767 | $1,815 | $1,805 |
| Annualised | 2.98% | 4.36% | 4.69% | 5.07% | 5.64% |
| Year | 1-bedroom | 2-bedroom | 3-bedroom | 4-bedroom | 5-bedroom |
| 2018 | $645,120 | $854,088 | $1,305,441 | $1,920,250 | $2,109,500 |
| 2019 | $673,800 | $902,439 | $1,303,593 | $1,891,133 | $2,146,125 |
| 2020 | $724,362 | $935,417 | $1,306,311 | $1,943,300 | $2,117,050 |
| 2021 | $688,115 | $945,443 | $1,295,487 | $1,971,102 | $2,188,112 |
| 2022 | $733,491 | $982,730 | $1,463,857 | $2,001,911 | |
| 2023 | $791,523 | $1,088,122 | $1,639,156 | $2,582,500 | $2,826,444 |
| 2024 | $809,684 | $1,060,654 | $1,709,256 | $2,305,000 | $2,820,000 |
| 2025 (up till June) | $810,536 | $1,151,891 | $1,743,600 | $2,653,333 | $3,030,000 |
| % increase from 2018 to June 2025 | 25.64% | 34.87% | 33.56% | 38.18% | 43.64% |
Profitability
| Number of bedrooms | Gains | Loss | ||
| Average ROI | No. of units | Average ROI | No. of units | |
| 1-bedroom | 17.29% | 169 | ||
| 2-bedroom | 22.10% | 146 | ||
| 3-bedroom | 28.38% | 110 | ||
| 4-bedroom | 31.84% | 16 | ||
| 5-bedroom | 38.09% | 5 |
Percentage gains have been high for Riverfront for no reason other than the competitive entry price. $PSF has risen by just over four per cent per annum, outpacing many 2018 launches.
The larger units have been the strongest performers, with the four and five-bedroom layouts seeing annualised $PSF growth of about five to 5.6 per cent, and quantum gains of roughly 38 to 44 per cent.
One-bedder units have seen the weakest pace, with $PSF rising only 2.98 per cent per annum; but it’s not unusual for one-bedders to see weaker gains, given the niche demand (they’re too small for family buyers).
Overall, this project has fared well for its earliest buyers, who really were very lucky. They secured a unit that benefited from a period of lower land prices, and managed to avoid a tighter LTV.
5. Margaret Ville
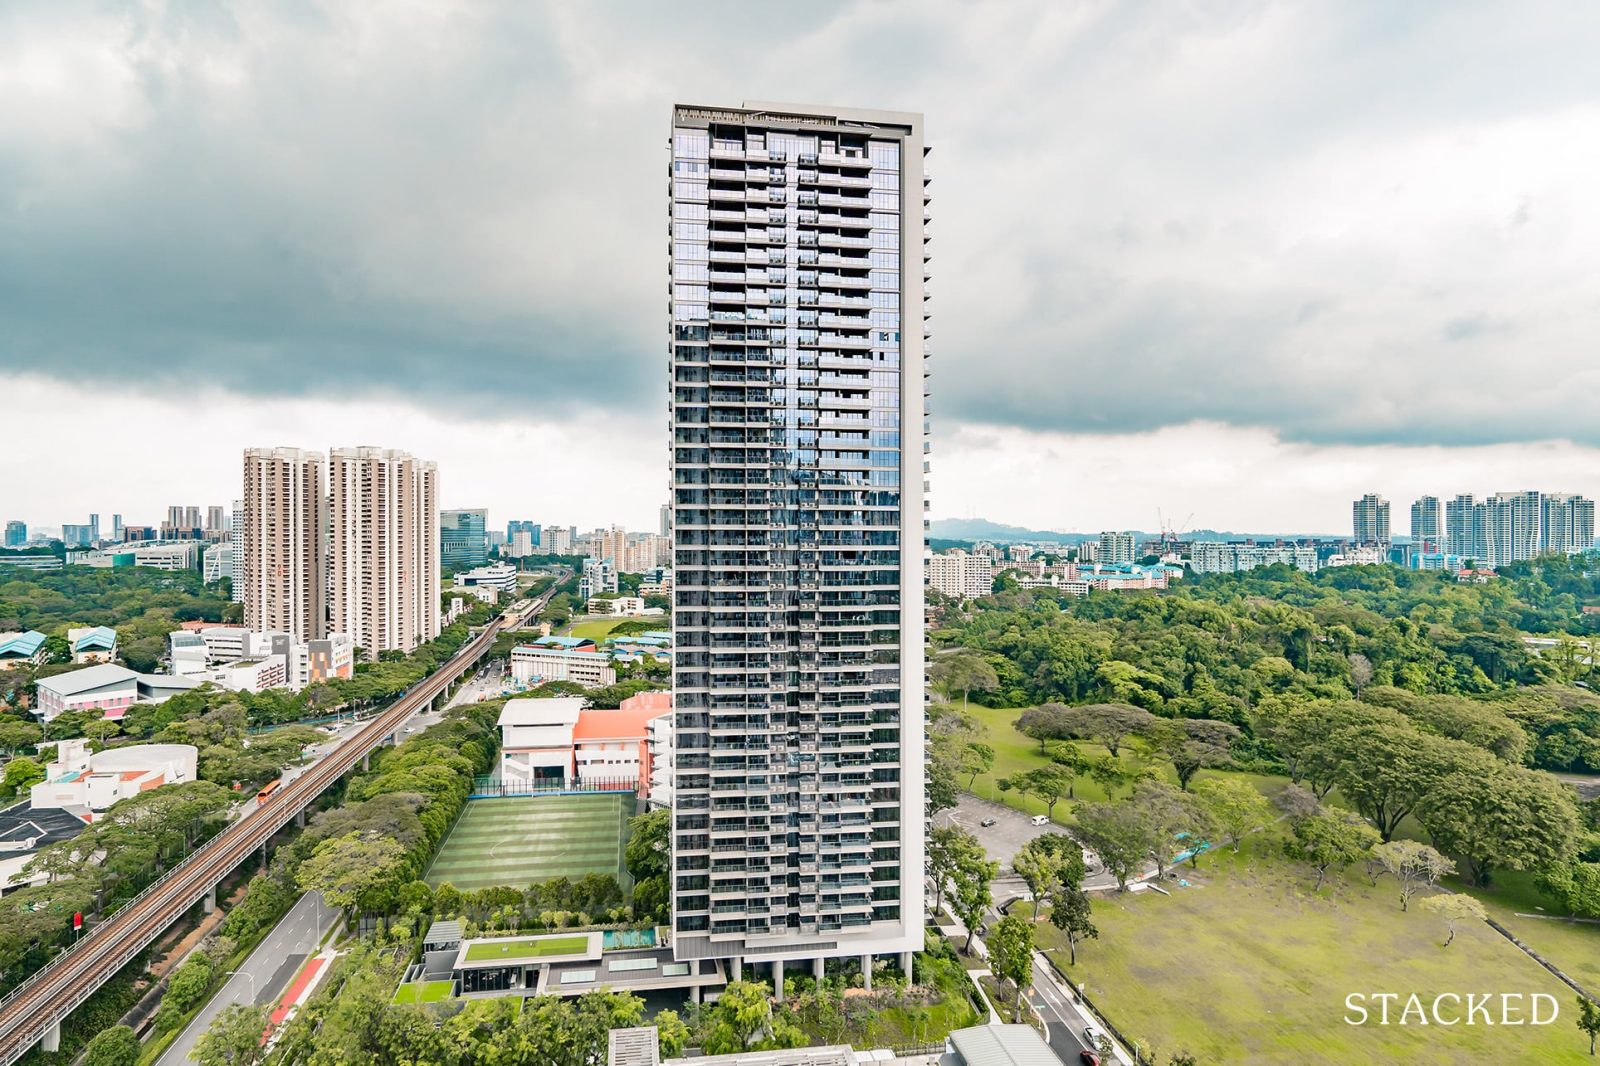
Margaret Ville is a small, 99-year leasehold project with 309 units, located along Margaret Drive in District 3.
When Margaret Ville launched in June 2018, it was on the expensive side for its launch cohort. At about $1,881 psf, a three-bedder here reached about $1.7 million, while even a two-bedder came close to $1.3 million. As you can see from the other tables here, this was pricier than the other fast movers.
In light of this, the project moving about 42 per cent of its units (around 130 sales) at launch can be considered good. We also need to consider that at the time, the cheaper Stirling Residences was providing competition. If Margaret Ville had better MRT access, it would likely have moved quicker.
Here’s how Margaret Ville has performed since launch:
Overall performance
| Year | Average $PSF |
| 2018 | $1,881 |
| 2019 | $1,840 |
| 2020 | $1,842 |
| 2021 | $1,921 |
| 2022 | $2,003 |
| 2023 | $2,180 |
| 2024 | $2,161 |
| 2025 (up till June) | $2,182 |
| Annualised | 2.14% |
| Year | Average price |
| 2018 | $1,261,874 |
| 2019 | $1,503,784 |
| 2020 | $1,839,167 |
| 2021 | $1,440,198 |
| 2022 | $1,589,829 |
| 2023 | $1,719,339 |
| 2024 | $1,807,078 |
| 2025 (up till June) | $1,823,481 |
| % increase from 2018 to June 2025 | 44.51% |
Performance by bedroom
| Year | 1-bedroom | 2-bedroom | 3-bedroom | 4-bedroom |
| 2018 | $1,963 | $1,844 | $1,805 | $1,864 |
| 2019 | $2,044 | $1,823 | $1,780 | $1,788 |
| 2020 | $2,155 | $1,984 | $1,755 | |
| 2021 | $1,988 | $1,839 | $1,937 | |
| 2022 | $2,021 | $1,978 | ||
| 2023 | $2,253 | $2,171 | $2,107 | $2,158 |
| 2024 | $2,145 | $2,184 | $2,135 | $2,167 |
| 2025 (up till June) | $2,135 | $2,127 | $2,253 | $2,200 |
| Annualised | 1.20% | 2.06% | 3.22% | 2.40% |
| Year | 1-bedroom | 2-bedroom | 3-bedroom | 4-bedroom |
| 2018 | $980,402 | $1,294,939 | $1,706,228 | $2,206,267 |
| 2019 | $1,012,675 | $1,389,023 | $1,674,898 | $2,103,970 |
| 2020 | $1,020,395 | $1,302,840 | $2,078,579 | |
| 2021 | $920,000 | $1,524,194 | $1,876,400 | |
| 2022 | $1,371,500 | $1,880,933 | ||
| 2023 | $1,089,815 | $1,597,815 | $2,010,750 | $2,554,500 |
| 2024 | $1,131,296 | $1,636,486 | $1,992,815 | $2,566,296 |
| 2025 (up till June) | $1,054,000 | $1,489,222 | $2,152,000 | $2,604,444 |
| % increase from 2018 to June 2025 | 7.51% | 15.00% | 26.13% | 18.05% |
Profitability
| Number of bedrooms | Gains | Loss | ||
| Average ROI | No. of units | Average ROI | No. of units | |
| 1-bedroom | 10.30% | 12 | ||
| 2-bedroom | 18.02% | 22 | ||
| 3-bedroom | 22.07% | 17 | ||
| 4-bedroom | 20.76% | 9 |
Appreciation for Margaret Ville has been okay, but not amazing. Its $PSF growth of just over two per cent puts it behind many of the launches on this list, but as with most smaller and pricier condos, percentage gains tend to be lower.
The three-bedroom units have been the strongest performers, with annualised $PSF growth of roughly 3.22 per cent. The other unit types, however, have seen fairly modest results (around the two per cent range).
The performance is typical of a boutique RCR project; but there is a chance this may improve going forward, now that the nearby Dawson area is picking up a bit, and especially as Alexandra Central Mall is overcoming its slow start.
For more on the Singapore property market, or deep dives into new and resale projects alike, follow us on Stacked so we can keep you updated.
At Stacked, we like to look beyond the headlines and surface-level numbers, and focus on how things play out in the real world.
If you'd like to discuss how this applies to your own circumstances, you can reach out for a one-to-one consultation here.
And if you simply have a question or want to share a thought, feel free to write to us at stories@stackedhomes.com. We read every message.





0 Comments