Why Your Property May Not Be As Profitable As You Think: 5 Ways To Calculate Your Returns
Get The Property Insights Serious Buyers Read First: Join 50,000+ readers who rely on our weekly breakdowns of Singapore’s property market.
A seasoned content strategist with over 17 years in the real estate and financial journalism sectors, Ryan has built a reputation for transforming complex industry jargon into accessible knowledge. With a track record of writing and editing for leading financial platforms and publications, Ryan's expertise has been recognised across various media outlets. His role as a former content editor for 99.co and a co-host for CNA 938's Open House programme underscores his commitment to providing valuable insights into the property market.
Many of us are aware that property goals differ between buyers, and that owner-occupiers have different requirements from investors. But even among investors, the goals for a property can differ significantly. One of these is the various metrics investors use to calculate their returns. Even if money is not the bottom line for you, these methods can provide an interesting new way to view your unit:
1. Rental Yield
This is one of the most widely recognised metrics, and it’s used by landlords. A high rental yield means stronger cash flow, and quicker returns on your investment. This is also a very simple metric that helps to compare rental performance across different property types, such as a condominium versus an HDB flat.
Formula:
- Gross Rental Yield: (Annual Rental Income / Property Purchase Price) × 100%
- Net Rental Yield: (Annual Rental Income – Expenses) / Property Purchase Price × 100%
Example: A condominium is purchased for $1,000,000 and generates an annual rental income of S$36,000.
- Gross Rental Yield = ($36,000 / $1,000,000) × 100% = 3.6% If annual expenses (maintenance, taxes, etc.) amount to $6,000:
- Net Rental Yield = ($36,000 – $6,000) / $1,000,000 × 100% = 3%
Note that net rental yield has become much lower than gross rental yield due to recent tax changes. Property tax rates for non-owner-occupied residential properties increased in 2024, as part of a two-step revision announced in Budget 2022. As of today, the rates for non-owner occupied properties are from 12 – 36% based on Annual Value, up from 11 – 27% in 2023.
Limitations:
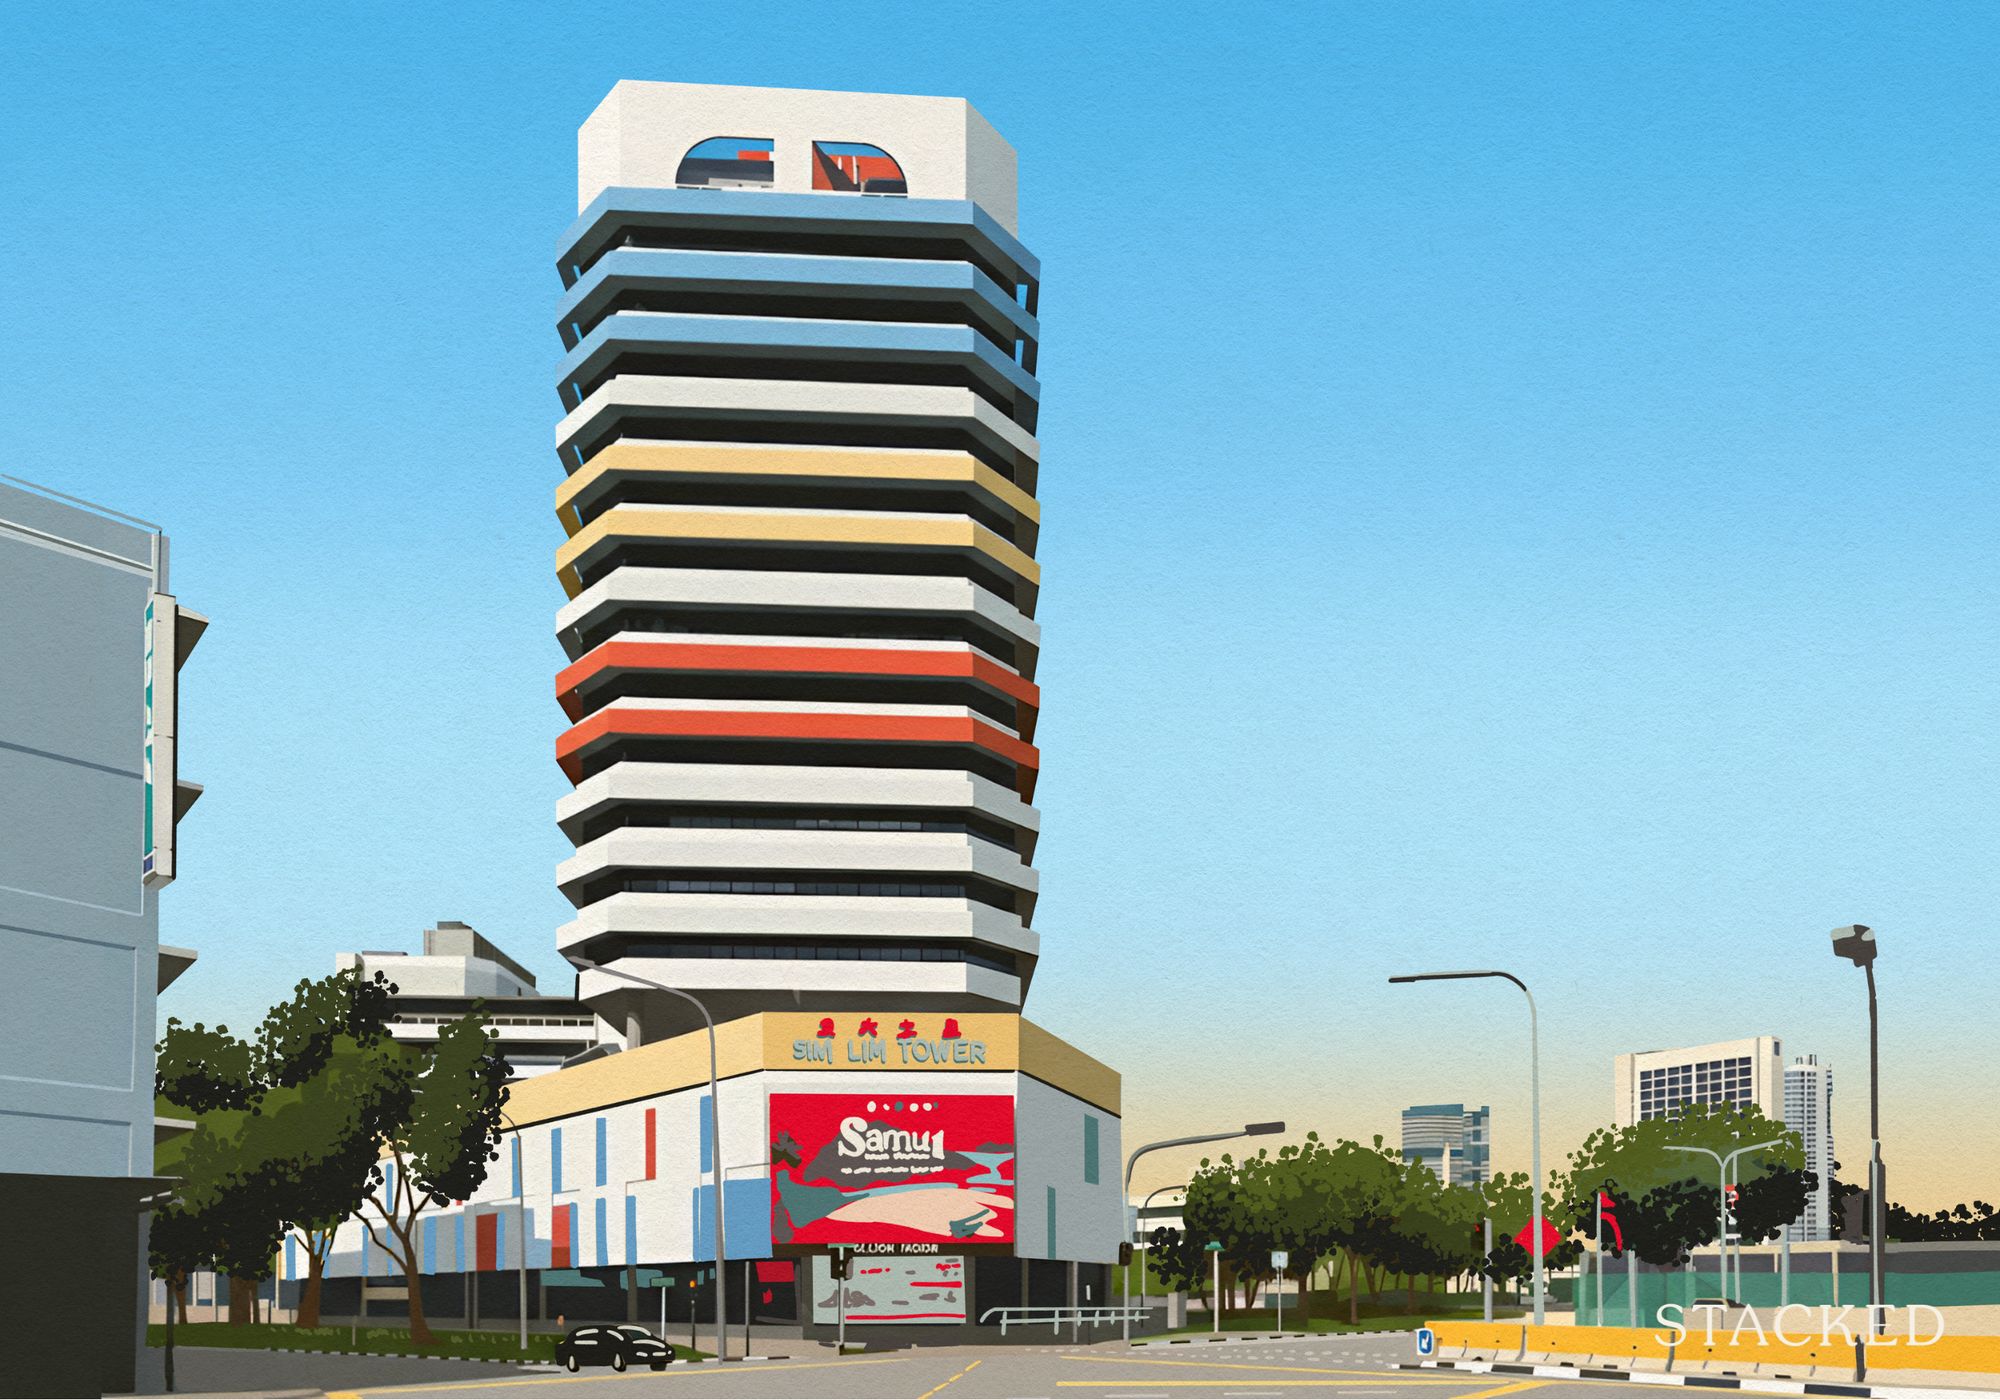
Rental yield doesn’t take into account the appreciation of your property. It is possible for a property to have a very high rental yield but mostly stagnant appreciation, such as an older and cheaper leasehold property. People’s Park Complex is a prime example of this, as it’s an ageing leasehold property that happens to be in a highly central location.
One-bedder condo units (shoeboxes) also tend to have higher rental yields on account of their low quantum; but these units can be tougher to sell, and show weaker resale gains.
2. Debt-Service Coverage Ratio (DSCR)
This metric is used by landlords, but it tends to be discussed in relation to commercial properties, or in higher-risk residential properties (e.g., properties close to or within vice areas, like parts of Geylang).
The DSCR is used to evaluate if a property is self-sustaining (i.e., the rental income generated can cover part or all of the loan repayments).
Formula: DSCR = Net Operating Income / Total Debt Service
Example: A property generates an annual net operating income of $50,000, while its total debt service (mortgage payments, interest, and other loan obligations) amounts to $40,000.
- DSCR = S$50,000 / S$40,000 = 1.25
Since DSCR is greater than 1, this indicates that the property generates sufficient income to cover its debt obligations. If DSCR is below 1, it suggests the property is not generating enough income to fully cover its costs.
This does not mean that a DSCR below 1 is always bad: it’s not uncommon for a rented-out property to cover only the maintenance fees and mortgage interest, whilst not covering the entirety of the repayments.
It does, however, give the investor a sense of the risks or shortfalls involved.
Limitations:
This metric doesn’t reflect on property appreciation, resale gains, yields, etc. It’s usually read in context with other metrics, rather than just on its own.
More from Stacked
How A 944-Unit Mega-Condo In Pasir Ris Ended Up Beating The Market
Coco Palms, a 944-unit condominium in Pasir Ris, has come up as one of the best performing 99-year leasehold condominiums…
3. Cash-on-Cash Return
This metric is discussed more often for commercial than residential properties, but it works just as well for both. Cash-on-Cash return matters when there’s leveraging involved (e.g., the use of your home loan to purchase the property).
This metric focuses purely on your cash flow, relative to the amount of cash you’ve invested. That is, it’s an indicator of how efficiently your invested cash generates income.
Formula: (Annual Pre-Tax Cash Flow / Total Cash Invested) × 100%
Example: An investor pays $200,000 in down payment, and incurs $50,000 in additional costs. After mortgage payments and expenses, they receive $10,000 in annual cash flow.
Cash-on-Cash Return = ($10,000 / $250,000) × 100% = 4%
Limitations:
Cash-on-Cash return doesn’t provide any reflection of property appreciation, or the subsequent resale gains.
4. Return On Investment (ROI)
This is probably the most widely recognised metric, next to rental yield and CAGR. It’s useful to almost any kind of investor, from buy-and-hold investors and upgraders. ROI measures overall profitability, and is useful for making exit (selling) decisions.
Formula: (Total Profit / Total Investment Cost) × 100%
Example: A property is bought for $1,000,000 and sold for $1,200,000 after five years. The total investment cost, including fees and loan interest, is $1,050,000.
ROI = ($150,000 / $1,050,000) × 100% = 14.3%
Limitations:
ROI provides something of a broad picture, and it doesn’t account for certain details like financing costs. It calculates returns based on total profit without factoring in mortgage interest, or factors like the diminishing purchasing power of money over time. This sometimes makes a property appear more profitable than it actually is.
5. Price Appreciation & Compounded Annual Growth Rate (CAGR)
ROI measures the total percentage return on an investment, but it does not factor in the time taken to achieve that return. That’s where CAGR comes in: it accounts for the time value of money by showing the average annual growth rate, over multiple years.
Formula:
- Capital Growth Rate: (New Price – Purchase Price) / Purchase Price × 100%
- CAGR (Compounded Annual Growth Rate): [(Ending Value / Beginning Value) ^ (1 / Number of Years)] – 1
You don’t need to do this manually. There are a lot of free, online CAGR calculators that will do this for you.
Example: A property increases in value from $1,000,000 to $1,500,000 in 10 years.
- Capital Growth Rate = ($1,500,000 – $1,000,000) / $1,000,000 × 100% = 50%
- CAGR = [($1,500,000 / $1,000,000) ^ (1/10)] – 1 = 4.14% per annum
Limitations:
Changes such as cooling measures, property downturns, etc. can slow or reverse the price growth, making this unpredictable. There can also be cases where a property may have appreciated significantly on paper, but can’t be sold at the theoretical price; this is especially true for luxury or boutique properties, where demand can be more volatile.
At Stacked, we like to look beyond the headlines and surface-level numbers, and focus on how things play out in the real world.
If you’d like to discuss how this applies to your own circumstances, you can reach out for a one-to-one consultation here.
And if you simply have a question or want to share a thought, feel free to write to us at stories@stackedhomes.com — we read every message.
Ryan J. Ong
A seasoned content strategist with over 17 years in the real estate and financial journalism sectors, Ryan has built a reputation for transforming complex industry jargon into accessible knowledge. With a track record of writing and editing for leading financial platforms and publications, Ryan's expertise has been recognised across various media outlets. His role as a former content editor for 99.co and a co-host for CNA 938's Open House programme underscores his commitment to providing valuable insights into the property market.Read next from Editor's Pick

Property Advice I’m 55, Have No Income, And Own A Fully Paid HDB Flat—Can I Still Buy Another One Before Selling?

BTO Reviews February 2026 BTO Launch Review: Ultimate Guide To Choosing The Best Unit
Property Investment Insights Why Buyers in the Same Condo Ended Up With Very Different Results

Singapore Property News Narra Residences Sets a New Price Benchmark for Dairy Farm at $2,180 PSF — and the sales breakdown offers
Latest Posts
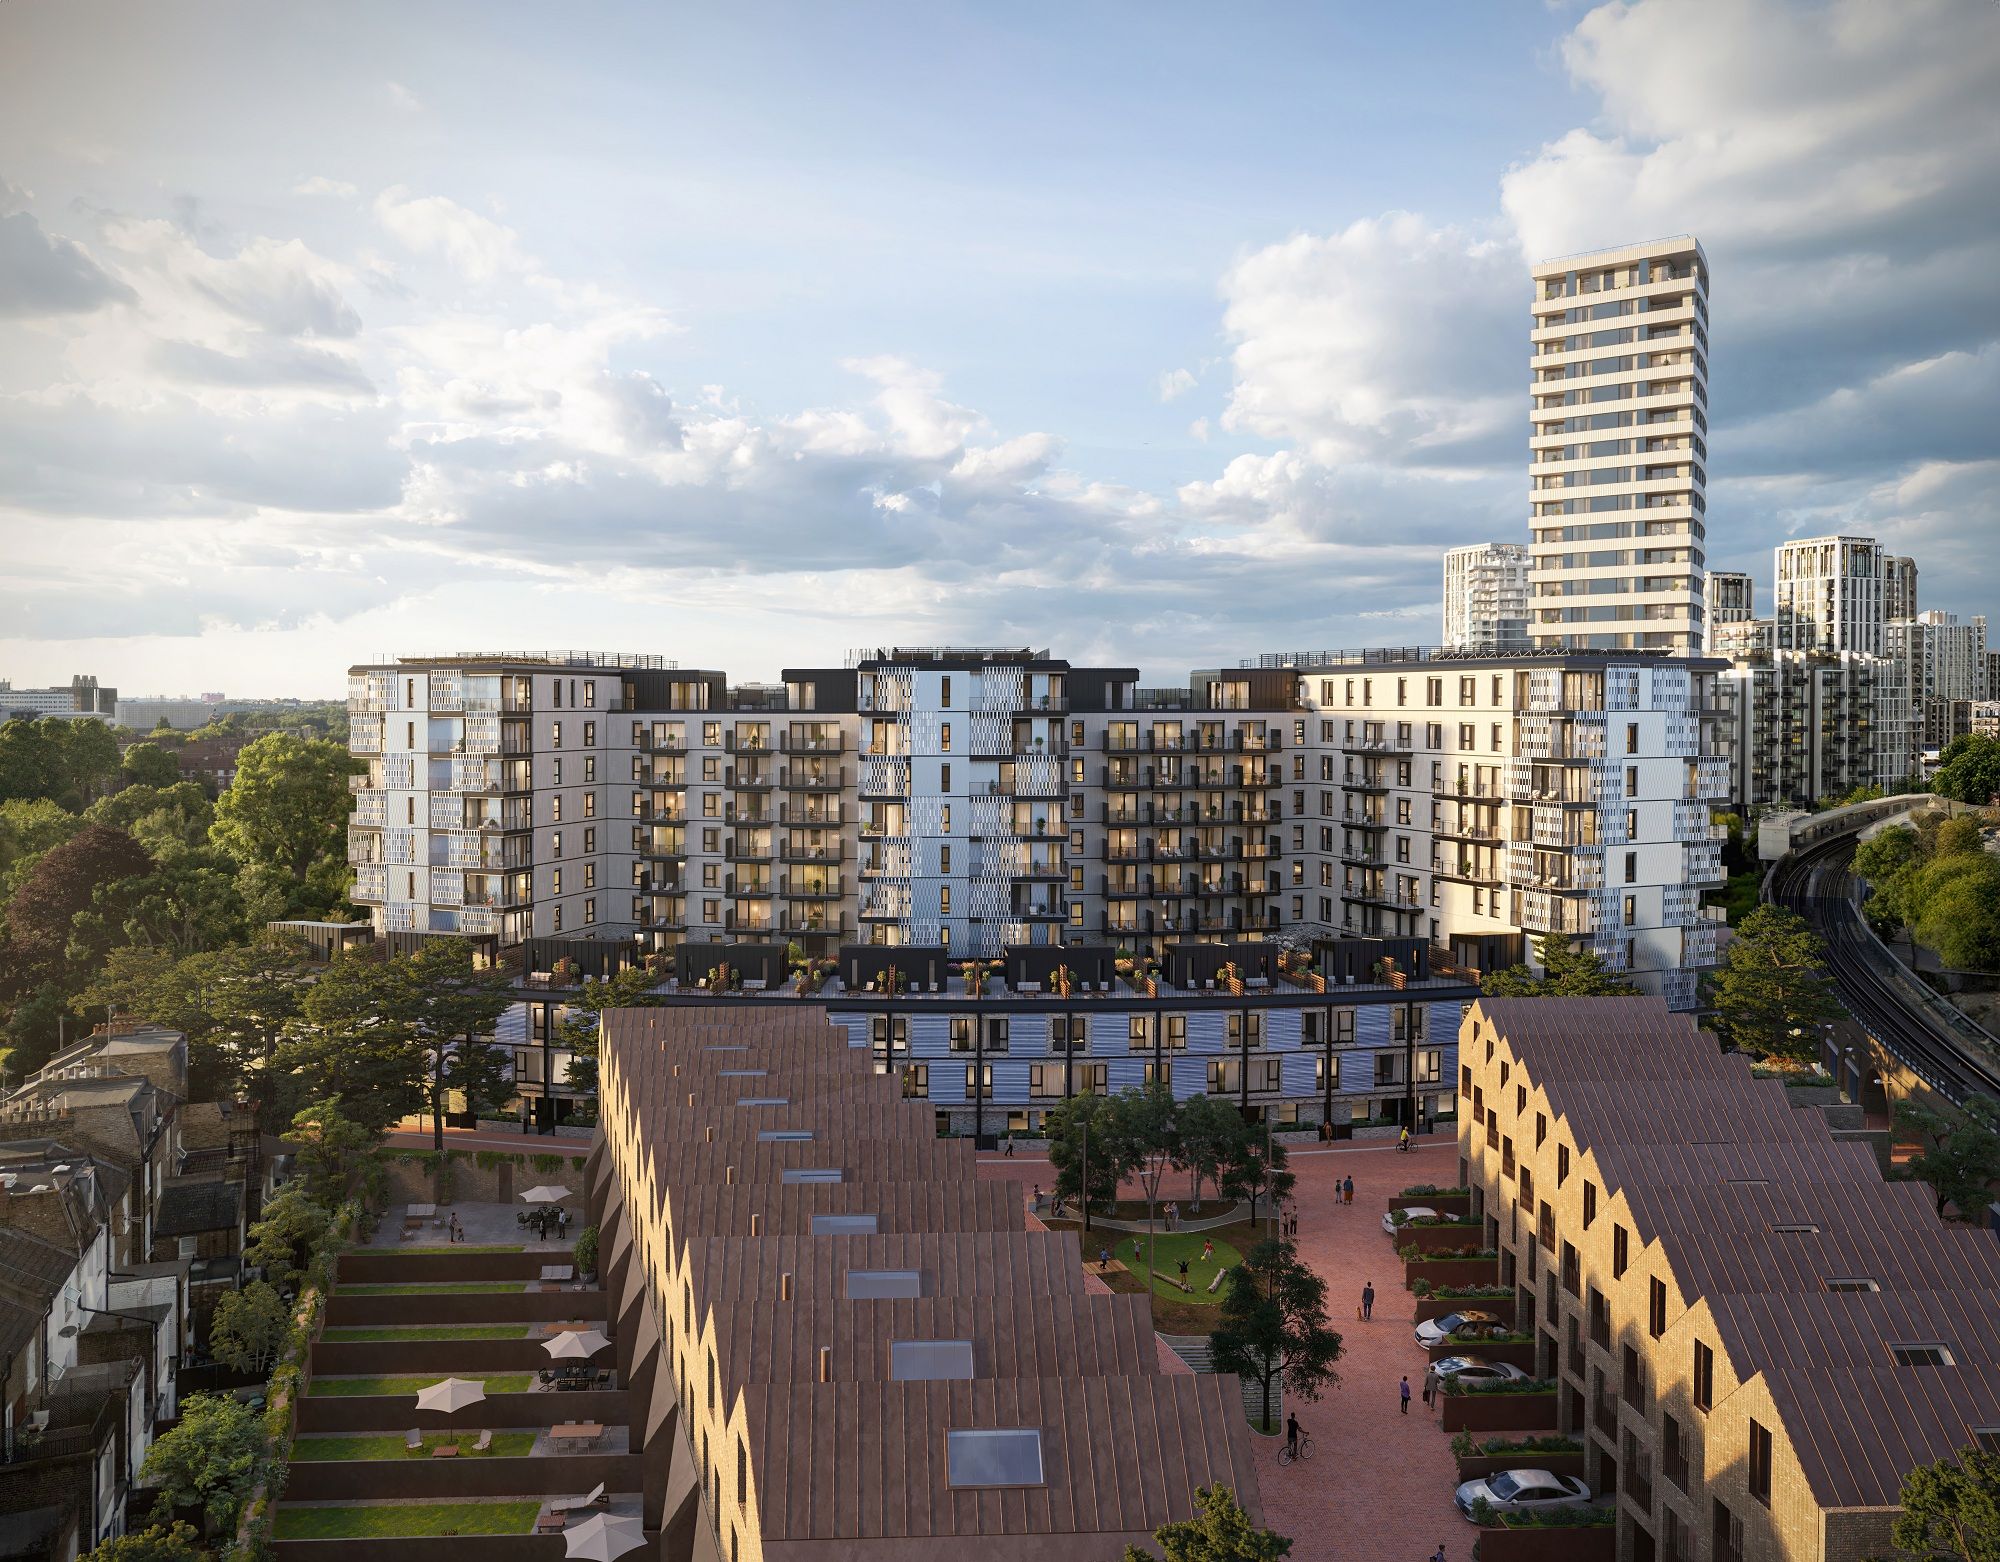
Overseas Property Investing A London Landmark Is Turning Into 975-Year Lease Homes — And The Entry Price May Surprise Singapore Buyers

On The Market Here Are The Biggest HDB Flats You Can Still Buy Above 1,700 Sq Ft In 2026

Pro We Analysed HDB Price Growth — Here’s When Lease Decay Actually Hits (By Estate)

Singapore Property News Tanjong Rhu’s First GLS In 28 Years Just Sold For $709M — Here’s What The Next Condo May Launch At

Singapore Property News Singapore’s CBD Office Rents Have Risen For 7 Straight Quarters — But Who’s Really Driving The Demand?
Singapore Property News 19 Pre-War Bungalows At Adam Park Just Went Up For Tender — But There’s A Catch

Singapore Property News February 2026’s BTO Includes Flats Ready in Under 3 Years — With Big Implications for Buyers
Singapore Property News 1,600 New BTO Flats Are Coming To These Areas For The First Time In Over 40 Years

Property Market Commentary Why Early Buyers In New Housing Estates May See Less Upside In 2026

Singapore Property News Why ‘Accurate’ Property Listings Still Mislead Buyers In Singapore
Singapore Property News Newport Residences Sells 57% at Launch Weekend — But the Real Surprise Came From the Large Units
Property Market Commentary Landed Home Sales Hit a Four-Year High — Here’s What That Could Mean for Prices in 2026
Singapore Property News A Rare Freehold Mall Is Up for Sale At $295 Million: Why the Market Is Paying Attention

On The Market Here Are The Rare HDB Flats With Unblocked Views That Hardly Come Up for Sale

Pro Where HDB Flats Continue to Hold Value Despite Ageing Leases
