Why 3-Bedders May Be The Smarter Investment (Over 2-Bedders) In 2025: Here’s The Breakdown


A seasoned content strategist with over 17 years in the real estate and financial journalism sectors, Ryan has built a reputation for transforming complex industry jargon into accessible knowledge. With a track record of writing and editing for leading financial platforms and publications, Ryan's expertise has been recognised across various media outlets. His role as a former content editor for 99.co and a co-host for CNA 938's Open House programme underscores his commitment to providing valuable insights into the property market.
In this Stacked Pro breakdown:
- We break down which districts saw three-bedders outperform two-bedders in both capital appreciation and rental yield
- Reveal the areas where the price gap between a resale 3-bedder and a new 2-bedder is now under $100K.
- Plus: Where two-bedders are still holding their own — and why the RCR’s pricing trends might surprise you.
Already a subscriber? Log in here.
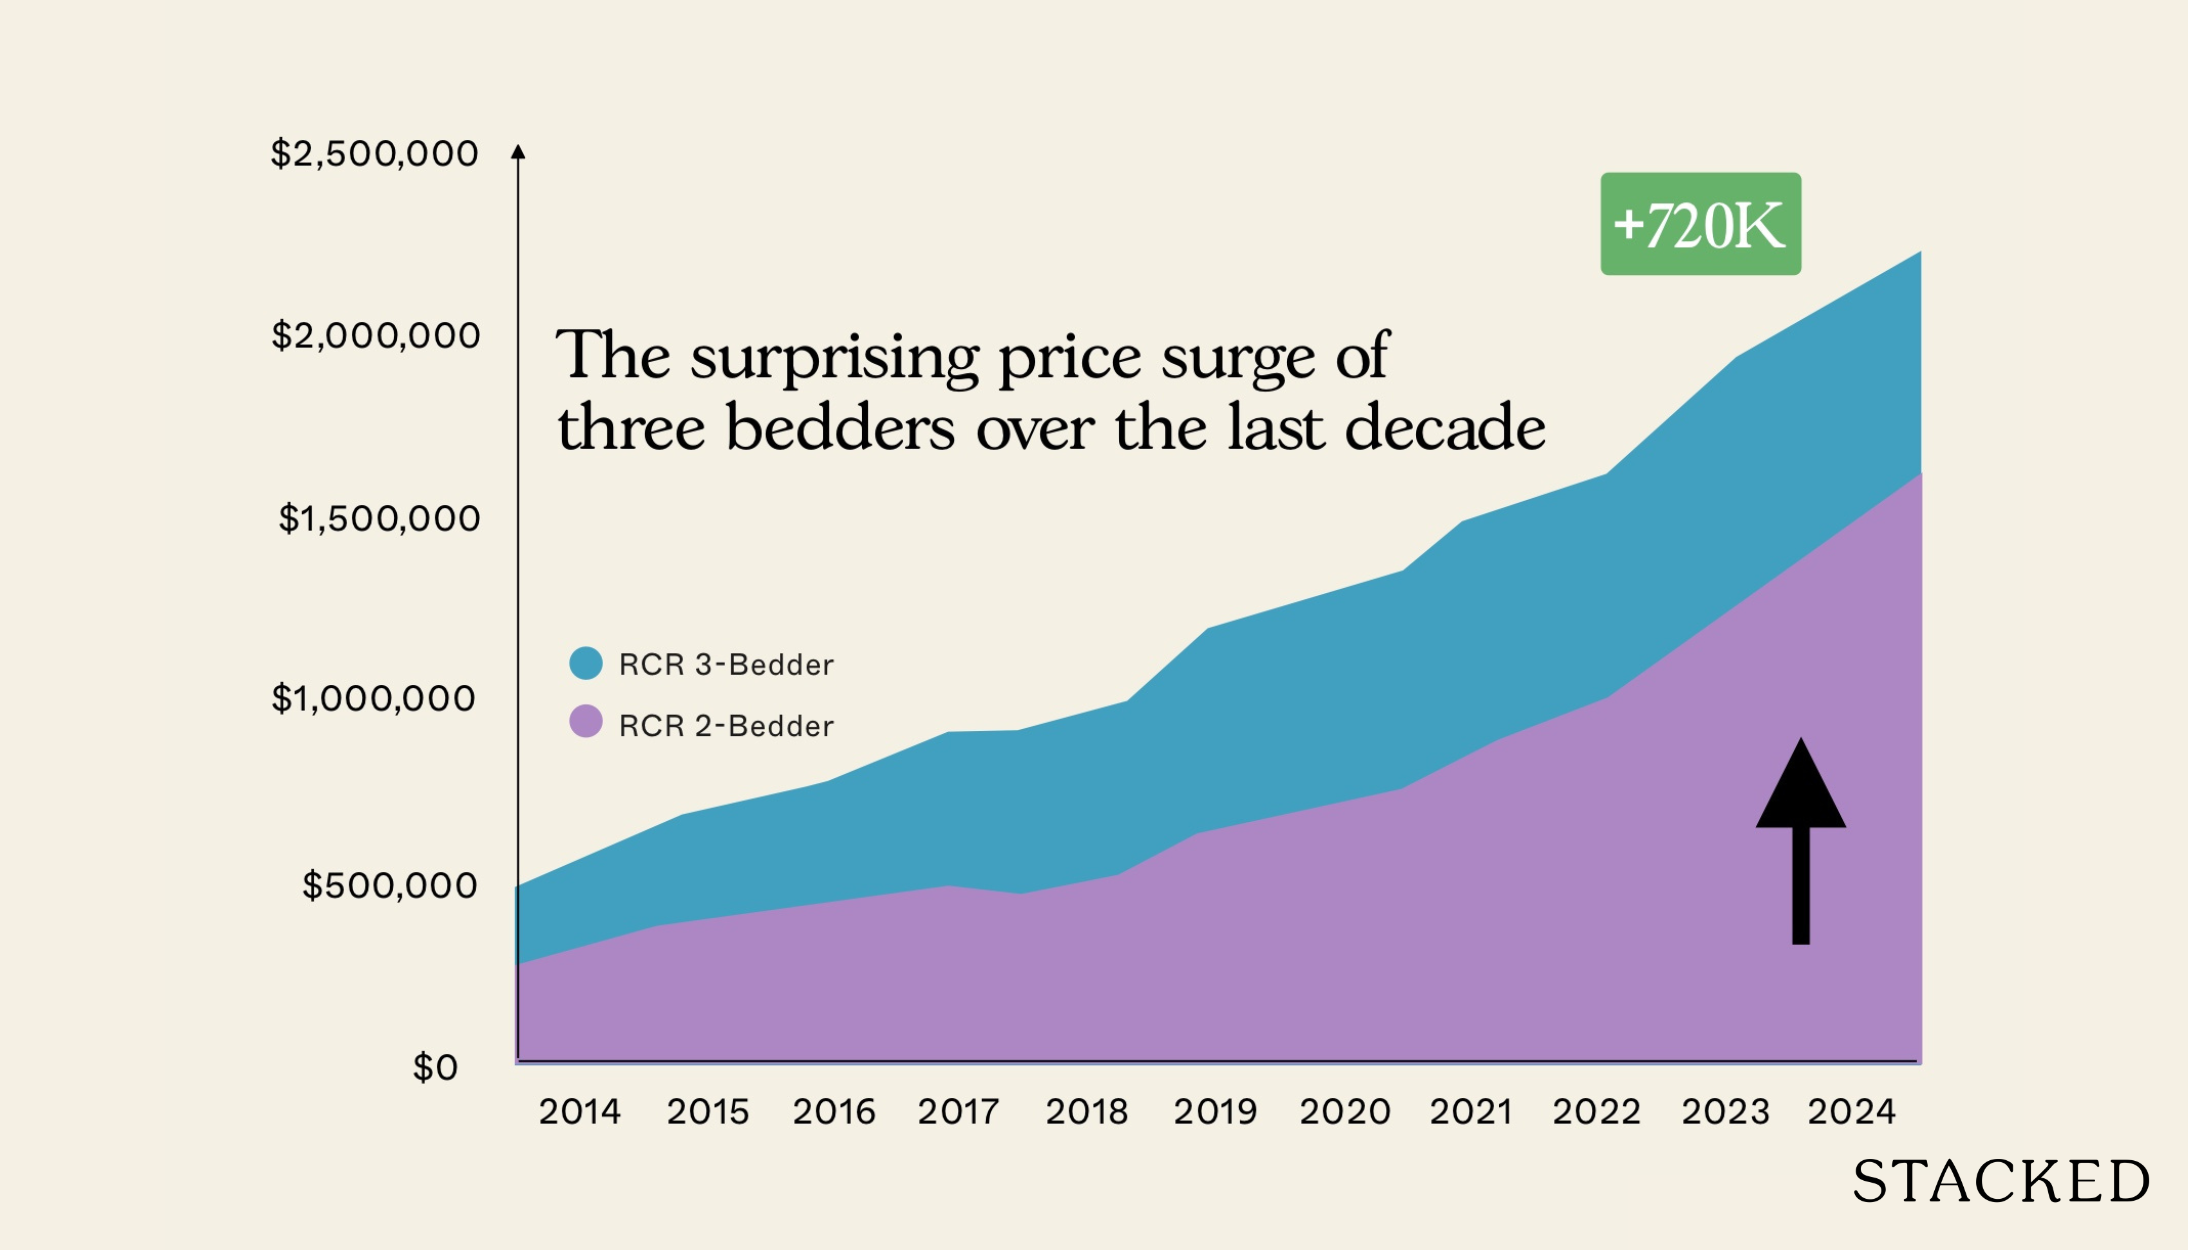
Two-bedders are an increasingly popular choice for buyers, as prices reach new heights. Investors may purchase these units due to a lower capital commitment and a higher potential yield (if they’re renting out), while small families may see them as less of a financial stretch. On the other hand, three-bedders are still regarded by many as being a “true” family-sized unit; and as some realtors may tell you, they’re easy to sell and could fetch stronger resale gains.
The good news is that, in some areas, you might have an option: here are some locations where you can choose between a new launch two-bedder or a resale three-bedder, at roughly the same quantum:
Annualised growth rates of two versus three-bedders
We’ll start by comparing the annualised growth rates of two versus three-bedders across Singapore. For this, we’ll look at the past decade of transactions (2014 to 2024):
District | 2BR | 3BR | Difference |
1 | 1.75% | 2.63% | 0.89% |
2 | 3.08% | 7.06% | 3.98% |
3 | 4.25% | 4.84% | 0.59% |
4 | 1.30% | 1.46% | 0.16% |
5 | 4.04% | 4.08% | 0.05% |
7 | 3.31% | 5.42% | 2.11% |
8 | 2.77% | 3.76% | 0.99% |
9 | 1.66% | 1.49% | -0.17% |
10 | 4.83% | 3.41% | -1.42% |
11 | 2.64% | 3.02% | 0.38% |
12 | 3.51% | 4.03% | 0.52% |
13 | 4.35% | 5.37% | 1.02% |
14 | 5.39% | 5.77% | 0.38% |
15 | 4.03% | 4.11% | 0.08% |
16 | 3.50% | 3.88% | 0.37% |
17 | 3.42% | 3.37% | -0.05% |
18 | 4.06% | 4.87% | 0.80% |
19 | 3.67% | 4.79% | 1.11% |
20 | 6.36% | 4.77% | -1.59% |
21 | 3.76% | 3.80% | 0.04% |
22 | 4.65% | 4.05% | -0.60% |
23 | 4.31% | 4.32% | 0.01% |
25 | 3.03% | 3.80% | 0.77% |
26 | 2.95% | 4.20% | 1.25% |
27 | 4.53% | 5.26% | 0.73% |
28 | 6.06% | 5.72% | -0.34% |

In general, three-bedders outperformed two-bedders. The only districts where two-bedders won were in Districts 9, 10, 17, 20, 22, and 28.
Districts 4, 5, 11, 12, 14, 15, 16, 21, and 23 saw only a minimal difference between the two, with a gap of under 0.5 per cent.
Let’s take a closer look at the situation in the various districts
We’ll look at resale-to-resale transactions: units bought in 2012 and 2013 and resold until 2024. Let’s start with the districts where two-bedders won:

At first glance, we see something that looks like a contradiction. When we isolate districts where two-bedders outperformed and focus on overall gains, the three-bedders actually tend to see higher gains. Why is this?
It’s because three-bedders won less frequently, but when they did, they won by a bigger sum; and that tilts the overall gain in their favour. Take, for example, District 10: two-bedders outperformed three-bedders here, in 2018 and 2021. But the gains were modest (only -1.11 per cent and -1.51 per cent). Meanwhile, the three-bedders’ outperformance in 2016 was far more substantial (+11.46 per cent); plus, they posted consistent positive margins in later years.
Next, let’s look at the districts where the performance was mostly tied:

While the year-by-year performance appears balanced, the overall gains still skew in favour of three-bedders. This is again due to occasional “breakout years” where three-bedders outpace two-bedders by a wide margin. Take District 11 in 2020, for example: There’s a 12.17 per cent gain for three-bedders, which is a substantial single-year gain; there isn’t a single year performance by two-bedders that matches this.
Next, let’s look at new versus resale prices.
We’ll look at the price gap between the different market segments, before we go into the districts that we’re looking at:
CCR | Difference between resale 3BR and new 2BR | Difference between resale 3BR and resale 2BR | Difference between new 3BR and new 2BR |
2014 | $826,384 | $797,318 | $1,293,576 |
2015 | $983,987 | $806,580 | $1,349,439 |
2016 | $1,008,165 | $1,069,782 | $1,125,267 |
2017 | $1,186,388 | $1,049,437 | $622,794 |
2018 | $1,086,922 | $1,227,700 | $1,428,032 |
2019 | $1,043,821 | $1,116,123 | $1,118,160 |
2020 | $1,094,281 | $1,009,763 | $1,078,957 |
2021 | $1,274,788 | $1,182,288 | $1,501,496 |
2022 | $1,352,727 | $1,426,185 | $1,328,080 |
2023 | $981,436 | $1,186,056 | $1,306,733 |
2024 | $410,026 | $996,940 | $1,572,358 |
OCR | Difference between resale 3BR and new 2BR | Difference between resale 3BR and resale 2BR | Difference between new 3BR and new 2BR |
2014 | $298,400 | $226,833 | $173,100 |
2015 | $339,870 | $210,167 | $177,067 |
2016 | $261,641 | $233,059 | $91,032 |
2017 | $259,153 | $244,669 | $106,112 |
2018 | $252,991 | $240,610 | $233,597 |
2019 | $209,737 | $271,788 | $297,089 |
2020 | $107,493 | $239,868 | $256,250 |
2021 | $103,567 | $277,417 | $244,886 |
2022 | -$48,458 | $326,550 | $179,357 |
2023 | -$56,766 | $353,085 | $252,313 |
2024 | $106,880 | $402,722 | $391,026 |
RCR | Difference between resale 3BR and new 2BR | Difference between resale 3BR and resale 2BR | Difference between new 3BR and new 2BR |
2014 | $298,292 | $358,880 | $330,877 |
2015 | $467,893 | $391,061 | $481,036 |
2016 | $551,054 | $416,679 | $507,004 |
2017 | $411,941 | $430,927 | $359,082 |
2018 | $510,217 | $436,088 | $599,480 |
2019 | $644,770 | $489,248 | $496,995 |
2020 | $583,768 | $515,797 | $478,318 |
2021 | $476,457 | $641,595 | $629,407 |
2022 | $458,288 | $745,508 | $768,034 |
2023 | $406,679 | $722,435 | $887,253 |
2024 | $354,856 | $719,639 | $834,486 |
More from Stacked
How We Made $270k From A $960k Condo Bought During COVID: A Buyer’s Case Study
Project Case Study: Penrose
Here are some of the more notable trends we found, visualised:


Across all segments, the price gap between new two and three-bedders widened over the last decade; but the RCR saw the sharpest and most consistent growth. The gap here grew from around $330,000 (2014) to $834,000 (2024).
The OCR price gap also caught up a bit from $91,000 (2016) to $391,000 (2024), but it’s still notably smaller in overall quantum than the RCR and CCR, so there’s hope for fringe region upgraders still. Among the three market segments, the OCR also presents an interesting alternative for buyers: a resale three-bedder here is close to the price of a new launch two-bedder.
As for the CCR, the recent recovery to a $1.57 million gap in 2024 suggests we may again see a widening gap for the “luxury premium.” But the gap in the CCR and OCR has both narrowed, compared to their RCR counterparts.
Districts where two-bedders outperformed the three-bedders in the price gap
Let’s take a deeper look at specific districts where two-bedders seem to outperform. Here’s a breakdown by districts and type of transactions.
Price gap between a resale 3 bedder and a new 2 bedder:
Year | 9 | 10 | 17 | 20 | 22 | 28 |
2014 | $1,206,694 | $759,001 | $356,833 | $396,770 | $174,633 | $388,584 |
2015 | $1,287,616 | $1,091,845 | $315,811 | $232,200 | $513,707 | |
2016 | $1,266,739 | $890,819 | $223,752 | $139,818 | $349,760 | |
2017 | $1,272,489 | $1,399,666 | $578,070 | $5,309 | $310,680 | |
2018 | $1,368,463 | $1,446,922 | $238,640 | $390,026 | -$5,755 | $350,290 |
2019 | $1,700,537 | $838,437 | $107,200 | $387,260 | $194,117 | |
2020 | $1,492,858 | $977,847 | $196,511 | $211,333 | $163,246 | |
2021 | $1,629,096 | $1,285,874 | $158,589 | $326,998 | $199,674 | |
2022 | $1,532,851 | $1,527,109 | $256,749 | $351,209 | $374,986 | |
2023 | $1,163,934 | $1,068,343 | -$194,453 | -$359,674 | $317,541 | |
2024 | $529,390 | $343,099 | $108,587 | $24,961 |
Across all these districts, prices between resale 3 bedders and new 2 bedders have fallen, though this gap still remains substantial.
For the value-conscious, District 22 (Jurong) and District 17 (Changi) will stand out. The price gap between two and three-bedders is below $110,000, so there’s a chance you can purchase a resale three-bedder at a price very close to a new two-bedder in these areas.
Price gap between a resale 3 bedder and a resale 2 bedder:
Year | 9 | 10 | 17 | 20 | 22 | 28 |
2014 | $953,026 | $815,016 | $245,611 | $291,698 | $121,855 | $368,147 |
2015 | $800,544 | $1,051,357 | $196,095 | $159,576 | $111,827 | $384,518 |
2016 | $889,936 | $1,498,589 | $203,991 | $230,329 | $145,813 | $280,500 |
2017 | $965,943 | $1,271,543 | $244,125 | $211,278 | $105,221 | $240,615 |
2018 | $1,297,743 | $1,576,932 | $280,765 | $319,619 | $138,652 | $302,747 |
2019 | $1,348,953 | $1,214,993 | $301,321 | $419,552 | $199,705 | $271,904 |
2020 | $1,108,032 | $1,023,907 | $284,901 | $353,716 | $110,480 | $334,510 |
2021 | $1,332,430 | $1,255,705 | $332,703 | $420,427 | $177,038 | $290,720 |
2022 | $1,375,576 | $1,699,192 | $331,525 | $539,773 | $250,425 | $328,290 |
2023 | $1,176,363 | $1,378,050 | $312,634 | $514,766 | $257,598 | $381,775 |
2024 | $1,067,639 | $1,018,509 | $392,634 | $499,522 | $291,441 | $433,715 |
When it comes to comparing resale transactions, however, the gap grew across the board, which is in line with the overall trends.
Price gap between a new 3 bedder and a new 2 bedder
Year | 9 | 10 | 17 | 20 | 22 | 28 |
2014 | $1,395,459 | $1,269,438 | $794,000 | $498,118 | $214,231 | $280,045 |
2015 | $840,555 | $1,412,207 | $396,520 | $152,885 | $242,272 | |
2016 | $411,180 | $1,502,467 | $283,767 | $187,496 | $249,300 | |
2017 | $593,797 | $854,471 | $479,343 | -$164,562 | $289,742 | |
2018 | $1,199,474 | $2,649,783 | $365,335 | $460,607 | -$239,711 | $387,104 |
2019 | $970,026 | $1,347,282 | $321,296 | $436,142 | $268,332 | |
2020 | $1,020,746 | $1,272,782 | $323,810 | $457,774 | $298,106 | |
2021 | $1,520,890 | $1,530,784 | $238,779 | $311,741 | $277,523 | |
2022 | $1,348,521 | $1,313,800 | $638,751 | $638,019 | $333,215 | |
2023 | $1,621,225 | $1,178,426 | $307,000 | $938,202 | $192,500 | |
2024 | $1,949,128 | $2,294,706 | $470,361 | $784,562 |
New 2 and 3 bedders also saw an increased gap with the exception of District 17 and 28. In these areas, the premium for three-bedders has remained flat or even declined. Speculatively, it’s because these areas (Changi/Pasir Ris and Seletar/Yio Chu Kang) have historically been known for lower prices, so a rising quantum is less palatable to buyers here.
Districts with comparable two and three-bedder performances
Where 2 and 3 bedders had comparable performances over the past 10 years, here’s a look at their average price differences across districts by type of sale.
Between resale 3 bedders and new 2 bedders:
District | 2014 | 2024 | Difference |
4 | $348,208 | $460,092 | $111,884 |
5 | $363,541 | $43,794 | -$319,747 |
11 | $632,599 | $717,988 | $85,389 |
12 | -$160,433 | $208,316 | $368,749 |
14 | $284,283 | $177,734 | -$106,549 |
15 | $265,907 | $473,377 | $207,470 |
16 | $321,389 | $254,439 | -$66,950 |
21 | $874,912 | $325,419 | -$549,492 |
23 | $216,654 | $13,247 | -$203,407 |
When comparing these districts, there’s no clear pattern we can see underlying them. Some districts saw a greater price difference between resale 3 bedders and new 2 bedders, while others saw a smaller price difference.
Those looking for value may want to focus on districts 5 and 21. In 2024, resale three-bedder versus new two-bedder price gaps here narrowed to under $100,000; so this is another area where you could get the bigger unit if you opt for resale.
Between resale 3 bedders and resale 2 bedders
District | 2014 | 2024 | Difference |
4 | $672,094 | $865,355 | $193,260 |
5 | $412,301 | $703,682 | $291,381 |
11 | $583,830 | $876,882 | $293,052 |
12 | $360,950 | $573,660 | $212,710 |
14 | $174,856 | $501,293 | $326,437 |
15 | $421,927 | $805,362 | $383,435 |
16 | $287,803 | $591,097 | $303,293 |
21 | $364,687 | $640,001 | $275,314 |
23 | $232,546 | $378,184 | $145,638 |
Unlike the previous observation, the pattern is congruent with our general findings: the price gap between resale two and three-bedders is widening over the years, even when their investment performance is nearly identical.
Between new 3 bedders and new 2 bedders
District | 2014 | 2024 | Difference |
4 | $850,825 | $577,707 | -$273,118 |
5 | $408,043 | $586,853 | $178,810 |
11 | $753,838 | $938,545 | $184,707 |
12 | -$185,863 | $926,739 | $1,112,602 |
14 | $350,743 | $466,790 | $116,047 |
15 | $456,575 | $821,148 | $364,574 |
16 | $256,576 | $668,526 | $411,949 |
21 | $834,834 | $839,062 | $4,227 |
23 | $292,274 | $257,945 | -$34,328 |
As expected, most districts have also seen a greater price gap between new 3 bedders versus new 2 bedders.
Now let’s take a look at rental yields for two versus three-bedders
2 bedders
District | Avg price in 2024 | Avg rent in 2024 | Rental yield |
1 | $2,110,489 | $6,480 | 3.68% |
2 | $1,709,831 | $5,389 | 3.78% |
3 | $1,629,227 | $4,825 | 3.55% |
4 | $2,005,849 | $5,301 | 3.17% |
5 | $1,344,611 | $4,186 | 3.74% |
7 | $1,616,015 | $5,322 | 3.95% |
8 | $1,463,713 | $4,149 | 3.40% |
9 | $2,189,648 | $5,594 | 3.07% |
10 | $2,412,700 | $5,220 | 2.60% |
11 | $2,055,451 | $4,878 | 2.85% |
12 | $1,388,548 | $3,800 | 3.28% |
13 | $1,465,177 | $4,089 | 3.35% |
14 | $1,327,678 | $3,909 | 3.53% |
15 | $1,666,373 | $4,335 | 3.12% |
16 | $1,290,342 | $3,678 | 3.42% |
17 | $1,080,425 | $3,303 | 3.67% |
18 | $1,090,072 | $3,450 | 3.80% |
19 | $1,247,288 | $3,580 | 3.44% |
20 | $1,566,628 | $4,067 | 3.12% |
21 | $1,610,320 | $3,873 | 2.89% |
22 | $1,291,407 | $4,219 | 3.92% |
23 | $1,167,928 | $3,573 | 3.67% |
25 | $967,919 | $3,318 | 4.11% |
26 | $1,372,731 | $3,419 | 2.99% |
27 | $1,046,322 | $3,397 | 3.90% |
28 | $1,069,889 | $3,242 | 3.64% |
3 bedders
District | Avg price in 2024 | Avg rent in 2024 | Rental yield |
1 | $2,843,232 | $8,701 | 3.67% |
2 | $2,434,100 | $7,835 | 3.86% |
3 | $2,283,849 | $6,386 | 3.36% |
4 | $2,871,204 | $8,438 | 3.53% |
5 | $2,048,294 | $5,521 | 3.23% |
7 | $1,811,667 | $7,507 | 4.97% |
8 | $2,047,539 | $5,383 | 3.15% |
9 | $3,257,287 | $7,987 | 2.94% |
10 | $3,431,209 | $7,898 | 2.76% |
11 | $2,932,333 | $6,422 | 2.63% |
12 | $1,962,208 | $4,719 | 2.89% |
13 | $2,165,615 | $5,560 | 3.08% |
14 | $1,828,970 | $4,781 | 3.14% |
15 | $2,471,735 | $5,845 | 2.84% |
16 | $1,881,439 | $4,717 | 3.01% |
17 | $1,473,059 | $3,929 | 3.20% |
18 | $1,485,895 | $4,230 | 3.42% |
19 | $1,609,837 | $4,410 | 3.29% |
20 | $2,066,150 | $5,069 | 2.94% |
21 | $2,250,321 | $5,086 | 2.71% |
22 | $1,582,848 | $4,968 | 3.77% |
23 | $1,546,112 | $4,315 | 3.35% |
25 | $1,262,040 | $4,160 | 3.96% |
26 | $1,938,470 | $4,318 | 2.67% |
27 | $1,335,090 | $4,031 | 3.62% |
28 | $1,503,604 | $3,886 | 3.10% |
Here’s a look at their yields charted side by side so you can see the difference:

The two and three-bedder rental yield is pretty comparable across all districts. But if you ignore the fact that the margin of difference is almost negligible (under 0.5 per cent), we suppose you call two-bedders the winner, as they’re ahead in 22 out of 28 districts. But again, in many of these cases, they are barely ahead.
The exceptions are more interesting: In 2024, Districts 2, 4, 7, and 10 bucked the overall trend. Three-bedders here achieved higher gross rental yields than their smaller counterparts; this is especially notable in district 7, where three-bedders are a full percentage point ahead in gross yield.
Note that parts of District 7 are practically within the CCR, which gives this particular district an edge.
Overall conclusion:
It’s fairly clear that three-bedders win out in terms of price appreciation in most districts. In terms of gross rental yield, two-bedders win out by a small margin, so the overall judgement tilts heavily in favour of the bigger units. It also means that, despite their heftier price tag, three-bedders are still a viable rental asset (very close to their smaller two-bedder counterparts).
(And some might say more versatile, as if it underperforms as a rental asset, it’s large enough to be a family home.)
Three-bedders may come with a higher price tag, but the numbers suggest they often justify the cost, especially when factoring in stronger appreciation and comparable rental yields.
That said, affordability remains a key concern, and certain districts (like 5, 17, 21, and 22) offer rare pockets of value where the gap between unit types has narrowed to $100,000 or less. If you’re weighing your next move, these are the gaps worth watching — because the opportunity to upgrade without overspending may not last forever.
Next up: We’ll spotlight the specific condos where resale 3-bedders can still be found for the price of a new 2-bedder — or close to it.
Stay with us on Stacked for this coming update. If you’d like to get in touch for a more in-depth consultation, you can do so here.
Ryan J
A seasoned content strategist with over 17 years in the real estate and financial journalism sectors, Ryan has built a reputation for transforming complex industry jargon into accessible knowledge. With a track record of writing and editing for leading financial platforms and publications, Ryan's expertise has been recognised across various media outlets. His role as a former content editor for 99.co and a co-host for CNA 938's Open House programme underscores his commitment to providing valuable insights into the property market.Read next from Property Investment Insights

Property Investment Insights Why Some 30-Year-Old Leasehold Condos Are Still Outperforming New Ones

Property Investment Insights How Do Old Leasehold Condos Hold Up Against Newer Projects? A Case Study Of Orchid Park

Property Investment Insights Do Mega-Developments Really Outperform Regular Condos? A Parc Clematis Vs Clavon Case Study

Property Investment Insights Affinity at Serangoon vs The Garden Residences: Same Launch Year, Same Location — But Which Gave Better Capital Gains?
Latest Posts

Property Advice The Surprising Reasons Some Singaporean Buyers Are Choosing Smaller Condo Units (Even When They Can Afford More)

Landed Home Tours Touring Onan Road, A Freehold Landed Estate With A “Hidden” Enclave Of Shophouses

Singapore Property News In a Weak Economy, This Policy Hurts Singaporean Homeowners Most

Overseas Property Investing I’m A Singaporean House-Hunting In Mexico City: Here’s What 2 Weeks On The Ground Taught Me

Homeowner Stories I’ve Lived In Braddell View For 14 Years: What It’s Like To Live In Singapore’s Largest Residential Site

Singapore Property News Rare Mixed-Use Site At Hougang MRT And New Sembawang EC Plot Just Launched: What You Need To Know

On The Market 5 Cheapest 4 Room HDB Flats In Central Singapore (From $495K)

Homeowner Stories Why These Buyers Chose Older Leasehold Condos—And Have No Regrets

Singapore Property News $1.16M For A 4-Room HDB In Clementi? Why This Integrated Development Commands Premium Prices

Editor's Pick Arina East Residences Review: First Condo Launch in Tanjong Rhu in 13 Years, Near MRT Station

Editor's Pick 4 Potential Residential En Bloc Sites That Could Be Worth Watching In 2025

Property Market Commentary Can Singapore’s Housing Market Handle A Rapidly Ageing Population?

Editor's Pick We Tour Freehold Landed Homes Within 1km Of Tao Nan & CHIJ Katong (From $3.88M In 2021)

Singapore Property News Why Lower Land Prices In Singapore Don’t Mean Cheaper New Condos

Singapore Property News Ang Mo Kio’s Most Expensive 5-Room HDB Flat Sold For $1.5 Million: Here’s Why
