

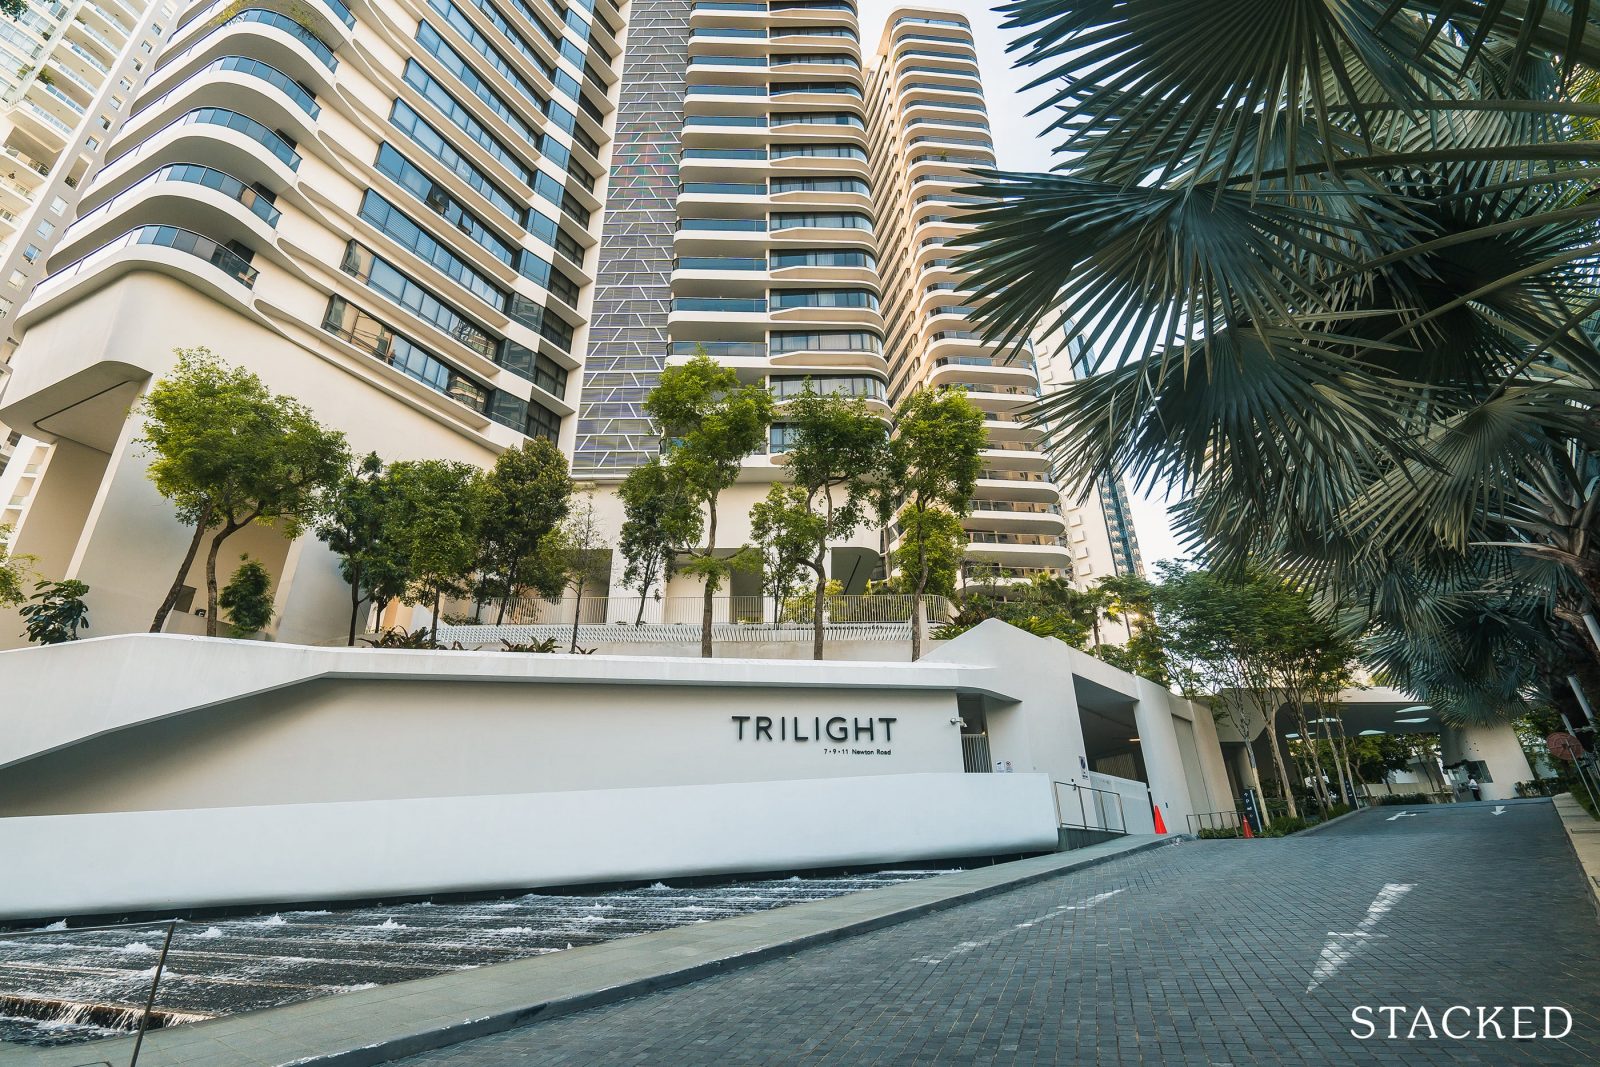
2020 and 2021 have been exceptional years for the Singapore property market, thanks (or no thanks) to Covid-19. While prices have mostly risen across the board, some districts have performed better than others. This is useful to know if you’re a home buyer in the current market, trying to shortlist potential locations. We've actually done one for the biggest rises and drops, but we'd like to look at it from a quantum perspective as well. So in the following tables, we’ve highlighted the top and bottom districts for price increases and decreases:
The challenge for many buyers today isn't access to information.
It's interpreting that information in a way that makes sense for their finances, goals, and stage of life.
Over time, that's also why we decided to work with agents who shared the same data-driven and advisory-led approach behind our editorial, consultants who could help readers think through decisions more objectively, rather than simply push transactions.
Today, the team has worked with more than 2,000 clients across over $5B in property transactions.
How did we determine gains and losses?
The following are all based on real transaction data, from URA records.
For the pre-Covid 19 period, we looked at transactions between January 2019 and February 2020.
For the post-Covid 19 period, we looked at transactions between August 2020 to July 2021.
As there are hardly any actual units transacting between these 2 periods given the relatively short amount of time between them, we looked at the average quantum of units of the same sizes in the same project within each period.
For example, if there were 3 transactions of 861 sqft units in Novena Court pre-covid, and 6 transactions of 861 sqft units of the same project post-covid, we would average out the transaction prices between both periods here and make the comparison.
(We’re aware that the term “post-Covid” may not be technically accurate, as the pandemic is still ongoing; but for the scope of the article, we consider “post-Covid” the period when more restrictions were lifted, vaccinations began to take place, etc. up to the present month).
An unavoidable complication arises from the number of transactions. Older or smaller developments tend to have a lower volume of transactions. For these properties, there’s a greater risk of prices diverging from the data presented. We are also aware that different floors and facings can result in different prices, however, there would be too little transaction volume to work if we narrowed our criteria to this.
We then applied this methodology across all districts evenly.
Price increase by district since Covid-19
| District | Average Price Gains/Loss | Average % Gains/Loss | Max. Price Loss | Max. % Loss | Max. Price Gains | Max. % Gains | Total Number of Transactions |
| 1 | $30,277 | 0.31% | -$250,000 | -19.00% | $385,696 | 14.00% | 277 |
| 2 | -$21,251 | -1.13% | -$170,667 | -11.00% | $252,056 | 25.00% | 184 |
| 3 | $29,222 | 1.77% | -$265,500 | -12.00% | $440,000 | 22.00% | 368 |
| 4 | -$21,463 | -1.24% | -$700,000 | -21.00% | $1,200,000 | 33.00% | 316 |
| 5 | $15,439 | 0.96% | -$316,667 | -12.00% | $322,000 | 16.00% | 479 |
| 7 | $785 | 0.42% | -$329,743 | -13.00% | $200,000 | 9.00% | 39 |
| 8 | $43,245 | 2.77% | -$180,000 | -9.00% | $370,778 | 18.00% | 150 |
| 9 | $46,895 | 0.96% | -$825,000 | -19.00% | $1,185,471 | 38.00% | 693 |
| 10 | $102,912 | 2.82% | -$793,230 | -22.00% | $1,700,000 | 28.00% | 742 |
| 11 | $88,175 | 3.90% | -$415,000 | -15.00% | $631,000 | 20.00% | 462 |
| 12 | $29,548 | 2.42% | -$160,000 | -8.00% | $620,000 | 35.00% | 520 |
| 13 | $13,027 | 1.05% | -$215,556 | -12.00% | $235,000 | 14.00% | 163 |
| 14 | $17,727 | 1.45% | -$184,400 | -24.00% | $303,500 | 20.00% | 517 |
| 15 | $47,032 | 2.43% | -$320,000 | -21.00% | $900,000 | 29.00% | 877 |
| 16 | $15,738 | 1.20% | -$307,500 | -29.00% | $393,333 | 20.00% | 693 |
| 17 | $12,547 | 1.18% | -$100,000 | -9.00% | $172,000 | 16.00% | 353 |
| 18 | $14,296 | 1.24% | -$170,000 | -14.00% | $800,000 | 67.00% | 968 |
| 19 | $21,490 | 1.60% | -$182,500 | -14.00% | $330,000 | 22.00% | 1317 |
| 20 | $44,085 | 2.56% | -$128,571 | -8.00% | $360,888 | 21.00% | 435 |
| 21 | $76,419 | 4.89% | -$290,000 | -19.00% | $413,333 | 23.00% | 483 |
| 22 | $10,629 | 0.91% | -$68,333 | -6.00% | $185,000 | 11.00% | 345 |
| 23 | $20,262 | 1.40% | -$220,000 | -17.00% | $232,500 | 17.00% | 870 |
| 25 | $13,727 | 1.42% | -$63,500 | -7.00% | $98,888 | 15.00% | 202 |
| 26 | $77,686 | 6.24% | -$80,000 | -7.00% | $800,000 | 80.00% | 133 |
| 27 | $18,145 | 1.72% | -$120,000 | -12.00% | $180,000 | 15.00% | 326 |
| 28 | $38,212 | 3.35% | -$130,000 | -10.00% | $300,000 | 17.00% | 153 |
Top five districts for gains since Covid-19
The following are ranked by average percentage gain. Where there is a tie, we give the spot to the district with the highest point of the average range.
- District 26 (Upper Thomson, Yio Chu Kang)
- District 21 (Clementi, Upper Bukit Timah)
- District 11 (Bukit Timah, Newton)
- District 12 (Toa Payoh, Balestier)
- District 10 (Holland, Orchard, Tanglin)
1. District 26 (Upper Thomson, Yio Chu Kang)
| Description | Amount |
| Average Price Gains/Loss | $77,686 |
| Average % Gains/Loss | 6.24% |
| Max. Price Loss | -$80,000 |
| Max. % Loss | -7.00% |
| Max. Price Gains | $800,000 |
| Max. % Gains | 80.00% |
| Total Number of Transactions | 133 |
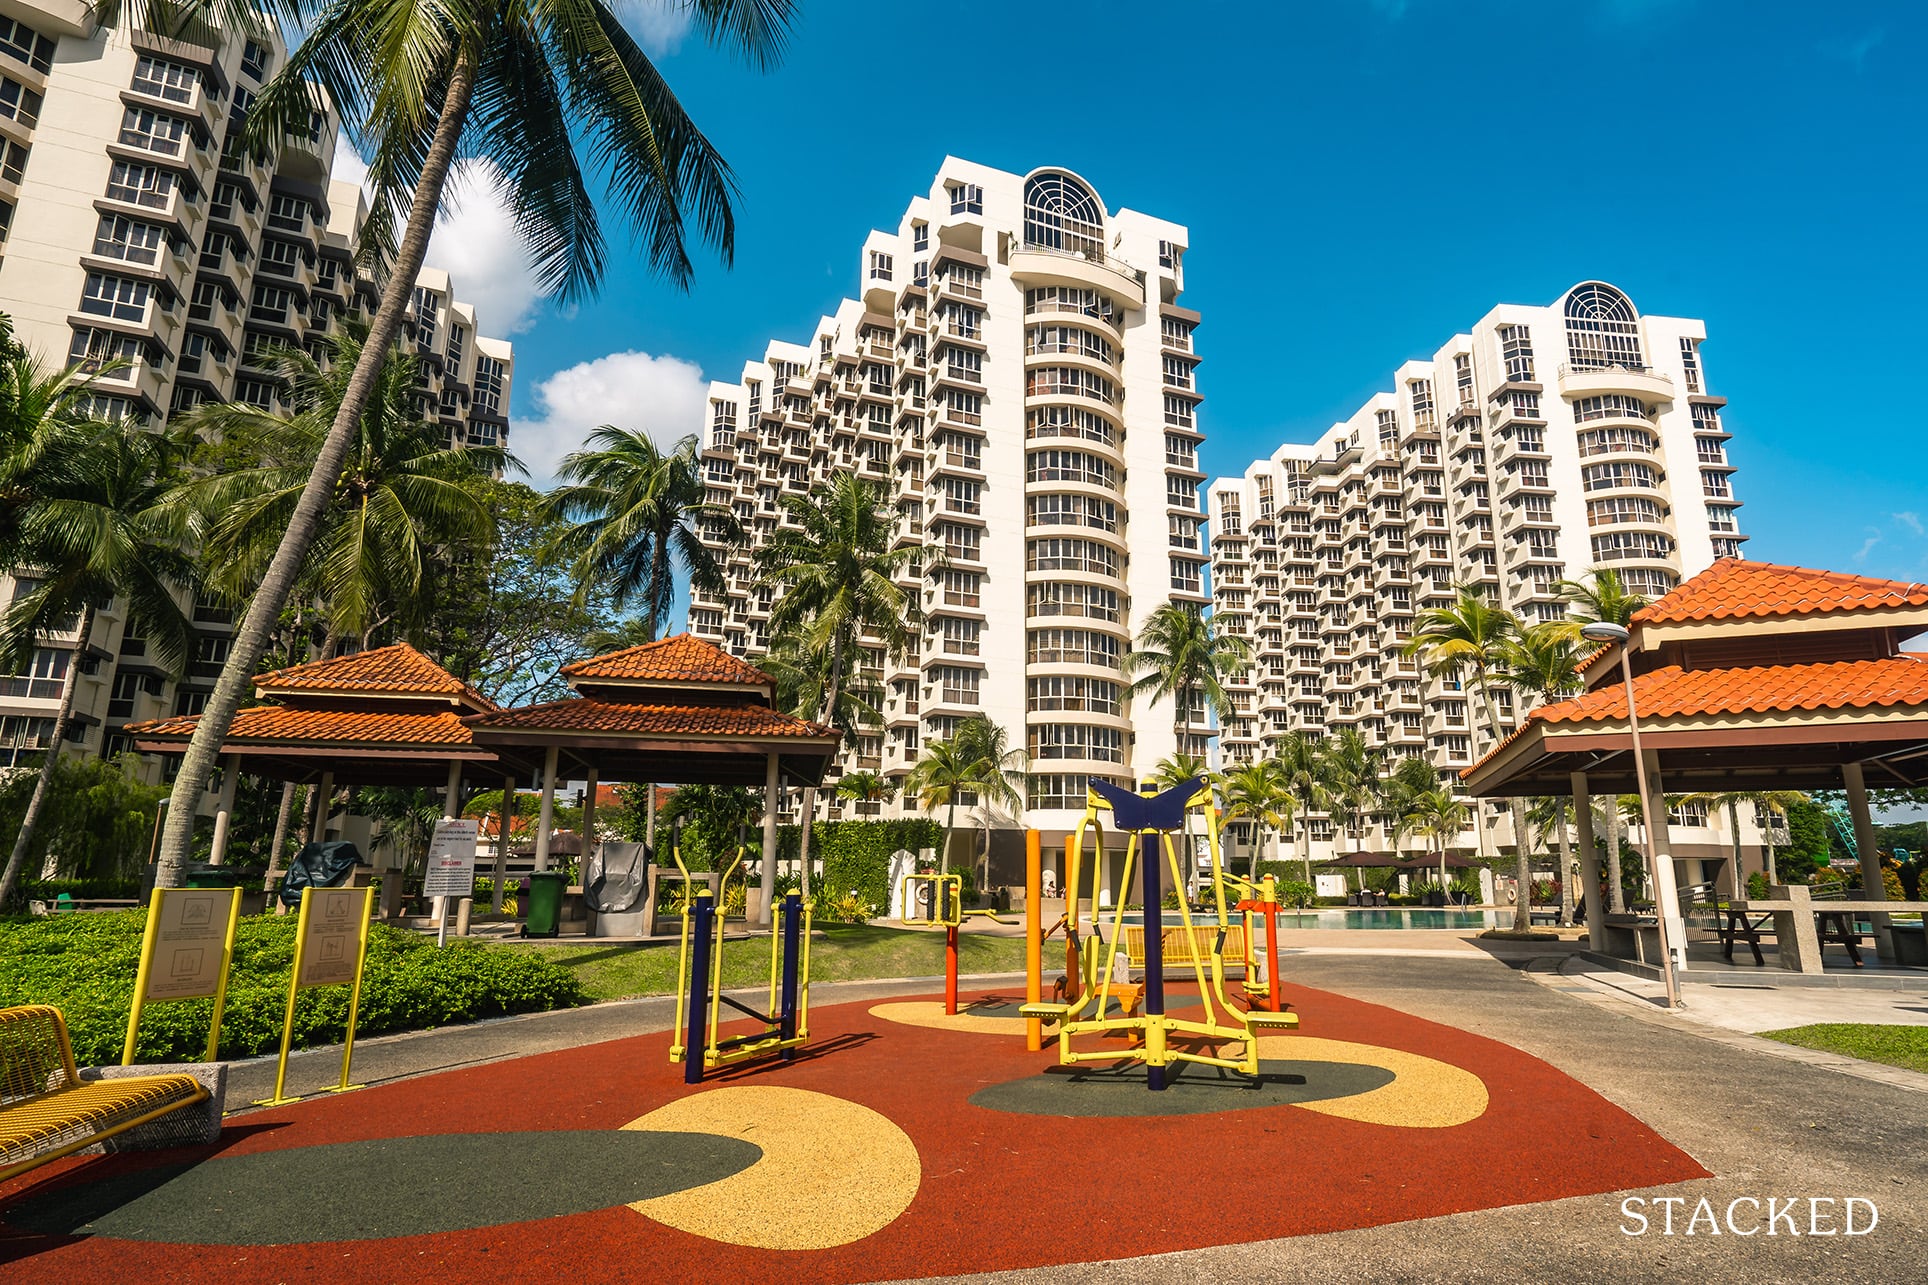
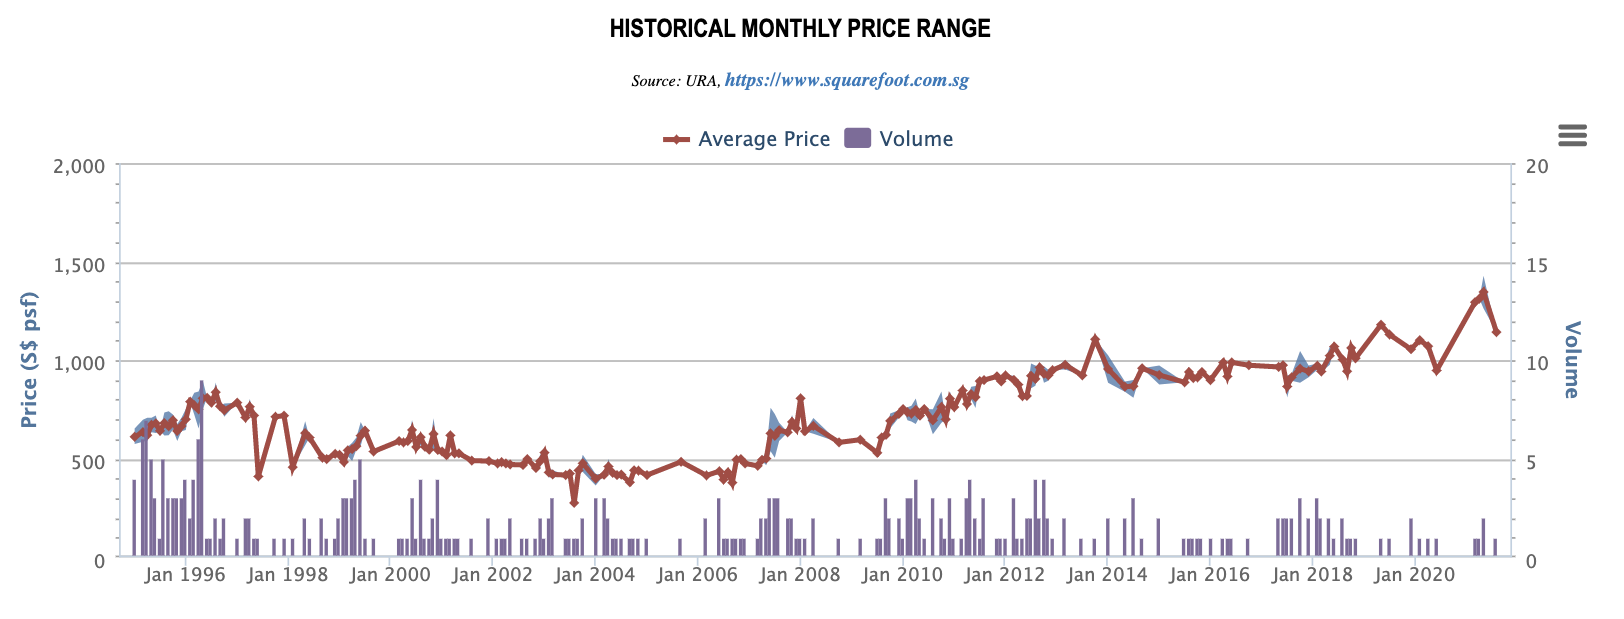
In District 26, the average was significantly pulled up by one development in particular – this was at Thomson Grove, where the price increases have recorded an average quantum gain of $800,000 ($673 psf to $1,212 psf) over the Covid-19 period.
This example is quite extreme though, as pulling out the actual transaction shows that the pre-covid price was really low at $673 psf, while units in 2016 (the gap is likely due to the wait for an en bloc which never materialised) were around $1,000 psf. Still, the jump from around $1,000 psf to $1,212 psf is quite significant.
This may be an example where freehold status really showed its value, as Thomson Grove was completed all the way back in the 1980’s.
But don’t be under the impression that one outlier did the heavy lifting. District 26 has come through Covid-19 quite well, with older developments like Seasons Park, Castle Green, and The Calrose (all late 1990’s era projects) seeing good gains.

What works in favour of District 26 is the current bulk of home buyers. The older condos we’ve mentioned tend to be larger, yet within a price range that’s reachable to HDB upgraders. District 26 also has a lot of greenery and parks, which appeals more to families.
2. District 21 (Clementi, Upper Bukit Timah)
| Description | Amount |
| Average Price Gains/Loss | $76,419 |
| Average % Gains/Loss | 4.89% |
| Max. Price Loss | -$290,000 |
| Max. % Loss | -19.00% |
| Max. Price Gains | $413,333 |
| Max. % Gains | 23.00% |
| Total Number of Transactions | 483 |
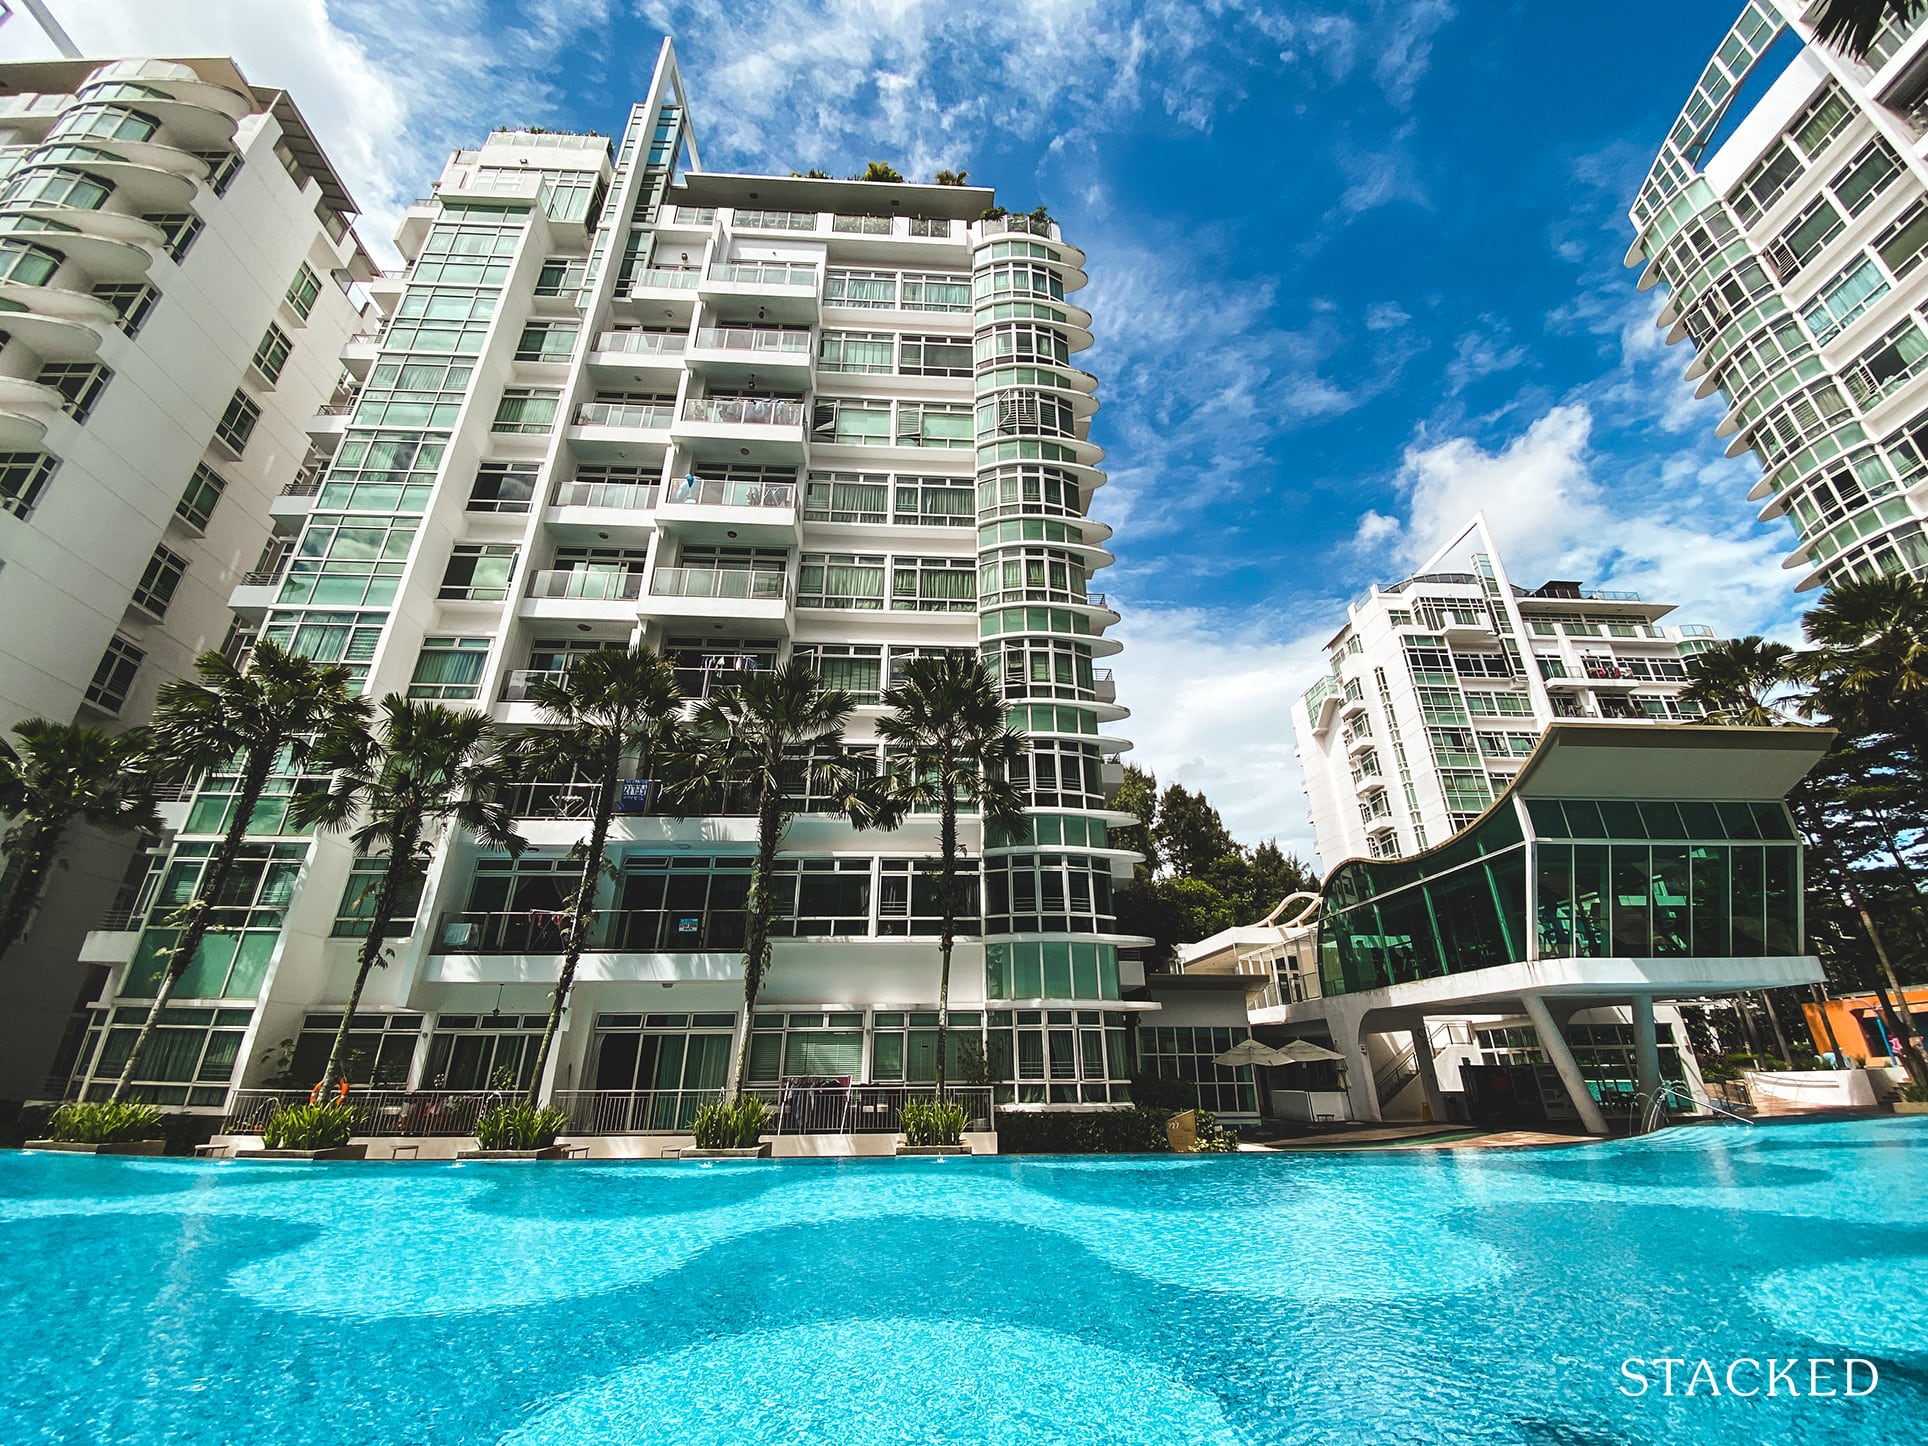
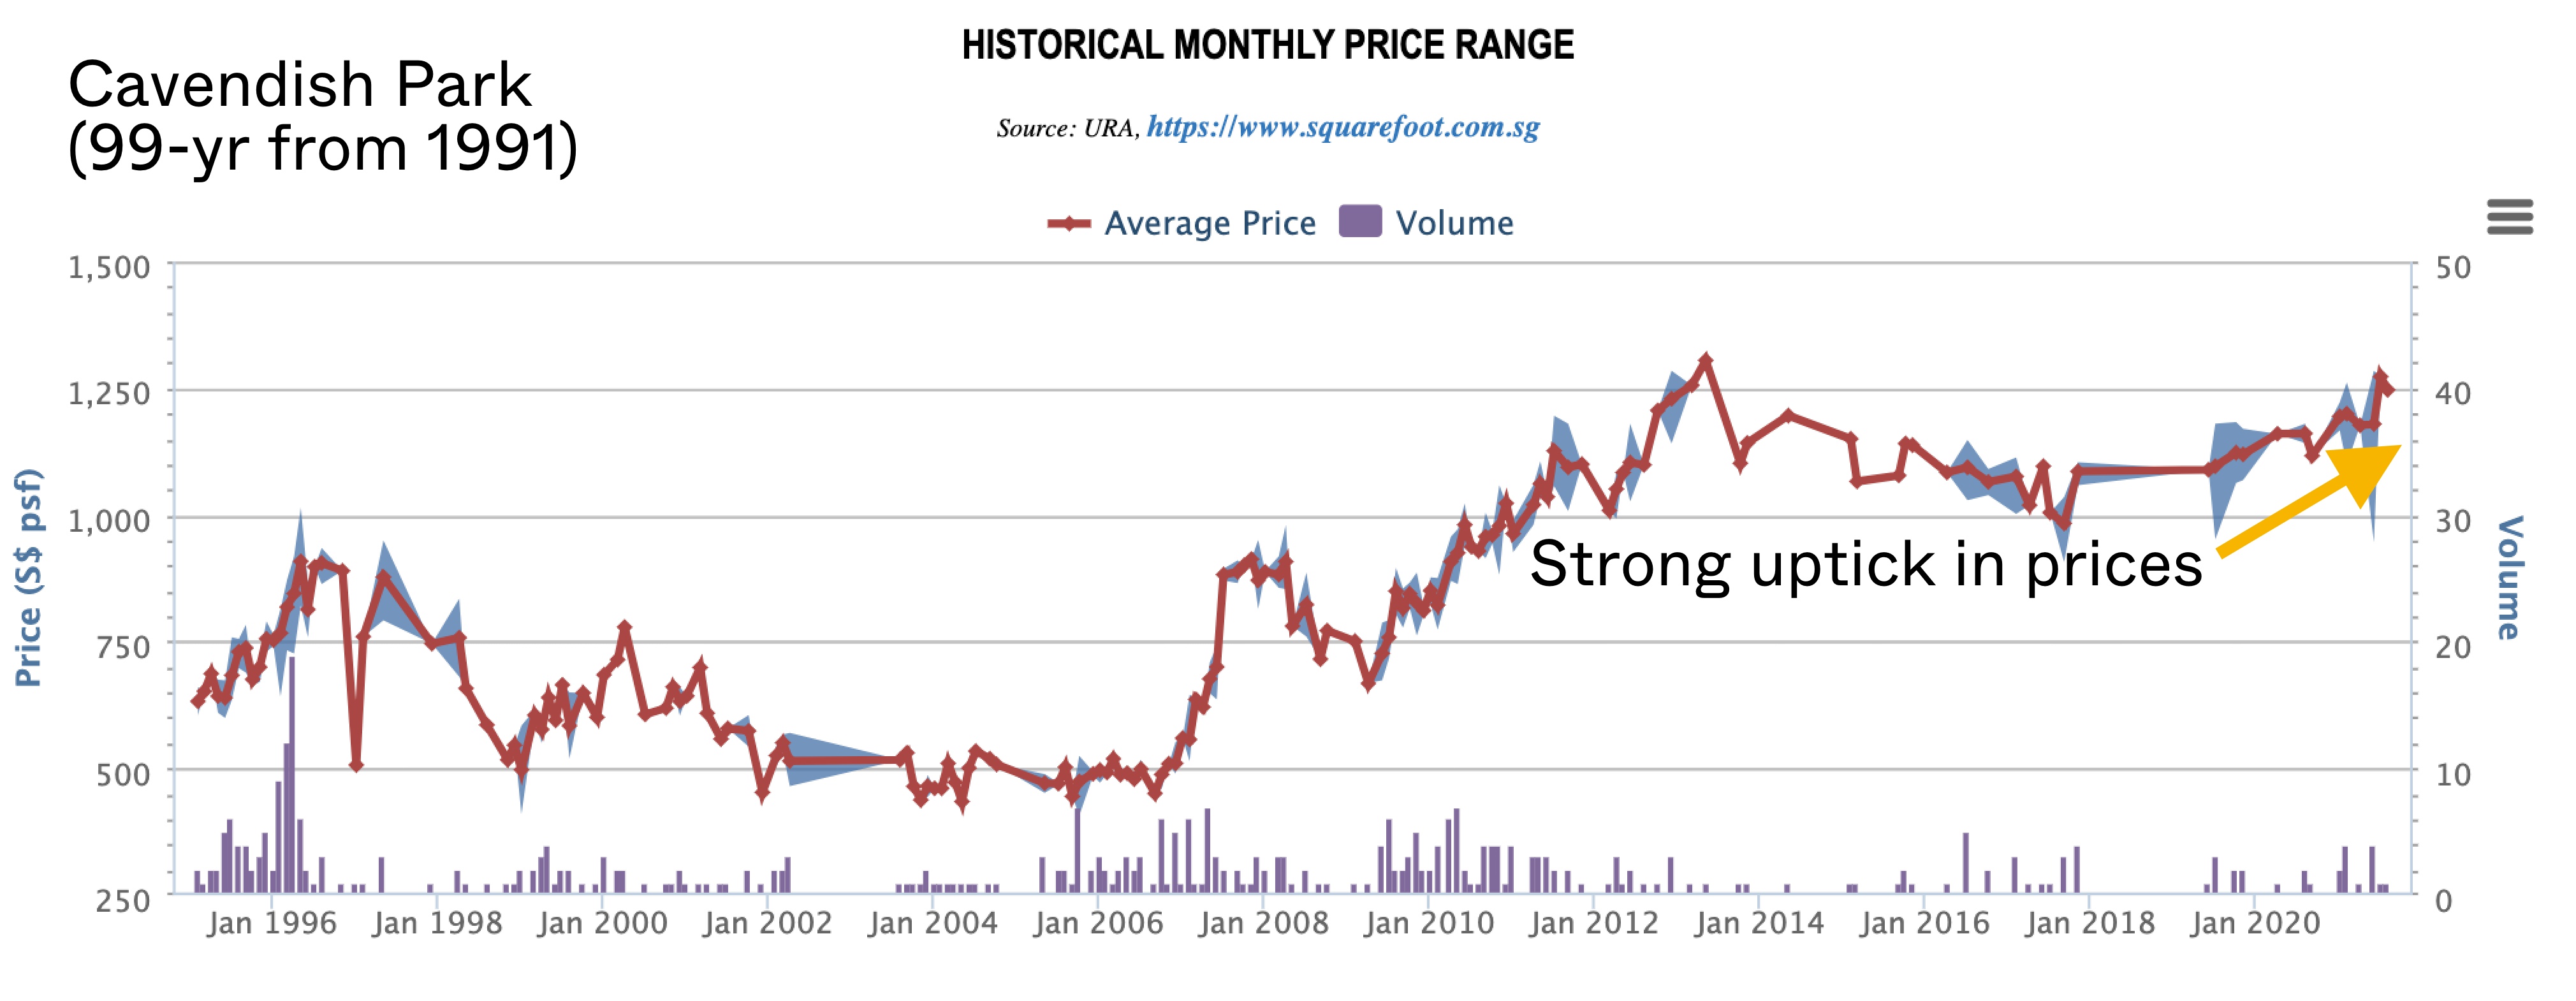
Hume Park I, Cavendish Park, and Maple Woods led gains for District 21. Hume Park doesn’t come as a surprise, as it’s close to the unfolding Rail Corridor; it also benefits from upgrades to the Beauty World area, which is a seven-minute drive away.
Cavendish Park is more a surprise, given that it has a 99-year lease from 1991, and is not particularly close to any MRT station. Perhaps its larger unit sizes, with proximity to the School of Science and Technology (530 metres), are bigger draws than we expected.
Overall, Upper Bukit Timah has always been a favourite for family living – it provides the same nature parks and spaciousness you can find in Bukit Timah, but with less exorbitant prices.
A little further away, Clementi is long known for its proximity to universities and polytechnics; and benefits from being a short drive to One-North and Holland V.
3. District 11 (Bukit Timah, Newton)
| Description | Amount |
| Average Price Gains/Loss | $88,175 |
| Average % Gains/Loss | 3.90% |
| Max. Price Loss | -$415,000 |
| Max. % Loss | -15.00% |
| Max. Price Gains | $631,000 |
| Max. % Gains | 20.00% |
| Total Number of Transactions | 462 |
La Suisse and The Arcadia pulled up average gains for District 11, despite some surprises.

One of these was Novena Court, which saw an average quantum price decrease of $99,333.
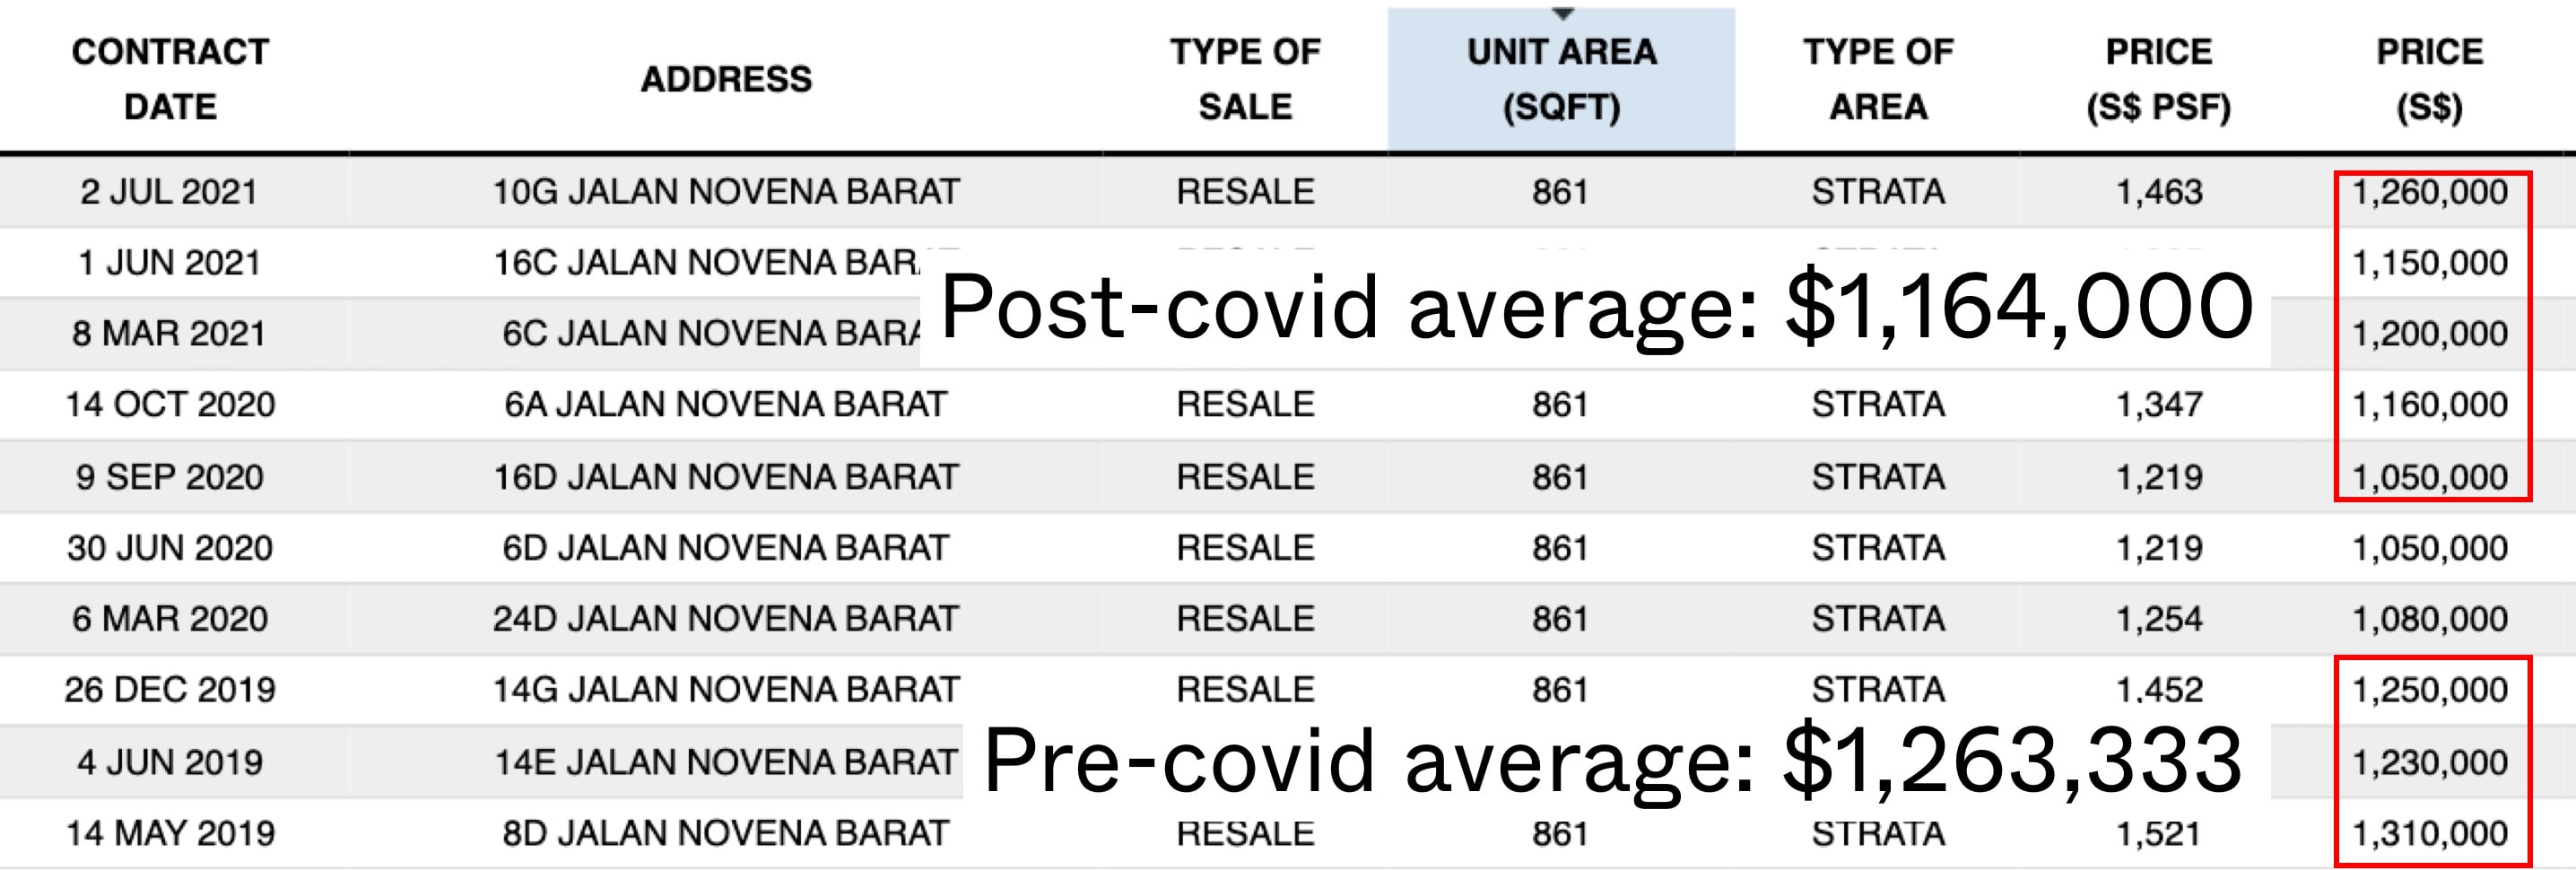
While Novena Court is old – it was completed in 1970 – it’s also a seven-minute walk to Novena MRT station, along with accompanying malls like VeloCity. We would think its age is mitigated by its freehold status, so it’s a bit surprising that any seller was willing to give it up (at the very least, we would imagine they’d hold on for the en-bloc potential). It may be due to the fact that more lower floor transactions happened during post-covid than pre-covid times, but the apartment is already quite low-rise to begin with. Perhaps, the heavy construction on the outside in the past few months is really weighing it down.
Overall, there’s no much to say about why District 11 is so desirable. This is a prime location in the Core Central Region (CCR). The Bukit Timah area has access to the best nature parks in Singapore, and is mainly surrounded by landed housing enclaves; there’s nothing to block the views.
For the more urban crowd, Newton provides quick access to the CBD, as well as an abundance of retail and eateries.
4. District 28 (Seletar / Yio Chu Kang)
| Description | Amount |
| Average Price Gains/Loss | $38,212 |
| Average % Gains/Loss | 3.35% |
| Max. Price Loss | -$130,000 |
| Max. % Loss | -10.00% |
| Max. Price Gains | $300,000 |
| Max. % Gains | 17.00% |
| Total Number of Transactions | 153 |
We're not too surprised to see district 28 making this list, considering it's in the OCR which has become more popular given the rising prices elsewhere.

The biggest gainer recorded here would be Mimosa Park which saw a max price gain of $300,000 for the 1,755 sqft units. In case you're wondering, the units here are just 1 floor apart. The 22-year old Mimosa Park continues to be one of the more popular condos here despite its age, even despite the MRT distance. It’s also clearly benefitted from the tenure of the estate, as it is a freehold one. The bigger units here have shown the highest price increases, with an average quantum gain at $300,000.
H20 Residences, which also saw an impressive average price increase of $175,000, is another well-known resale condo in this area. The main highlight here is that it is still a relatively new condo completed at 2015, at average prices of $1,250 psf – but do note that this is for a leasehold condo.
5. District 10 (Holland, Orchard, Tanglin)
| Description | Amount |
| Average Price Gains/Loss | $102,912 |
| Average % Gains/Loss | 2.82% |
| Max. Price Loss | -$793,230 |
| Max. % Loss | -22.00% |
| Max. Price Gains | $1,700,000 |
| Max. % Gains | 28.00% |
| Total Number of Transactions | 742 |
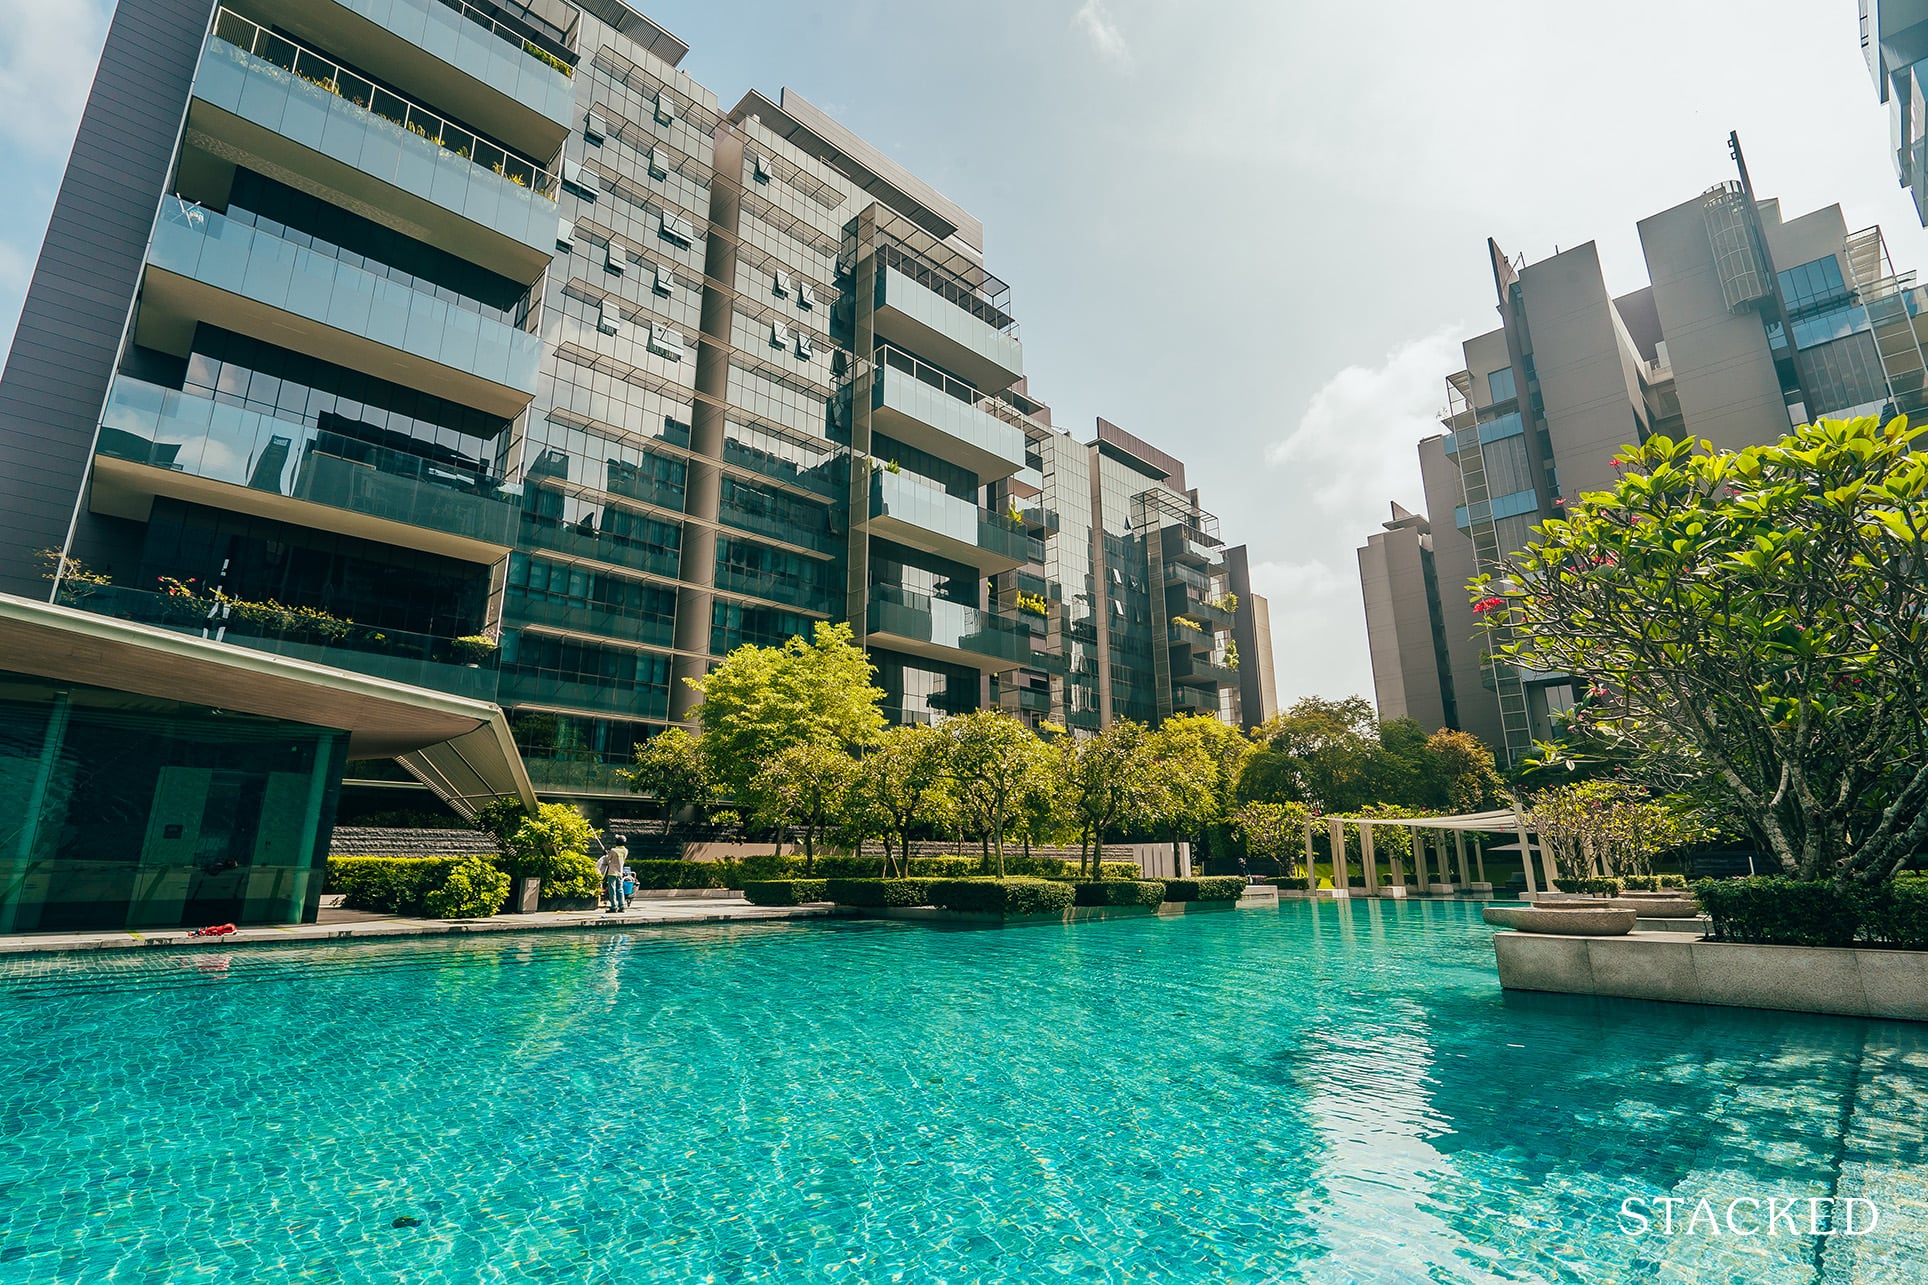
Overall, district 10 made an average of 2.82% for units transacted between both periods. The massive $1,700,000 price increase, by the way, came from Honolulu Tower, along Bukit Timah Road. This is a super-boutique condo with only 30 units, with gargantuan sizes of over 5,820 sq. ft., hence the larger sums involved.

If you’re curious, the transaction amount was $10,800,000 for a lower floor unit, with the $9,100,000 transaction a 5 floors higher that sold earlier in 2019.
Honolulu Tower was not the top gainer percentage wise, however; this goes to the renowned Melrose Park, which led with a percentage gain of 28 per cent – from $2.5 million to $3.2 million.
District 10 can be volatile, however, and the third worst loss we found was also from here. Mutiara Crest saw the average units transact at a loss of $483,250, down 22 per cent from the original purchase price.
We probably don’t need to explain that this is one of Singapore’s most prestigious districts, for our society’s most affluent. Realtors have told us that foreign investors consider District 10 a safe haven, in a volatile pandemic economy; and some are happy to buy despite the 20 per cent ABSD.
Bottom five districts for gains since Covid-19
The following are ranked from the greatest losses down. Where there is a tie, we give the spot to the district with the highest average loss.
- District 04 (Harbourfront, Sentosa)
- District 02 (Chinatown, Tanjong Pagar)
- District 01 (Boat Quay, Raffles Place)
- District 07 (Beach Road, Bugis)
- District 16 (Bedok, Upper East Coast)
1. District 04 (Harbourfront, Sentosa)
| Description | Amount |
| Average Price Gains/Loss | -$21,463 |
| Average % Gains/Loss | -1.24% |
| Max. Price Loss | -$700,000 |
| Max. % Loss | -21.00% |
| Max. Price Gains | $1,200,000 |
| Max. % Gains | 33.00% |
| Total Number of Transactions | 316 |
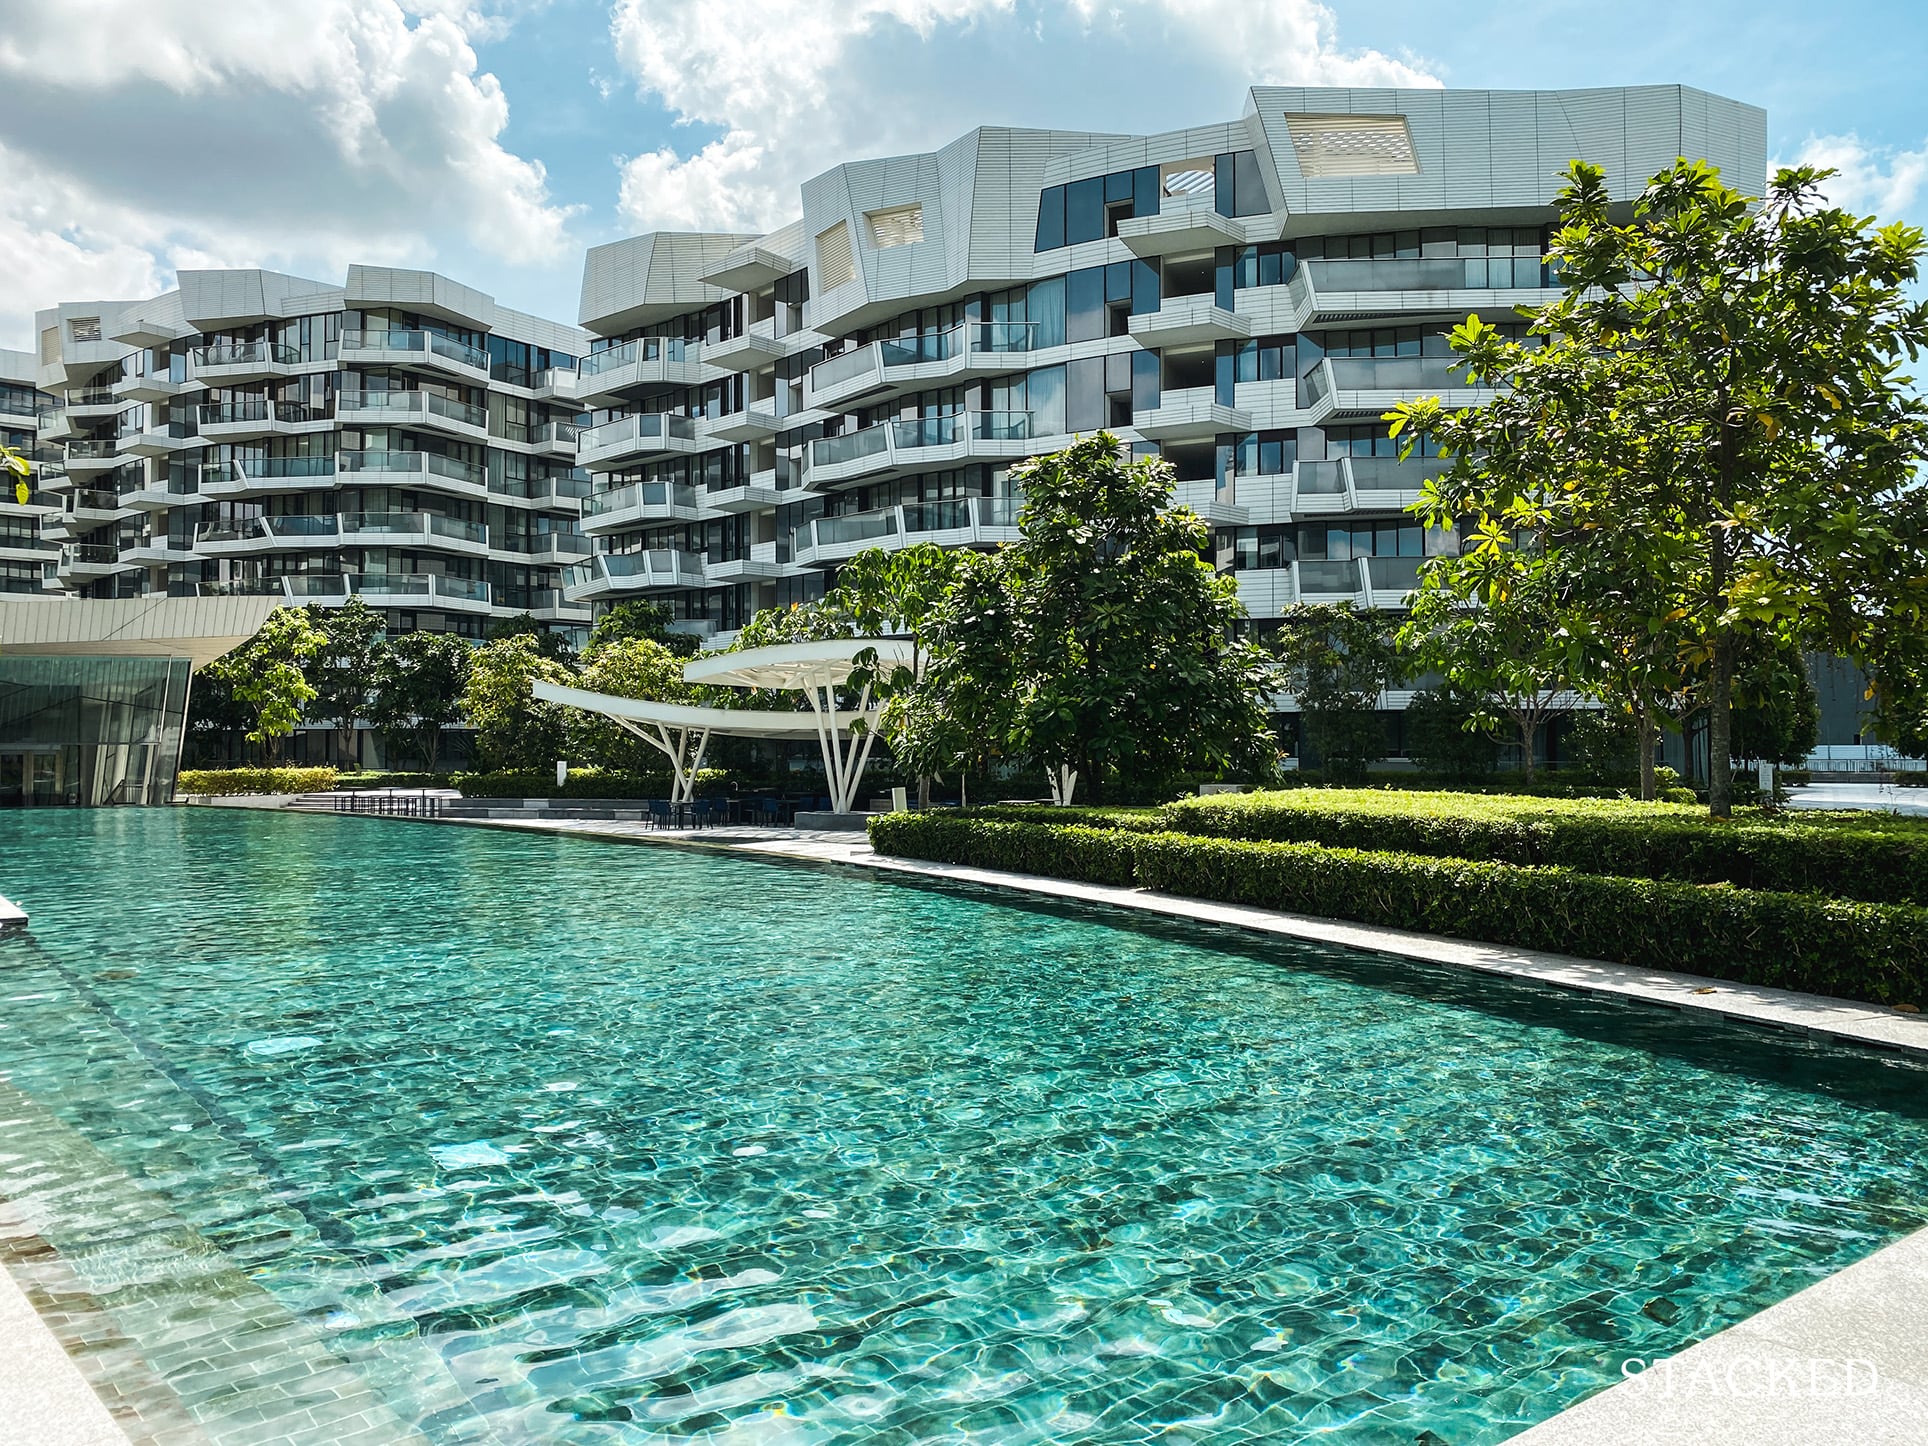
Note that District 04 averages were dominated by Reflections at Keppel Bay, which recorded both the highest (up 33 per cent) and lowest (down 21 per cent) transactions for the area.
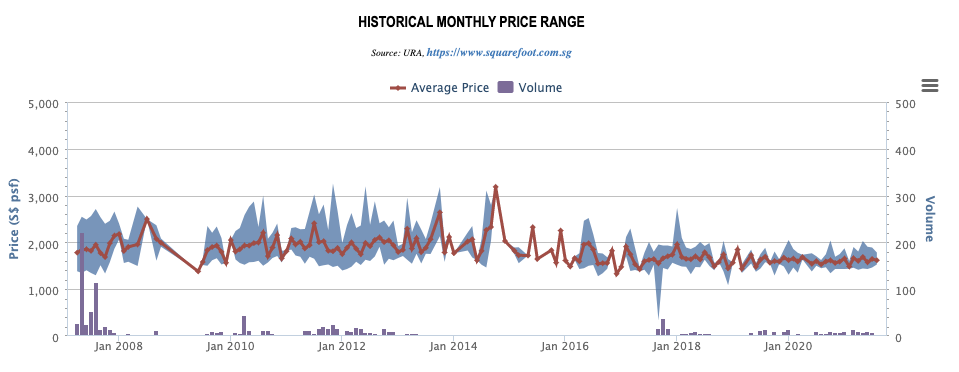
That said, District 04 has seen weaker gains for some time now, even before Covid-19. We covered some of the problems in this earlier article. It’s mainly the condos near the Harbourfront area which keep prices up, while Sentosa properties continue to struggle.
The situation in District 04 is largely unchanged from when we wrote the earlier article. If there is a turnaround, the condos around Harbourfront are where we’re likely to see stronger gains.
2. District 02 (Chinatown, Tanjong Pagar)
| Description | Amount |
| Average Price Gains/Loss | -$21,251 |
| Average % Gains/Loss | -1.13% |
| Max. Price Loss | -$170,667 |
| Max. % Loss | -11.00% |
| Max. Price Gains | $252,056 |
| Max. % Gains | 25.00% |
| Total Number of Transactions | 184 |
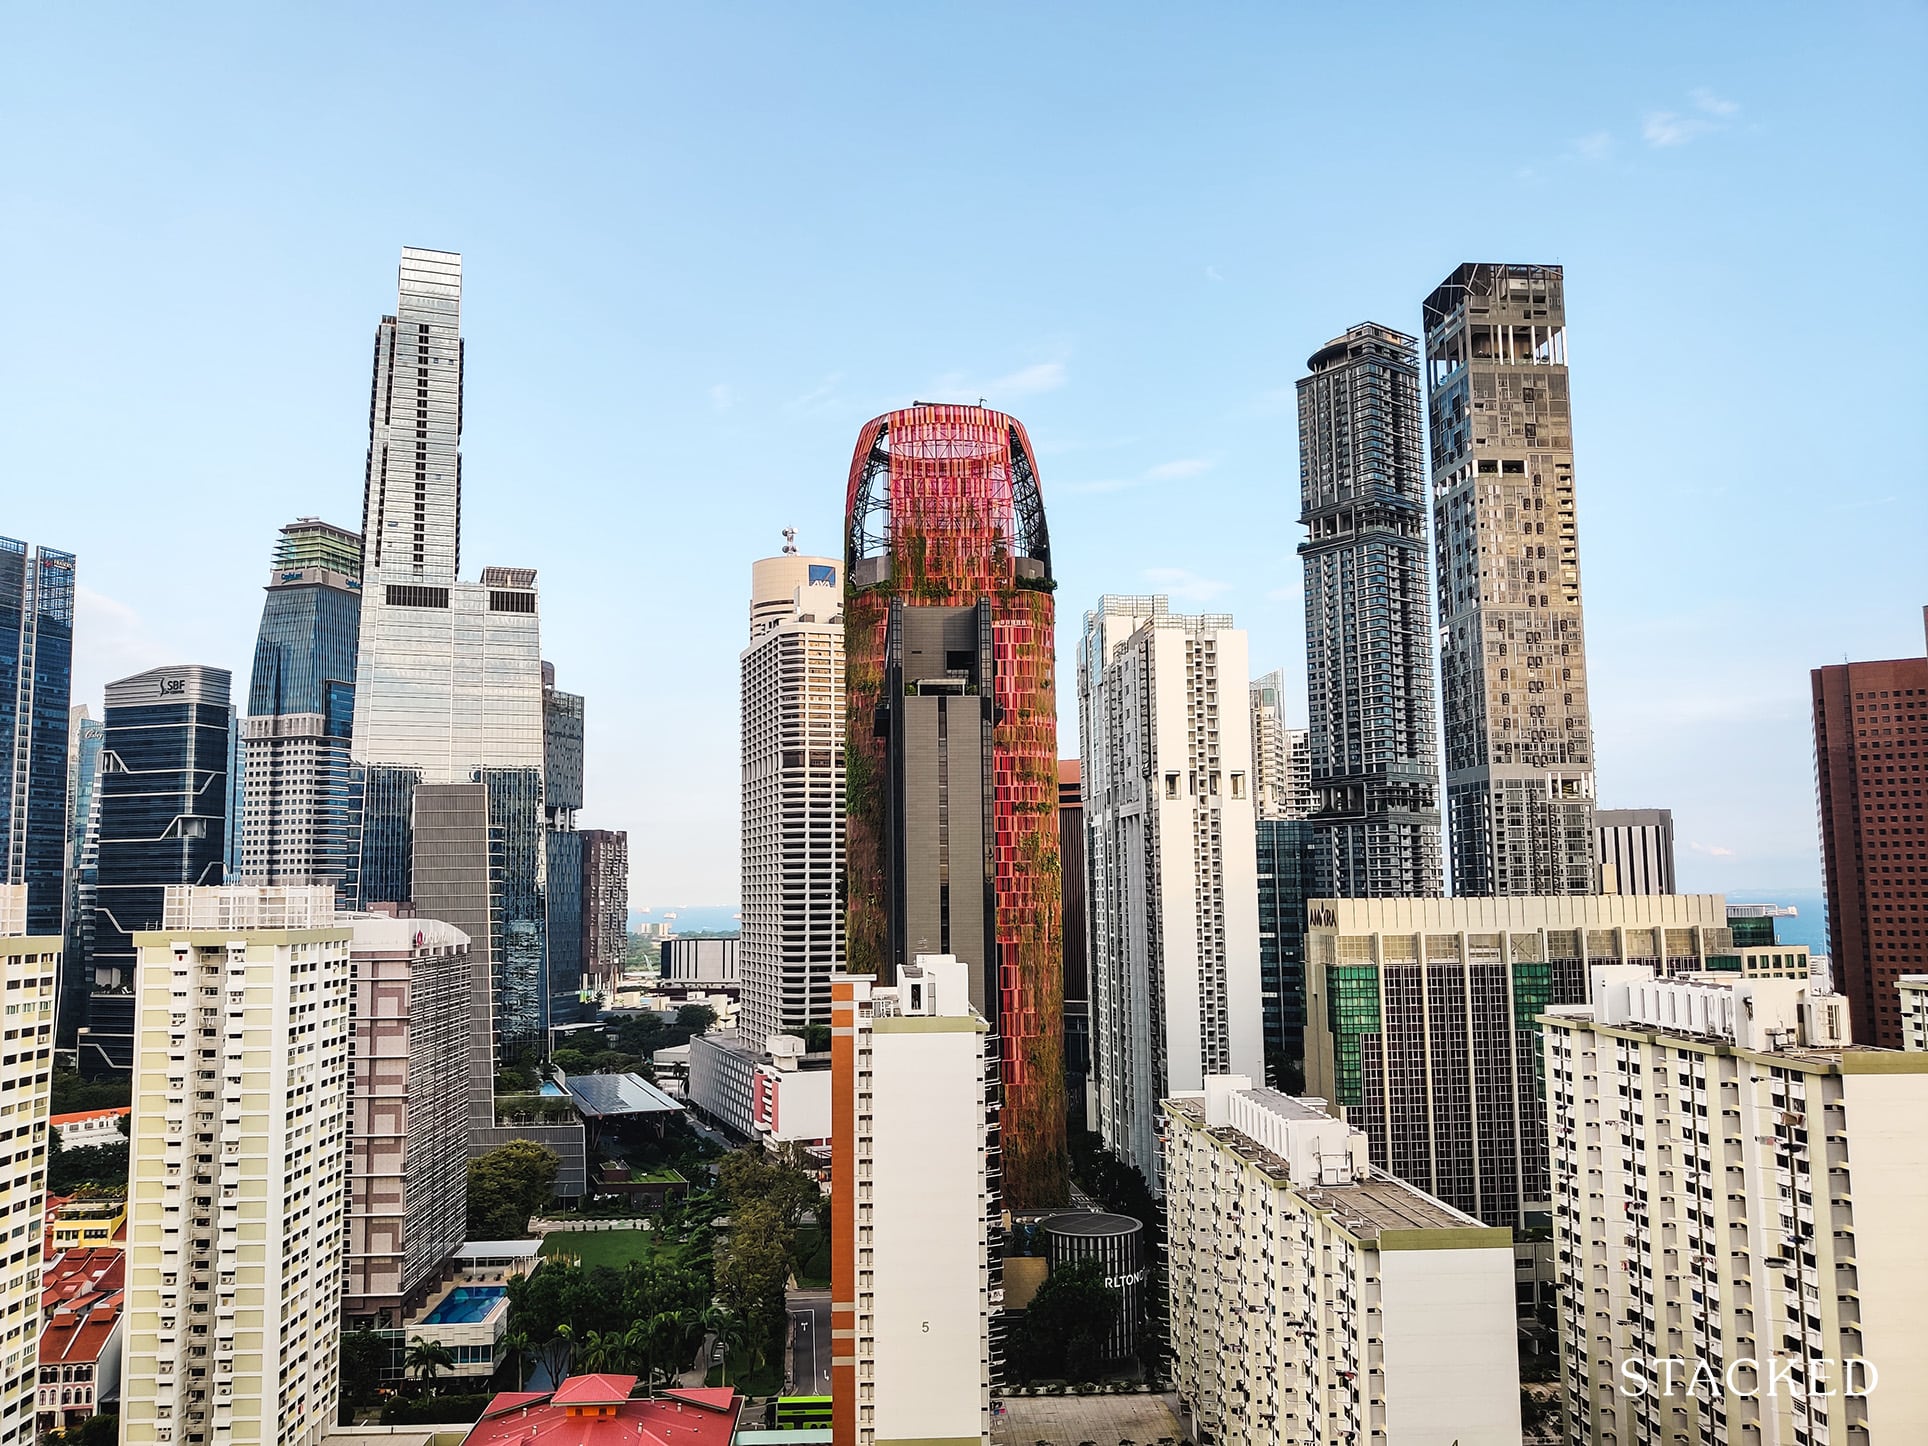
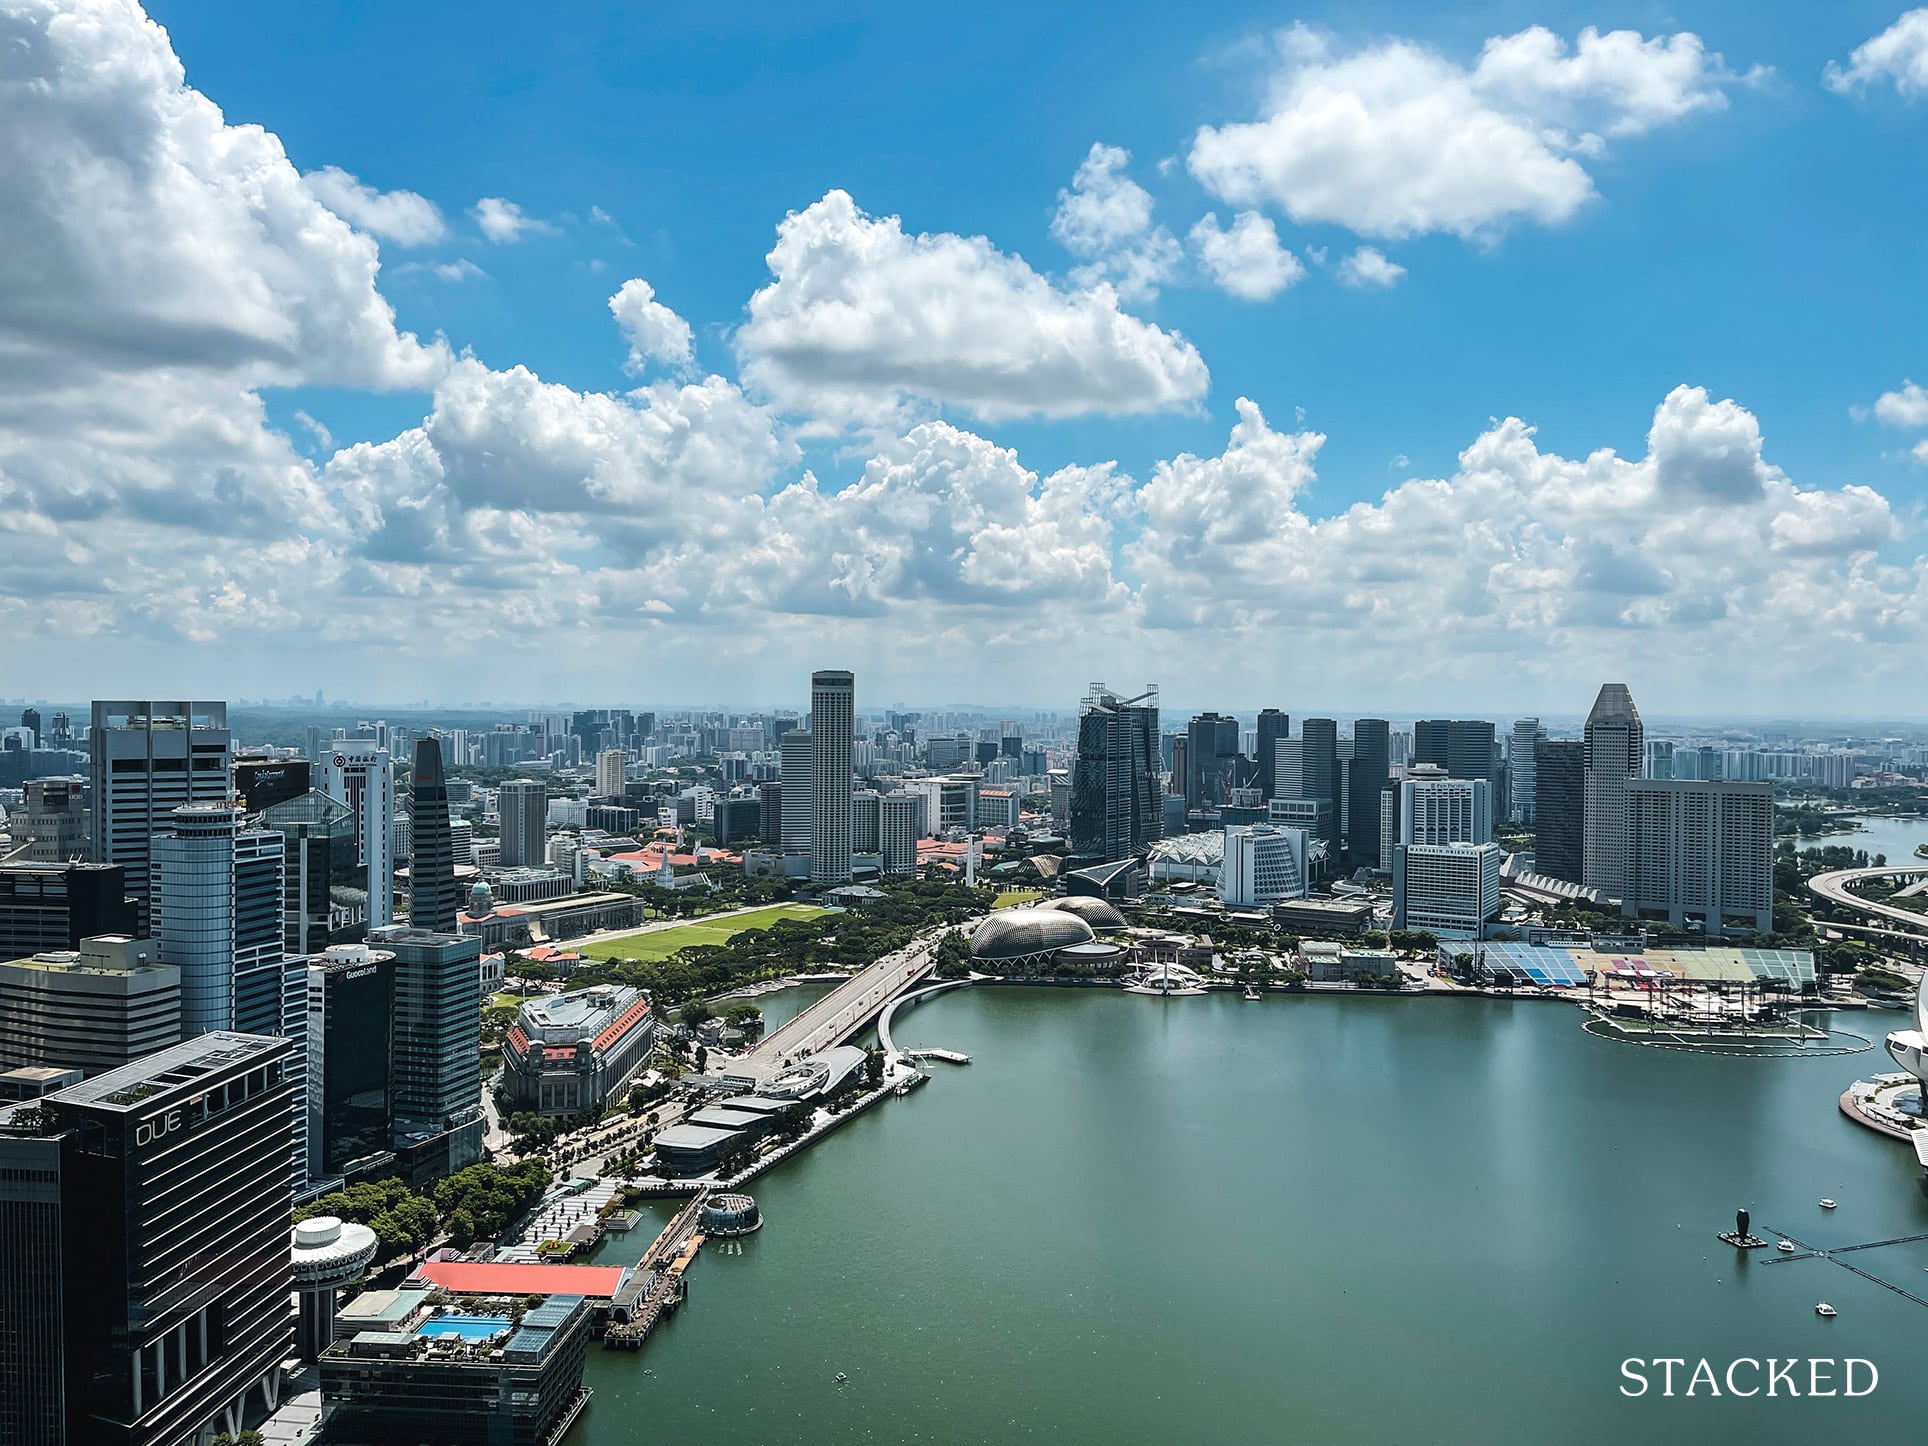
Spottiswoode Residence managed an average price increase of $252,056, or 25 per cent above the sale price. Beyond this, however, we saw modest gains from most District 02 properties. This was expected during Covid-19, as District 02 is part of the Central Business District (CBD).
Properties here are benefit from being close to offices, and from foreign tenants. Both of these came under threat during Covid-19. Work from home arrangements became more widespread, while the inflow of foreign tenants has slowed. Furthermore, the current group of buyers – being HDB upgraders – are less interested in the CBD area.
As such, we do think District 02 properties might struggle to see large gains, in the near term at the very least.
3. District 01 (Boat Quay, Raffles Place)
| Description | Amount |
| Average Price Gains/Loss | $30,277 |
| Average % Gains/Loss | 0.31% |
| Max. Price Loss | -$250,000 |
| Max. % Loss | -19.00% |
| Max. Price Gains | $385,696 |
| Max. % Gains | 14.00% |
| Total Number of Transactions | 277 |
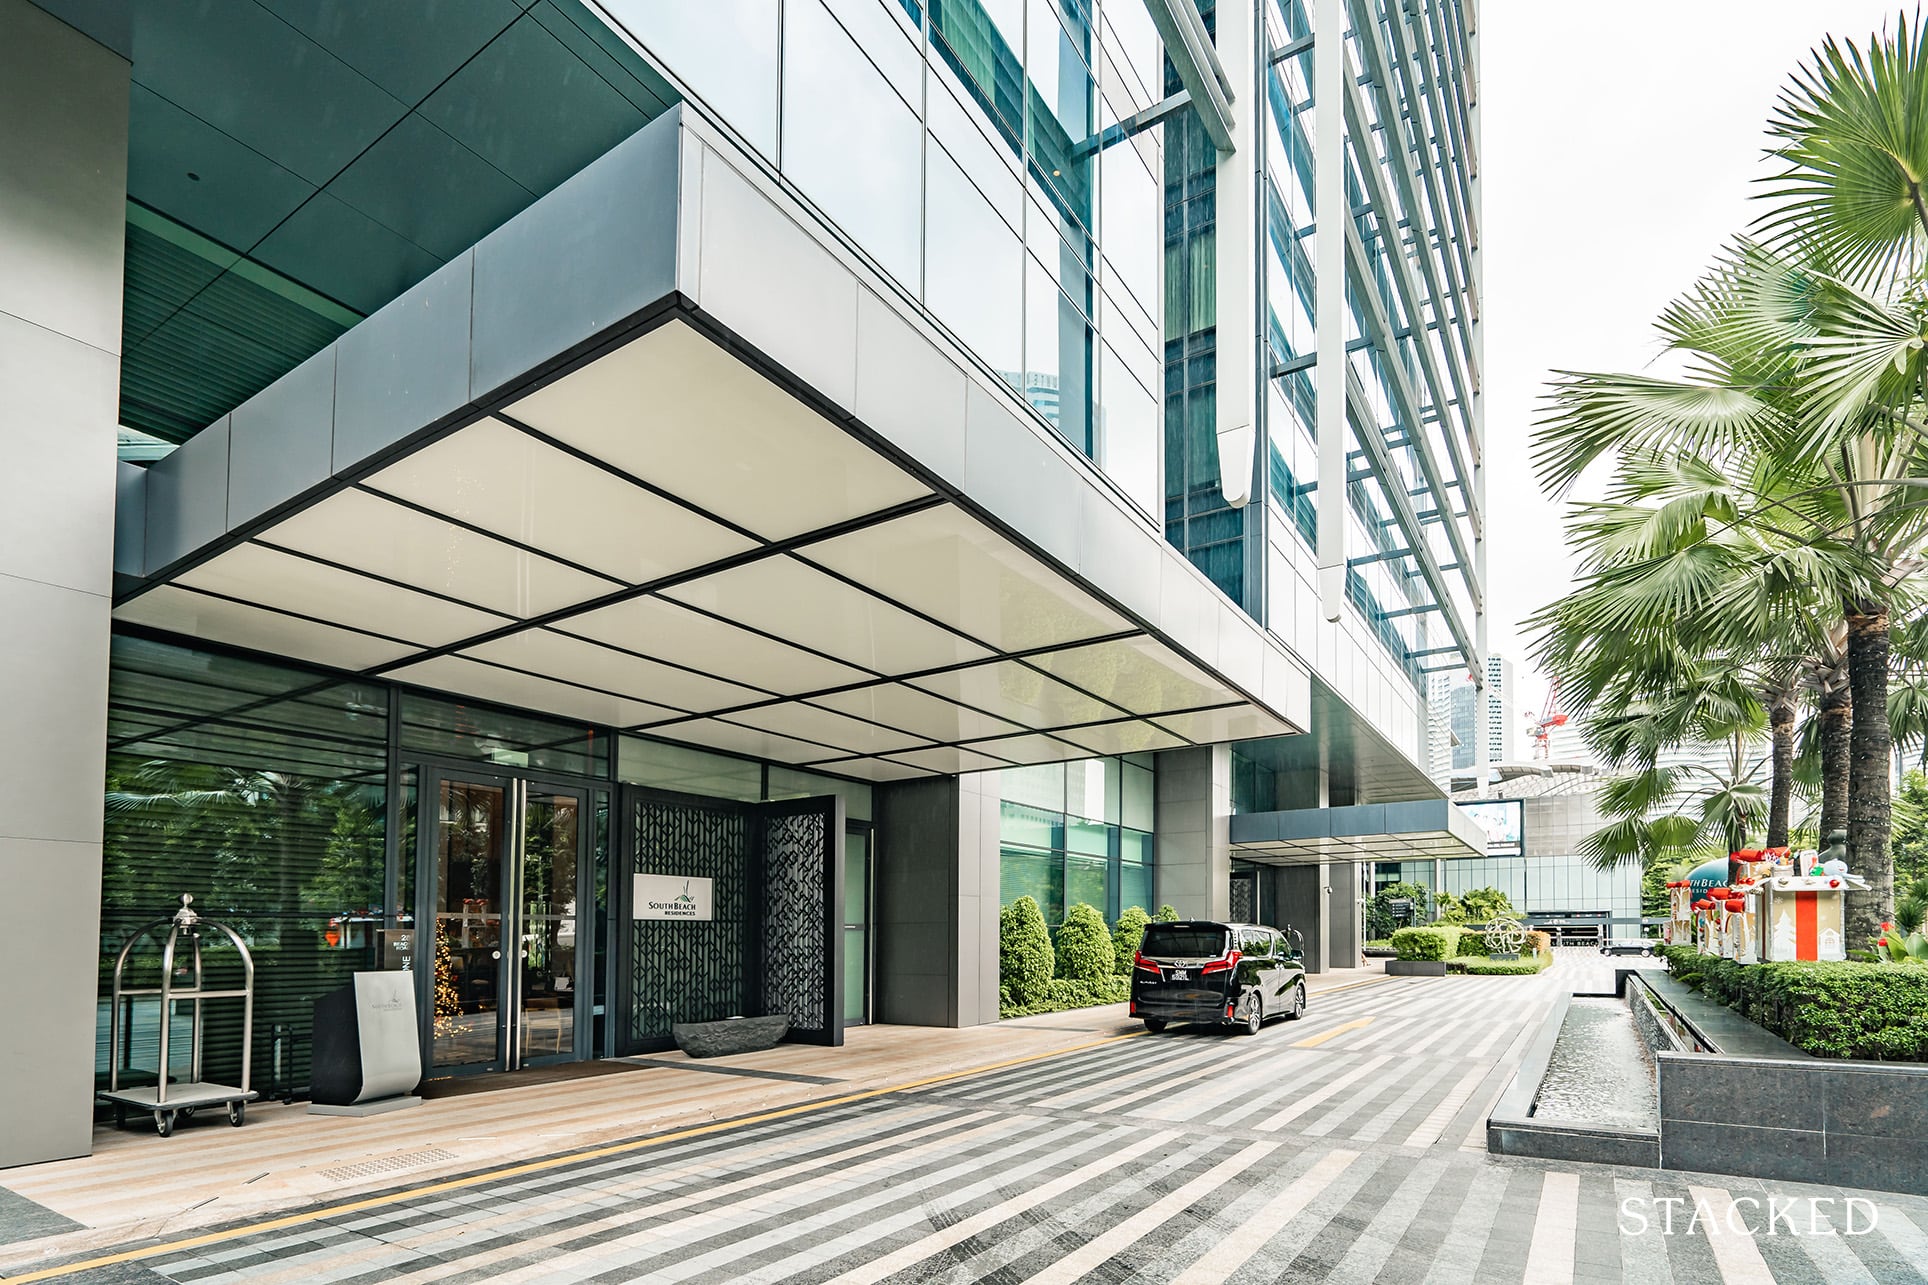
Most of the positive price increases - including the highest average at $385,696 – came from Marina One Residences. The other losing transactions were from Marina Bay Residences, and The Sail @ Marina Bay.
Marina One Residences has done well, to see positive increases when it was completed only in 2017. Being an integrated development, as well as being an icon of the area, probably help to keep prices up. Notably, six units were bought, sight unseen, during the Circuit Breaker period.
As for the rest of District 01, what we said about District 02 (see above) also applies. CBD area properties are likely to lag behind, barring a huge change in the Covid-19 situation.
4. District 07 (Beach Road, Bugis)
| Description | Amount |
| Average Price Gains/Loss | $785 |
| Average % Gains/Loss | 0.42% |
| Max. Price Loss | -$329,743 |
| Max. % Loss | -13.00% |
| Max. Price Gains | $200,000 |
| Max. % Gains | 9.00% |
| Total Number of Transactions | 39 |
District 07 gains and losses have been mostly flat, over the Covid-19 period. Attention here has mainly been on new launches, which have yet to see any resale transactions – The M, Midtown Bay, and Midtown Modern have mainly dominated buyer attention.
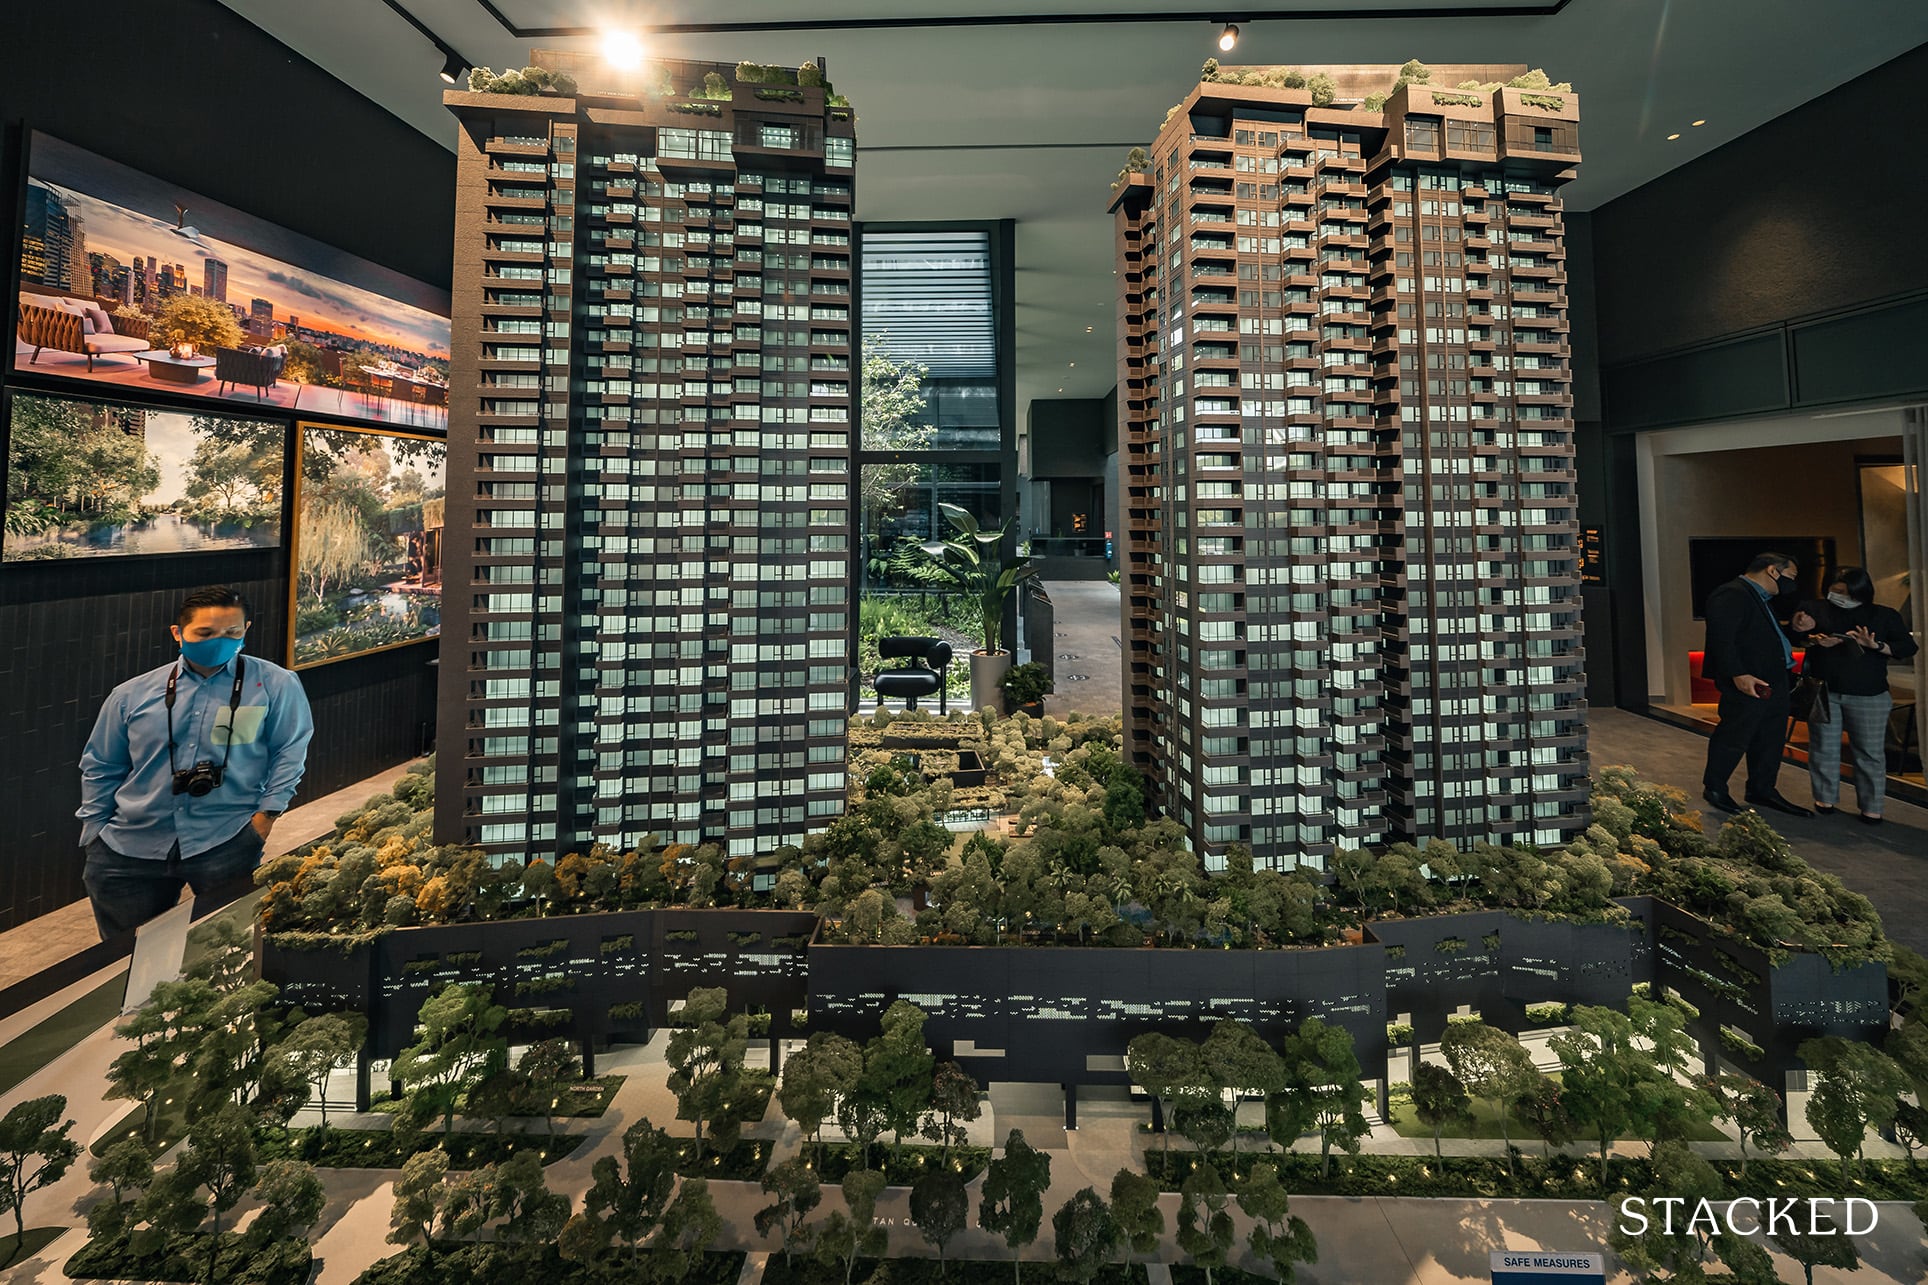
As such, the sale volumes, as well as gains, of resale condos in this area have been muted. There’s also the issue that District 07 isn’t well-positioned for HDB upgraders – even the new condos here have traded space for location, pushing a high price per square foot with a low quantum; that means a lot of very small one and two-bedders.
The general vicinity, while great for shopping and office workers, is a snarl of traffic and densely packed buildings to many home buyers.
That said, District 07 is currently the main hotspot of the Rest of Central Region (RCR), for reasons described in this article.
5. District 16 (Bedok, Upper East Coast)
| Description | Amount |
| Average Price Gains/Loss | $15,738 |
| Average % Gains/Loss | 1.20% |
| Max. Price Loss | -$307,500 |
| Max. % Loss | -29.00% |
| Max. Price Gains | $393,333 |
| Max. % Gains | 20.00% |
| Total Number of Transactions | 693 |
There were a few districts that ranged between gains of just 0.91% - 1.20%. Seeing that they are quite close, we have gone for the one with the greatest maximum percentage loss (-29%).
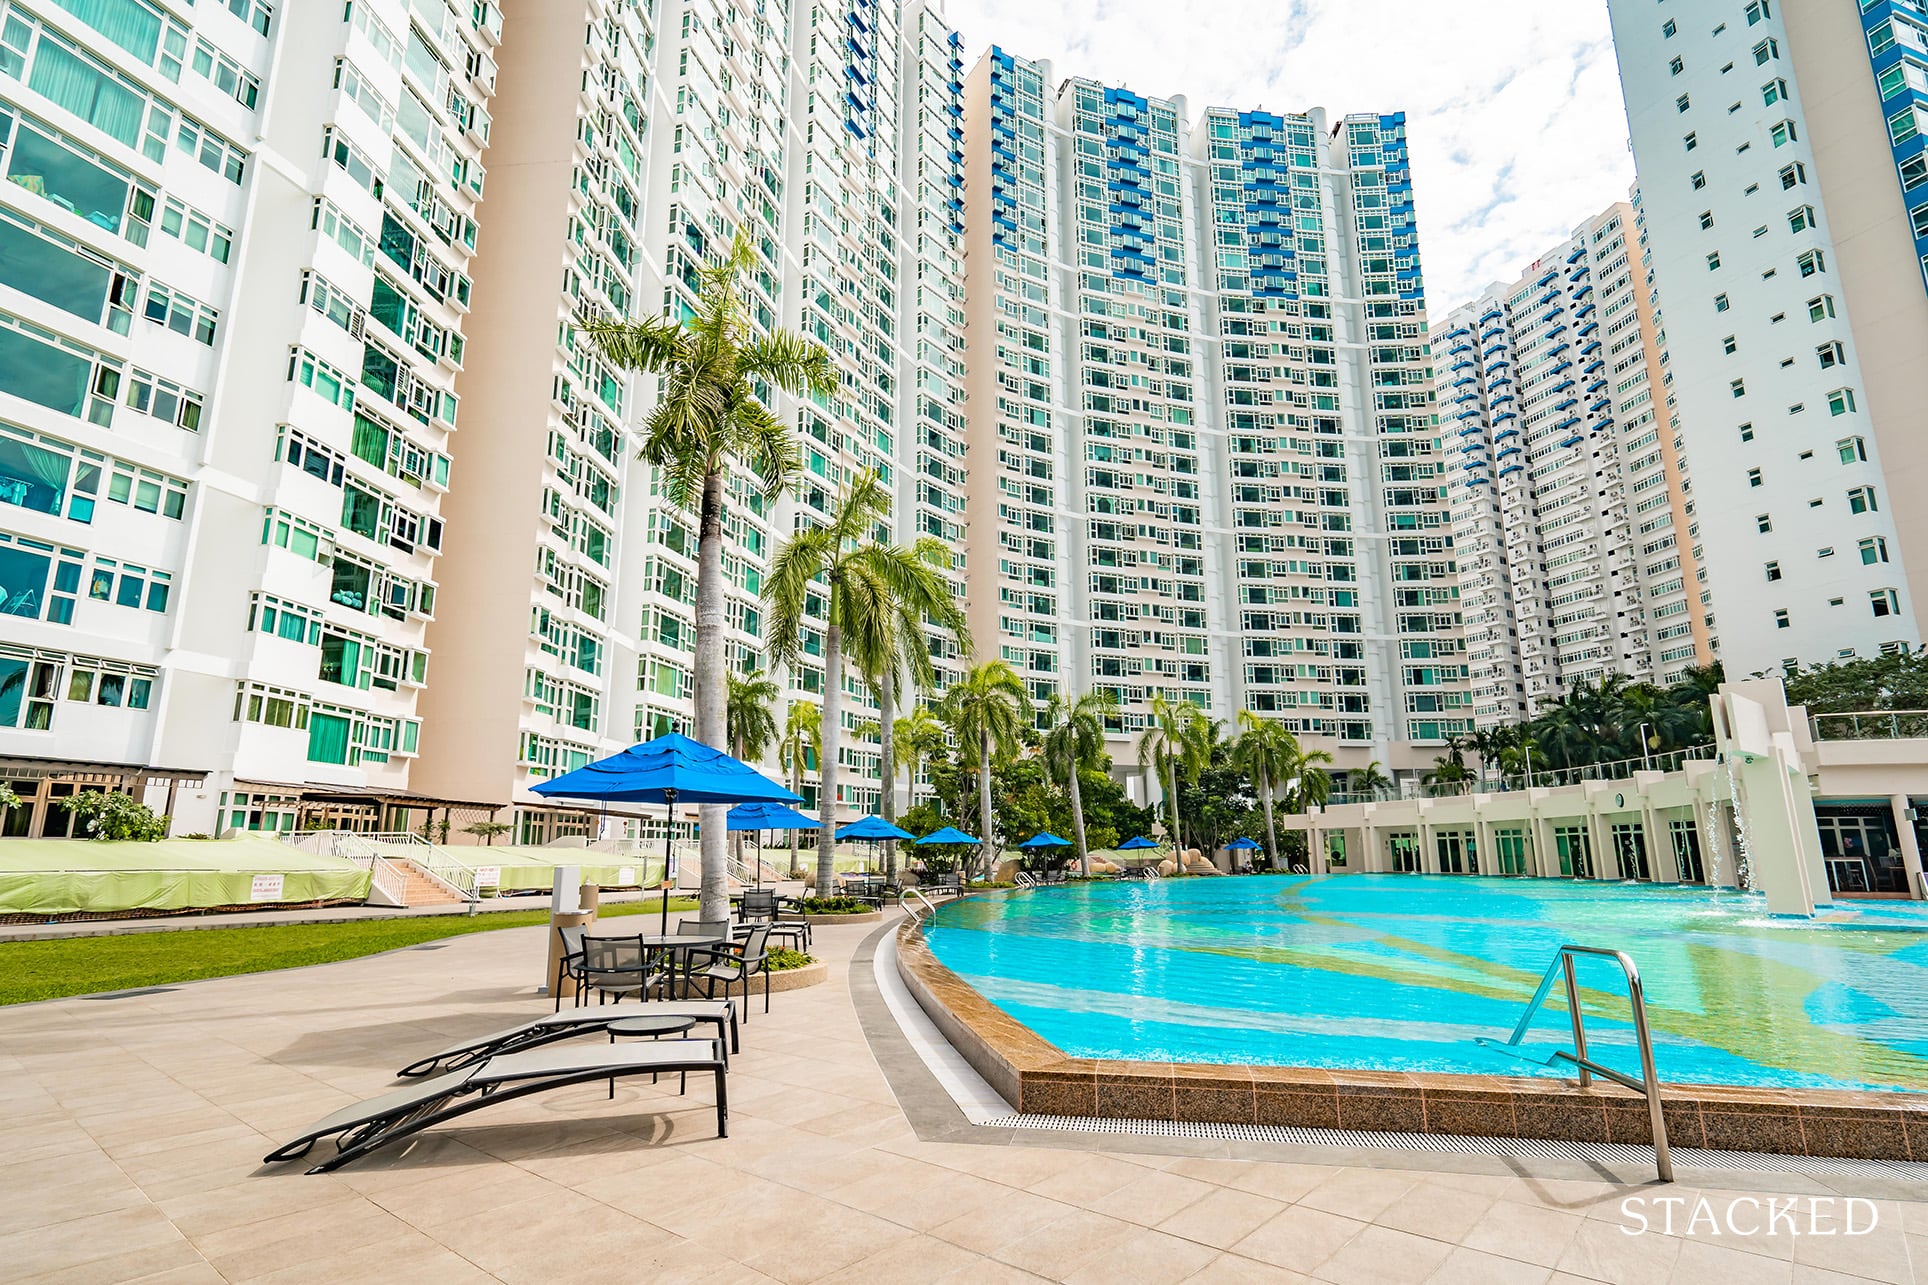
The Calypso, Breeze by the East, and Costa Del Sol still managed to see good gains in District 16. In the Bayshore area, the upcoming Bayshore MRT station (delayed till 2024) is helping to prop up values.
The main issue is sharp price decreases from Archipelago and Tanamera Crest. Archipelago saw price decreases during Covid-19, with average transactions at $307,500, or 29 per cent lower, than its initial purchase price. Meanwhile, Tanamera Crest saw average transactions with price decreases of $230,000.
Nearby District 15 is likely to have stolen the thunder, from the resale units here. A slew of launches in the nearby area – from Meyer House to Liv @ MB – likely holds the market’s attention for now.
Covid-19 is still not completely over yet
We may yet see further changes, impacting these districts as the pandemic goes on. You can see, however, that the main concerns are in prime districts like Orchard or Raffles.
Buyers in these areas tend to be investors, who don’t want to commit to high-quantum properties if they can’t predict the rental situation. As such, we can expect most of the action to be in the OCR, at least in the near term.
For more details on the situation as it unfolds, follow us on Stacked. We’ll also provide you with the most in-depth reviews of new and resale properties alike.
At Stacked, we like to look beyond the headlines and surface-level numbers, and focus on how things play out in the real world.
If you'd like to discuss how this applies to your own circumstances, you can reach out for a one-to-one consultation here.
And if you simply have a question or want to share a thought, feel free to write to us at stories@stackedhomes.com. We read every message.





0 Comments