


Boutique condos are something of a niche buy. Often with 100 units or less (in some cases even fewer than a dozen units), these projects are known to be typically volatile: transactions tend to be few, so even a single outlier can greatly skew prices up or down. Plus, there’s the issue of higher maintenance fees, given such a low unit count. But as some people love the exclusivity, a common question we’re asked is: where can I find a profitable boutique condo? We decided to take a look at some of the more successful ones to see what we can learn:
Past performance is a useful signal, but it's not a forecast. The projects that outperformed over the last cycle aren't guaranteed to do so again, and the reasons they outperformed may no longer apply.
The more useful question is whether a particular property still makes sense at today's price, given your budget, objectives and timeline. That's where many buyers find it helpful to get a second opinion.
Over time, that's also why we decided to work with agents who shared the same data-driven and advisory-led approach behind our editorial, consultants who could help readers think through decisions more objectively, rather than simply push transactions.
Today, the team has worked with more than 2,000 clients across over $5B in property transactions.
Gains and losses of boutique condos
The following shows transactions of boutique condos, between 2014 to 2024 with at least 5 buy/sell transactions:
| Projects | District | Planning Area | No. of Buy/Sell Tnx | Avg. Annualised (%) |
| LA SUISSE | 11 | Bukit Timah | 5 | 6.8% |
| LE CONNEY PARK | 15 | Bedok | 6 | 5.0% |
| CITY LOFT | 8 | Kallang | 6 | 4.8% |
| MABELLE | 15 | Bedok | 8 | 4.7% |
| THE PRINCETON | 10 | Tanglin | 6 | 4.7% |
| THE BALE | 15 | Bedok | 5 | 4.6% |
| VIENTO | 14 | Geylang | 6 | 4.5% |
| THE MEDLEY | 15 | Bedok | 5 | 4.4% |
| THE SPINNAKER | 11 | Novena | 5 | 4.3% |
| EVELYN MANSIONS | 11 | Novena | 5 | 4.1% |
| AXIS @ SIGLAP | 15 | Bedok | 6 | 3.8% |
| ONE TREE HILL RESIDENCE | 10 | River Valley | 5 | 3.7% |
| BLISS LOFT | 12 | Novena | 5 | 3.7% |
| PRESTIGE LOFT | 15 | Bedok | 5 | 3.5% |
| THE VUE | 19 | Serangoon | 5 | 3.3% |
| THE GLACIER | 15 | Bedok | 5 | 3.1% |
| DAISY SUITES | 13 | Serangoon | 5 | 2.9% |
| MAYFAIR RESIDENCES | 15 | Bedok | 7 | 2.6% |
| EDENZ SUITES | 14 | Geylang | 5 | 2.4% |
| THE SILVER FIR | 15 | Geylang | 5 | 2.2% |
| RESIDENCES 88 | 14 | Bedok | 5 | 2.1% |
| LAVERNE’S LOFT | 15 | Bedok | 6 | 2.1% |
| THE SANCTUARY @ GEYLANG | 14 | Geylang | 6 | 2.0% |
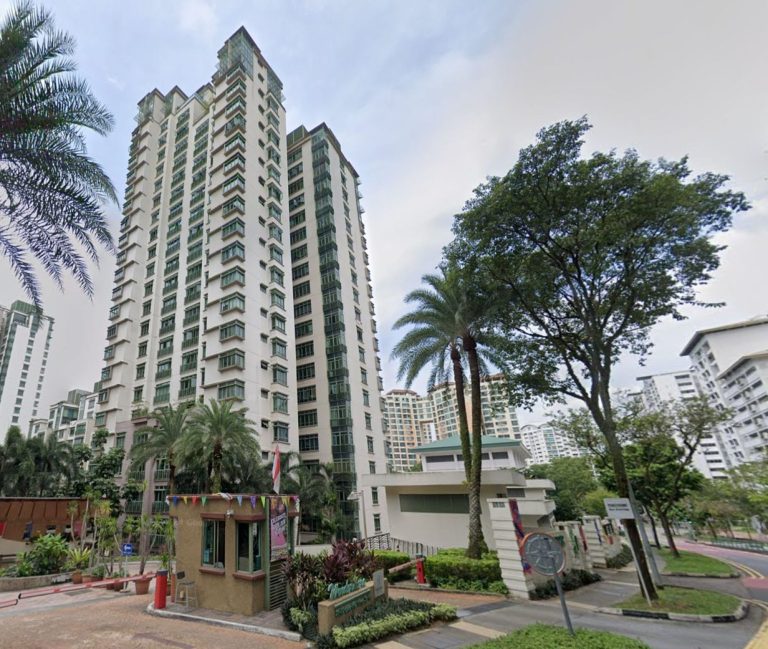
| PALMERA RESIDENCE | 15 | Bedok | 6 | 2.0% |
| DE CENTURION | 15 | Kallang | 5 | 1.9% |
| VIIO @ BALESTIER | 12 | Novena | 9 | 1.9% |
| CITIGATE RESIDENCE | 8 | Kallang | 5 | 1.9% |
| SUITES @ KOVAN | 19 | Hougang | 6 | 1.8% |
| NATURALIS | 15 | Bedok | 6 | 1.8% |
| LA FLEUR | 14 | Geylang | 6 | 1.7% |
| THE NAVIAN | 14 | Bedok | 11 | 1.7% |
| LOFT 33 | 14 | Geylang | 11 | 1.6% |
| SUITES @ EUNOS | 14 | Bedok | 5 | 1.6% |
| SUITES @ SIMS | 14 | Geylang | 6 | 1.5% |
| 24 ONE RESIDENCES | 5 | Queenstown | 5 | 1.5% |
| BERKELEY RESIDENCES | 15 | Bedok | 9 | 1.5% |
| FLORAVILLE | 28 | Ang Mo Kio | 10 | 1.5% |
| LEICESTER SUITES | 13 | Toa Payoh | 6 | 1.5% |
| DEVONSHIRE 12 | 9 | River Valley | 5 | 1.4% |
| THE BENTLY RESIDENCES@KOVAN | 19 | Hougang | 11 | 1.3% |
| ASCENT @ 456 | 12 | Novena | 11 | 1.3% |
| 8 FARRER SUITES | 8 | Kallang | 5 | 1.2% |
| PARK RESIDENCES KOVAN | 19 | Hougang | 5 | 1.2% |
| THE COTZ | 15 | Bedok | 9 | 1.1% |
| HILBRE28 | 19 | Hougang | 7 | 1.1% |
| 183 LONGHAUS | 20 | Bishan | 7 | 0.9% |
| MULBERRY TREE | 11 | Novena | 6 | 0.9% |
| REZI 35 | 14 | Geylang | 5 | 0.9% |
| LOFT@HOLLAND | 10 | Bukit Timah | 6 | 0.9% |
| PARC SOMME | 8 | Kallang | 5 | 0.8% |
| TREASURES@G6 | 14 | Geylang | 11 | 0.7% |
| TREASURES @ G20 | 14 | Geylang | 6 | 0.7% |
| VETRO | 12 | Kallang | 5 | 0.7% |
| R MAISON | 13 | Serangoon | 7 | 0.6% |
| WILKIE 80 | 9 | Rochor | 5 | 0.6% |
| SUNNYVALE RESIDENCES | 15 | Bedok | 7 | -0.4% |
| THE ASANA | 10 | Bukit Timah | 9 | -0.5% |
| 28 RC SUITES | 8 | Rochor | 6 | -0.6% |
The average annualised gain for the boutique condos above is around 3.57 per cent, which is in line with most private properties; but as you can see from One Robin (over 49 per cent annualised gain) and Casero @ Dunman (- 11.1 per cent loss), “average” may not mean much for this property segment.
One way to get a different picture is to look at boutique condos based on district:
| District | Breakeven | Gain | Loss | Grand Total | Total Volume |
| 27 | 9.5% | 9.5% | 1 | ||
| 21 | 6.3% | 6.3% | 11 | ||
| 26 | 5.6% | 5.6% | 1 | ||
| 3 | 5.0% | 5.0% | 4 | ||
| 10 | 5.6% | -2.9% | 5.0% | 147 | |
| 15 | 0 | 4.6% | -2.6% | 4.2% | 401 |
| 16 | 4.4% | -0.6% | 4.1% | 22 | |
| 17 | 4.4% | -1.7% | 4.0% | 17 | |
| 4 | 3.8% | 3.8% | 3 | ||
| 19 | 0 | 4.1% | -1.1% | 3.5% | 111 |
| 11 | 3.9% | -3.9% | 3.5% | 85 | |
| 9 | 0 | 3.8% | -2.4% | 3.5% | 79 |
| 23 | 4.8% | -2.9% | 3.2% | 5 | |
| 12 | 3.8% | -1.7% | 3.1% | 81 | |
| 1 | 2.9% | 2.9% | 1 | ||
| 13 | 2.8% | -1.6% | 2.7% | 29 | |
| 5 | 2.9% | -1.3% | 2.6% | 28 | |
| 14 | 0 | 3.0% | -1.1% | 2.5% | 186 |
| 8 | 3.6% | -3.8% | 1.7% | 75 | |
| 7 | 1.6% | 1.6% | 1 | ||
| 20 | 0 | 1.9% | -2.1% | 1.5% | 13 |
| 28 | 1.7% | -0.4% | 1.5% | 10 | |
| 6 | -0.4% | -0.4% | 1 | ||
| Grand Total | 0 | 4.1% | -2.2% | 3.6% | 1312 |
From the above, we can see that units 10 and 15 stand out for boutique projects:

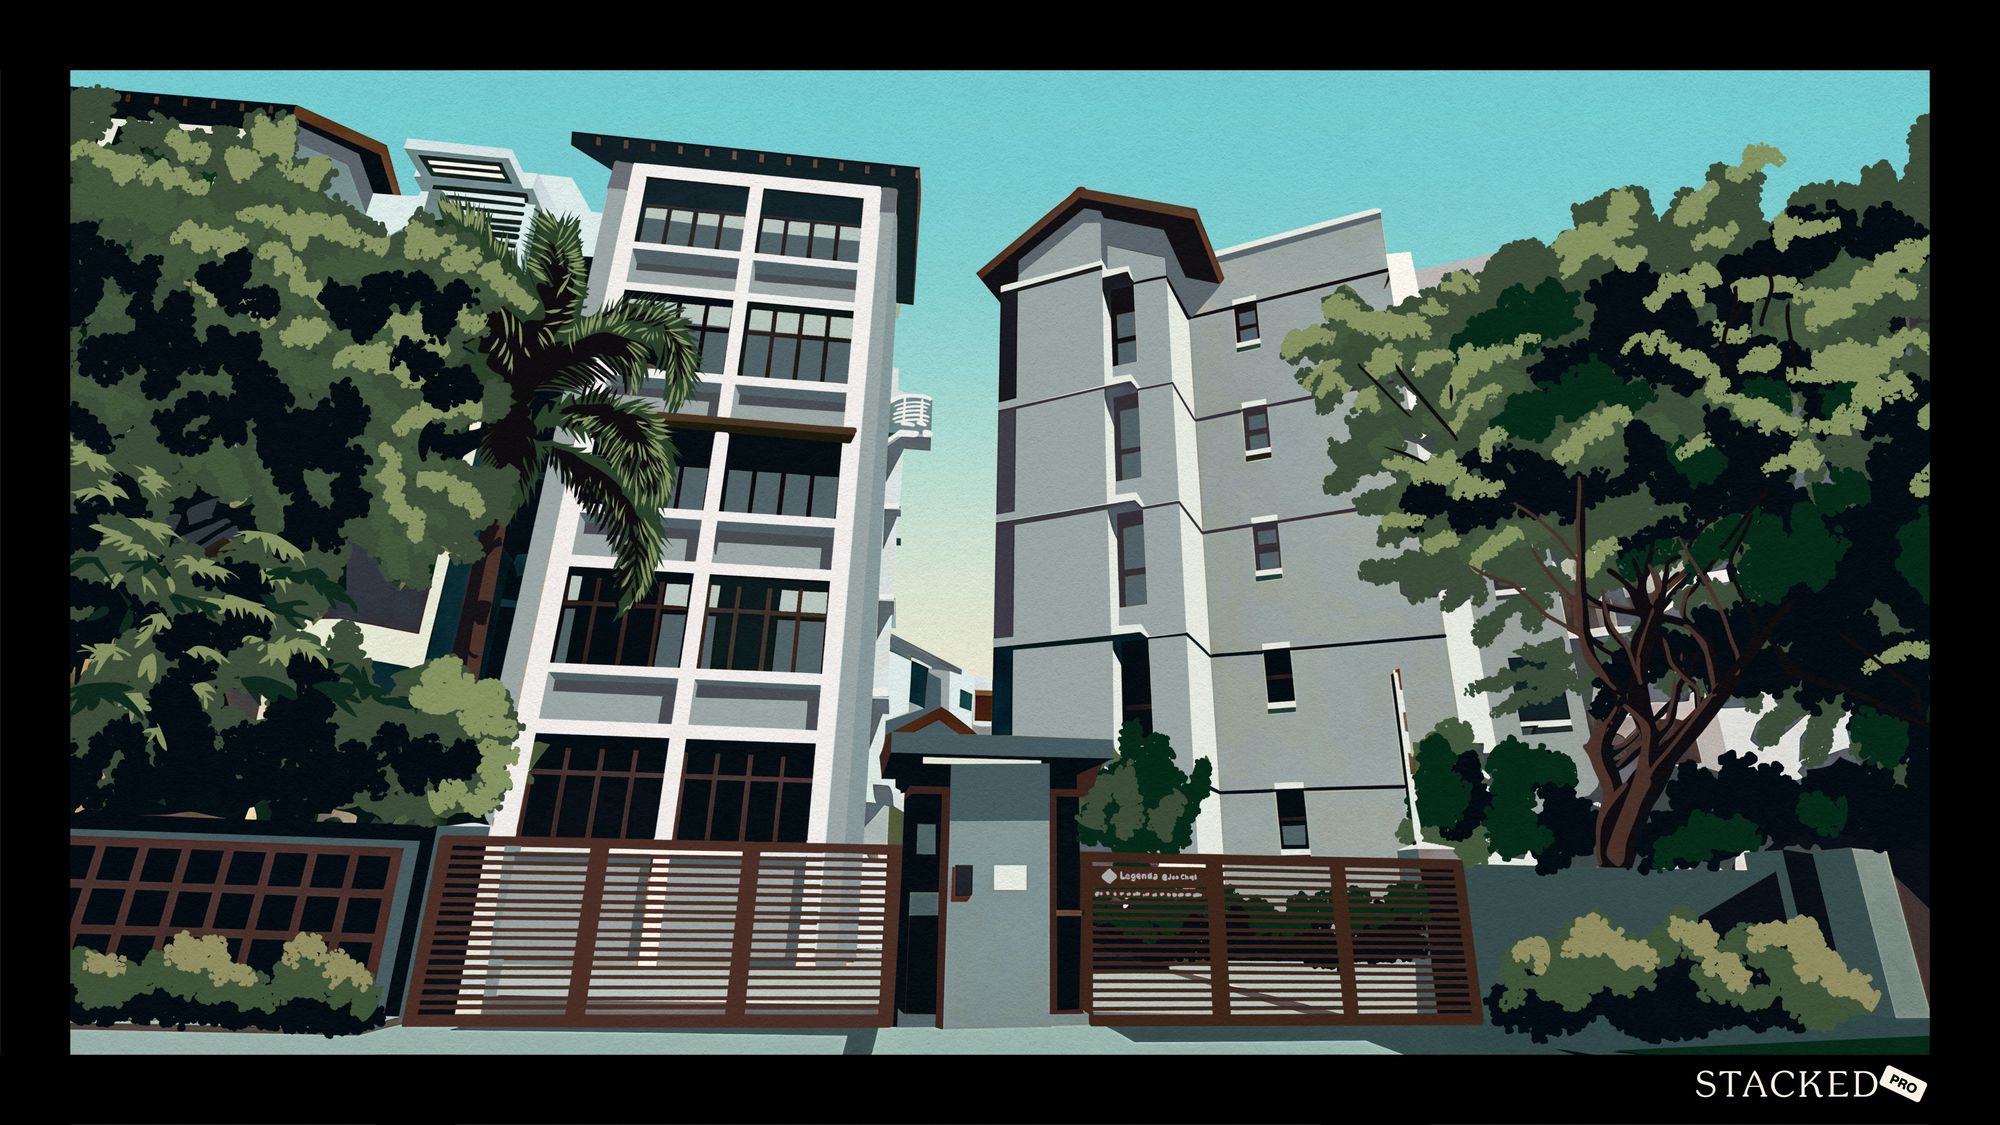
With regard to District 15, this is probably due to the large number of boutique condos in the Katong/Joo Chiat area. This provides a much higher transaction volume, which may also explain the higher annualised returns here.
(The exception to this would be Vibes @ East Coast and Casero @ Dunman, where the respective losses of 26.9 per cent and 11.1 per cent came from holding periods of less than a year. It’s fair to say, however, that the abnormally short holding periods make these outliers, with losses probably due to the sellers’ unique circumstances).
This may also be due to the gentrification of the Joo Chiat stretch, which in previous decades had a reputation for being sleazy (it was once full of massage parlours and shady bars). The boutique condos already in this area would have seen a turnaround in value as the area was cleaned up.
The neighbouring District 14 (the Eunos to Paya Lebar stretch) also has a good amount of transaction volume, albeit a lower annualised return. The properties in District 14 are likely to be older, and a bigger proportion may be rented out. Properties here are in a dense urban area, which some families dislike; but that also means they’re well positioned to take advantage of the nearby Paya Lebar hub.
District 10 (River Valley, Tanglin, Holland V, and the other ritzy neighbourhoods) is simply ideal for this sort of project. While there are many high-end condos in the area, affluent buyers tend to prefer a degree of exclusivity and privacy, and that’s something that boutique condos do well.
Looking at results by size
Here, we look at a scatterplot showing annualised returns versus square footage:
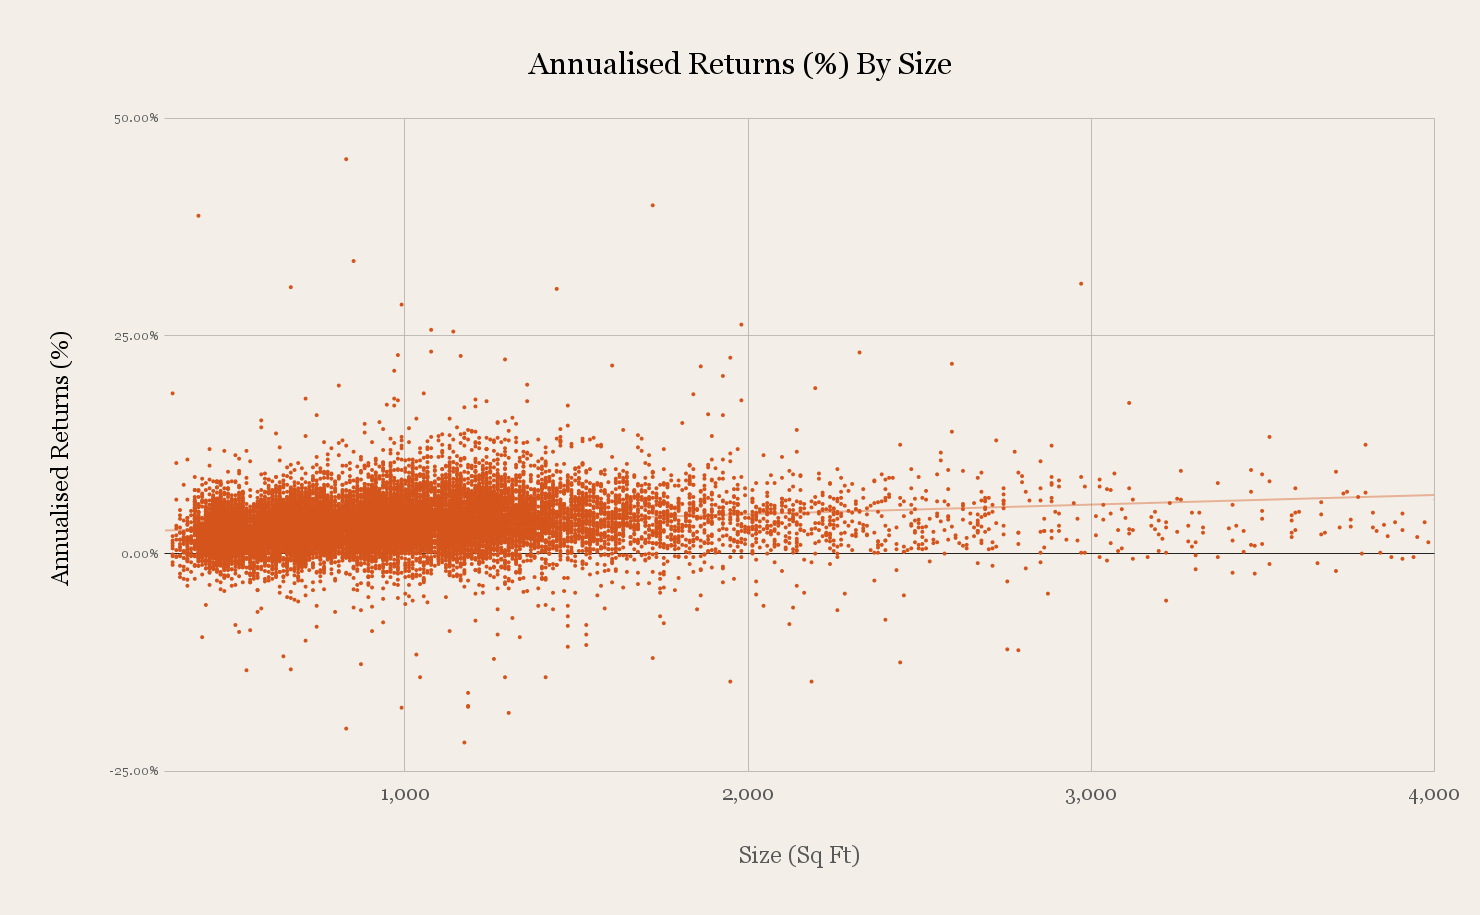
From this, we can make out that larger units tend to fare better for boutique condos; although this isn’t something that is relegated to just boutique condos.
| Size Category | Average Profit | Average % Profit | Average Annualised Returns (%) |
| Less Than 500 sq ft | $80,619.02 | 12.81% | 2.44% |
| Less Than 900 sq ft | $147,930.82 | 15.34% | 2.92% |
| Less Than 1,400 sq ft | $272,479.32 | 20.69% | 3.91% |
| More Than 1,400 sq ft | $489,416.63 | 21.84% | 4.27% |
| Grand Total | $227,220.66 | 17.80% | 3.39% |
Do notice that, while the returns rise with unit size, the transaction volume of bigger units is much lower. This is just because huge units tend to be scarcer, and this may also be a factor contributing to better returns.
We also speculate that larger units tend to be bought by pure owner-occupiers more often (landlords seldom want something so big, as there’s a cap on the maximum number of tenants, and the high quantum will diminish rental yields).
Owner-occupiers are also more likely than investors to pay above a unit’s valuation: their family’s comfort means more than resale gains to them. In addition, owner-occupiers tend to have a much longer holding period, and this can also account for their stronger gains.
A persistent problem with boutique condos, besides price volatility, is that they tend to go under the radar
Boutique condos aren’t just physically smaller and less visible, they also have a smaller market presence. Boutique condos are notoriously tough to move during property launch, for instance, as they tend to be from smaller developers, with lower budgets (they’re very reliant on agents’ networks and word-of-mouth).
Trust issues also play a part here, as a boutique project is more likely to carry a developer name you don’t recognise. The familiar big players like CapitaLand, GuocoLand, CDL, etc. are usually seen on full-size developments; so there’s a bit more uncertainty among buyers.
Historical performance is a useful signal, but it isn’t a forecast. The conditions that drove strong returns in one cycle aren’t always present in the next.
That’s why the more useful question is whether a specific property still represents the right purchase at today’s price, not simply whether it performed well in the past.
If you’d like to discuss how this applies to your own circumstances, you can reach out for a one-to-one consultation here.
And if you simply have a question or want to share a thought, feel free to write to us at stories@stackedhomes.com. We read every message.

0 Comments