


With home prices rising across the board, it seems the Singapore private property market is headed for another peak. In recent history, each major peak has been ended by cooling measures, resulting in a price decline soon after.
You might be familiar with the saying: “What goes up, must come down.” And those who’ve been waiting on the sidelines for prices to drop have continuously been repeating this mantra. So obviously it’s all everyone wants to know right now: if I buy now, is it a bad time? Does this mean most people who purchased their property at the peak will have lost money? Frankly, the answer is a bit complicated, but let’s look at the numbers from the last 2013 peak to see what we can glean from this.
An important note on the information to follow
For all of the following data, we excluded private homes that were sold within the first four years of purchase. This is because the earlier Sellers Stamp Duty (SSD) was over four years, rather than three.
All the home buyers would have been aware of SSD before buying, so any sales within the first four years would often be due to exceptional reasons (e.g., divorce, death of a co-owner, migration, and so forth). Including such sales would distort the figures, as they are outliers in which losses are almost certain.
This also means, however, that buyers in 2013 would have been struck by a double-whammy. Five years later, just when they were out of the SSD period, a new set of enhanced cooling measures kicked in. As such, buyers at the 2013 peak have gone through a rougher time, compared to buyers at other property peaks.
Lastly, the transaction data is taken from those who had bought a property in 2013 (close to the peak and just after the peak), and that exact property must have been sold 4 years after accounting for the SSD period to be included in this analysis. It isn’t a ton of data to work on, but let’s see how these buyers have fared.
Who among the 2013 buyers have seen gains or losses?
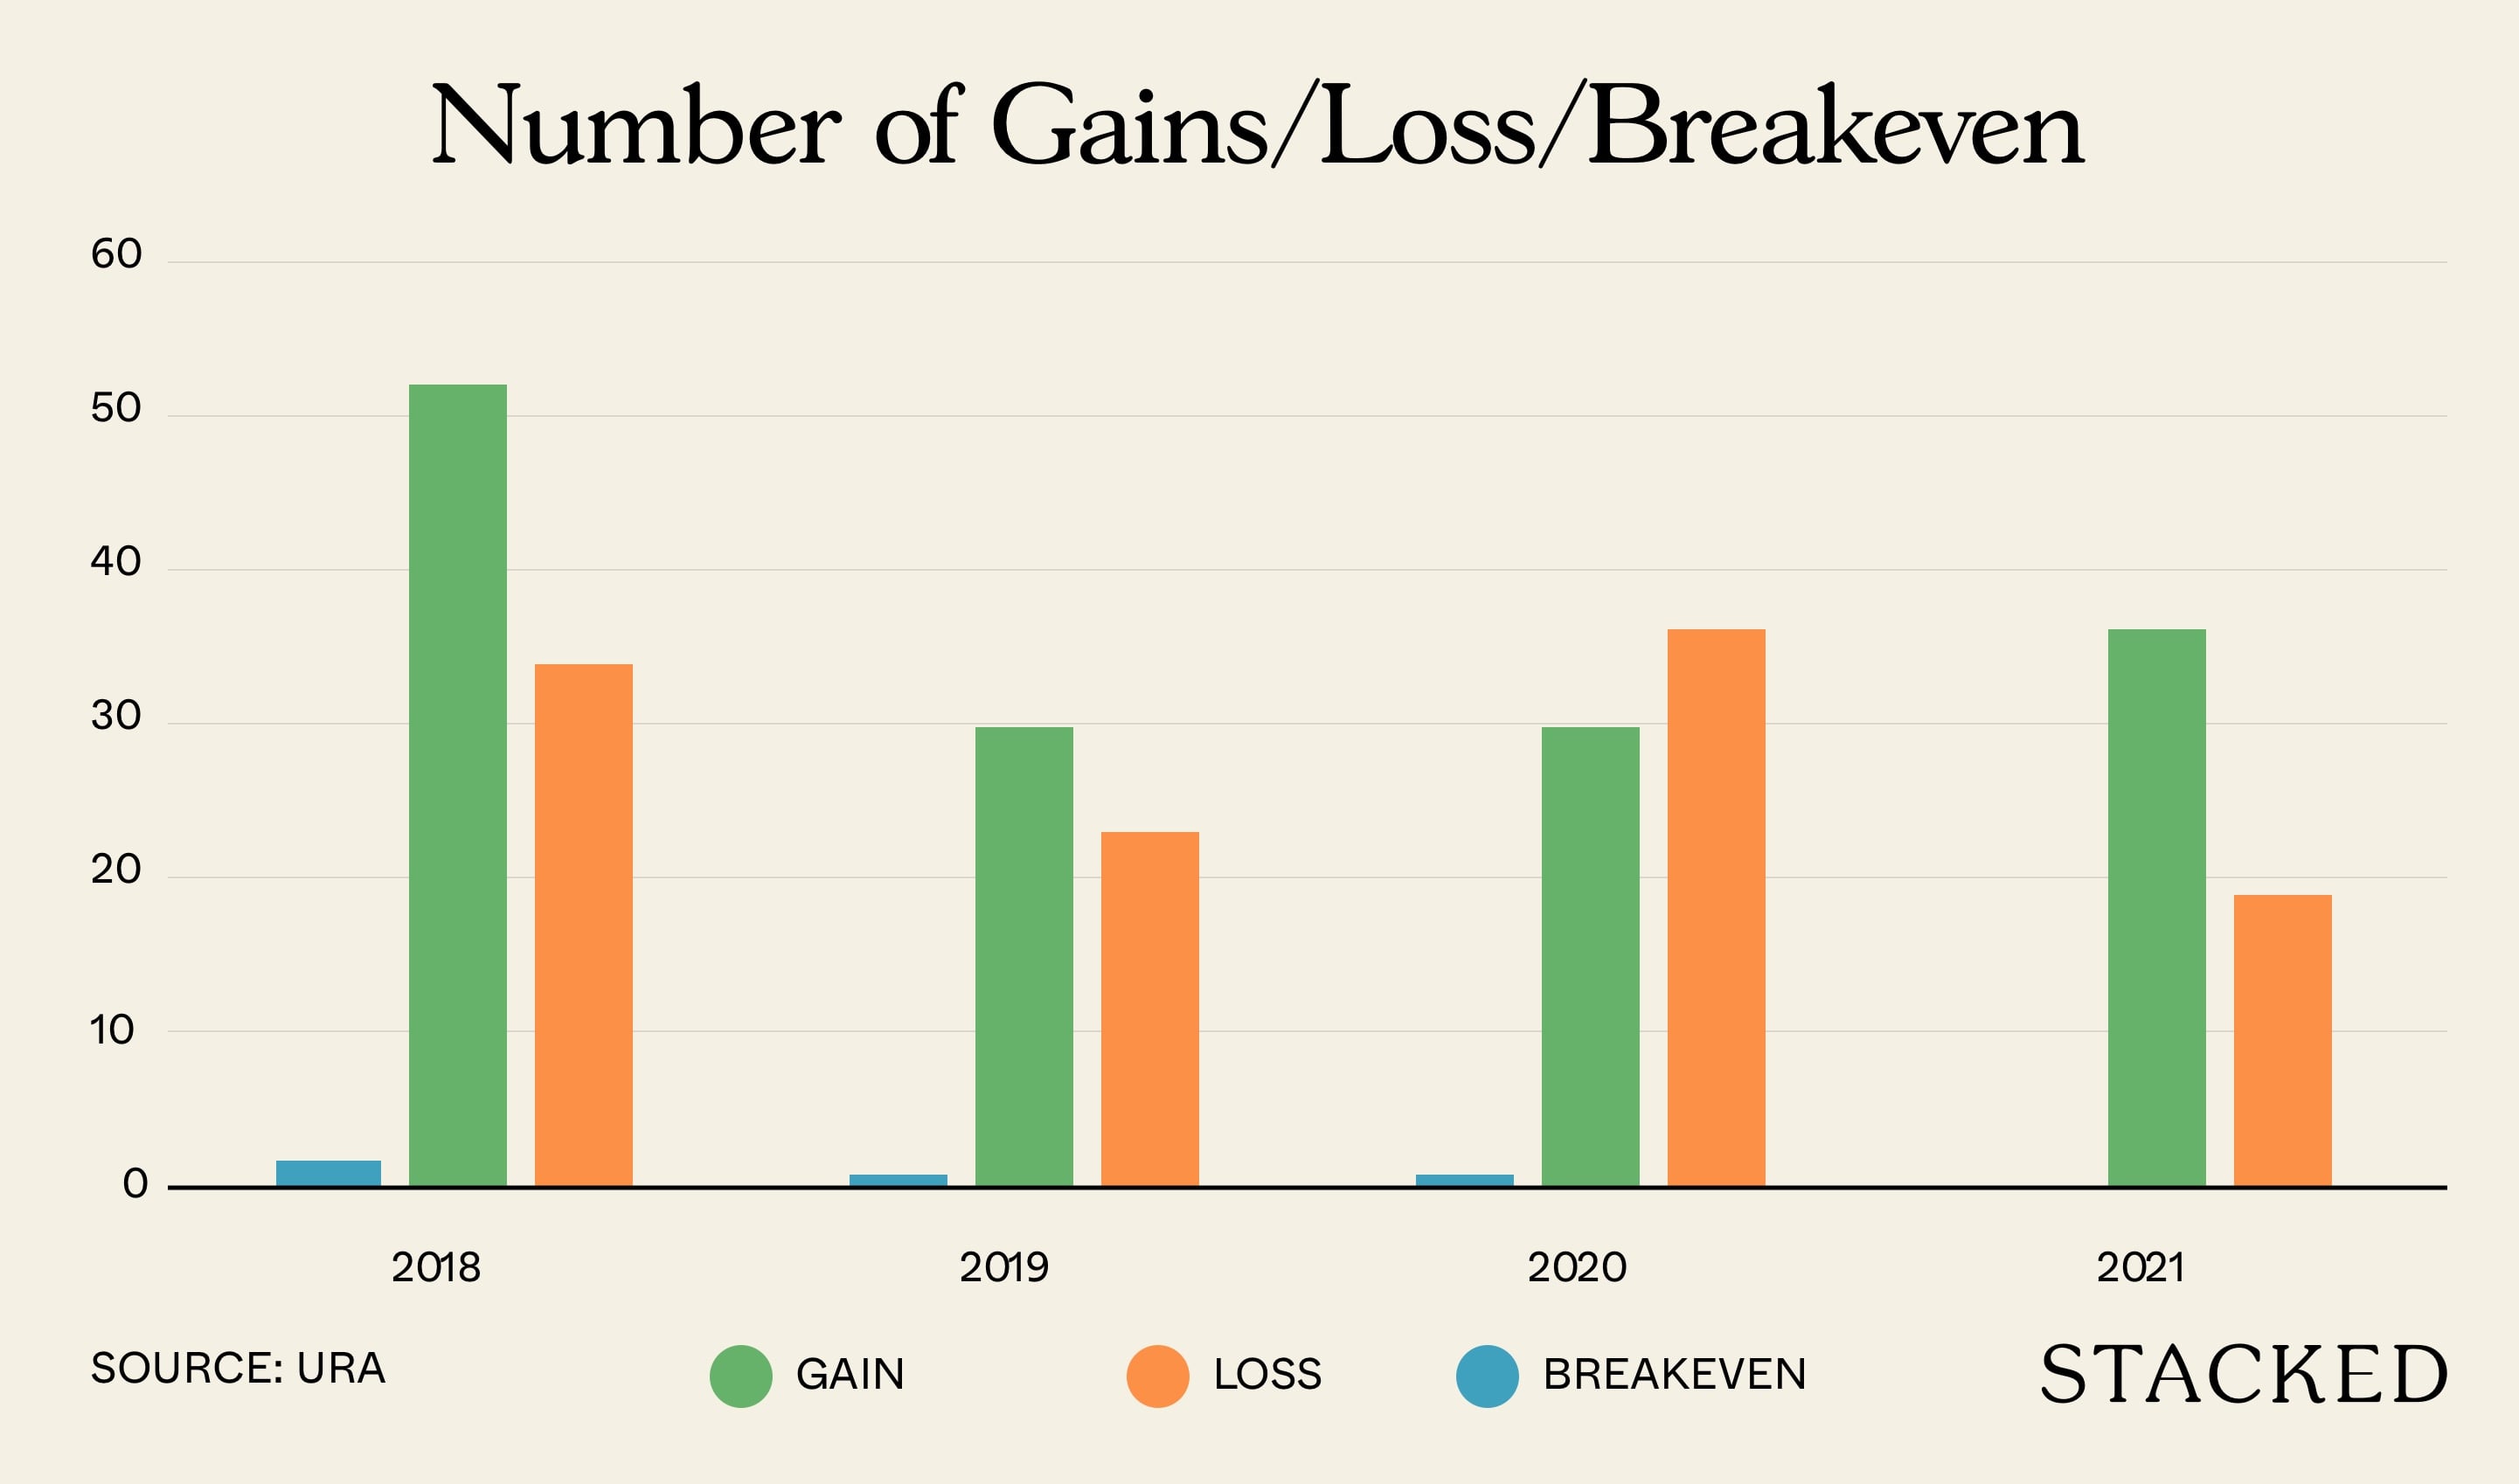
Starting from 2018 onward (as we’re excluding those who sold within the SSD period), this is what the numbers look like:
The following shows the gains by district. We’ve included both the median and average to give the full picture, but we would consider using the median so as to avoid distortions from extreme values.
| District | Median Gains | Average Gains | Median % Gains | Average % Gains | No. of Transactions | Average Holding Period (Years) |
| 1 | ||||||
| 2 | $8,000 | $8,000 | 1% | 1% | 1 | 6.0 |
| 3 | $125,000 | $118,400 | 8% | 9% | 5 | 6.3 |
| 4 | $74,000 | $74,000 | 5% | 5% | 2 | 6.4 |
| 5 | $210,000 | $210,000 | 17% | 17% | 2 | 6.4 |
| 7 | $25,000 | $25,000 | 3% | 3% | 1 | 5.0 |
| 8 | $30,000 | $76,667 | 2% | 6% | 3 | 7.2 |
| 9 | $75,000 | $119,737 | 5% | 7% | 19 | 6.0 |
| 10 | $171,500 | $207,291 | 10% | 9% | 16 | 6.4 |
| 11 | $112,000 | $159,111 | 7% | 9% | 9 | 6.7 |
| 12 | $81,000 | $97,375 | 6% | 7% | 8 | 6.0 |
| 13 | $163,000 | $163,000 | 14% | 14% | 2 | 6.4 |
| 14 | $80,000 | $100,714 | 6% | 8% | 14 | 6.6 |
| 15 | $130,000 | $145,602 | 9% | 11% | 48 | 6.4 |
| 16 | $306,500 | $306,500 | 28% | 28% | 2 | 6.4 |
| 17 | $88,000 | $88,000 | 11% | 11% | 2 | 6.5 |
| 19 | $70,000 | $92,697 | 6% | 8% | 7 | 6.7 |
| 22 | $40,000 | $40,000 | 4% | 4% | 1 | 6.9 |
| 23 | $28,444 | $54,315 | 4% | 5% | 6 | 6.4 |
| 27 | ||||||
| Total | $108,000 | $133,475 | 7% | 9% | 148 | 6.4 |
The following shows the losses by districts.
| District | Median Loss | Average Loss | Median % Loss | Average % Loss | No. of Transactions | Average Holding Period (Years) |
| 1 | -$300,000 | -$663,660 | -22% | -18% | 5 | 6.7 |
| 2 | -$133,000 | -$144,833 | -12% | -11% | 3 | 6.2 |
| 3 | ||||||
| 4 | ||||||
| 5 | -$75,044 | -$85,772 | -7% | -7% | 4 | 6.2 |
| 7 | -$170,000 | -$163,333 | -13% | -12% | 3 | 6.3 |
| 8 | -$85,000 | -$110,371 | -11% | -14% | 3 | 7.6 |
| 9 | -$120,000 | -$261,491 | -8% | -11% | 13 | 7.0 |
| 10 | -$128,840 | -$169,113 | -6% | -8% | 9 | 6.3 |
| 11 | -$117,000 | -$206,050 | -11% | -12% | 8 | 6.7 |
| 12 | -$80,000 | -$94,532 | -7% | -9% | 19 | 6.5 |
| 13 | -$110,000 | -$110,000 | -9% | -9% | 1 | 6.1 |
| 14 | -$77,500 | -$79,250 | -8% | -8% | 4 | 5.9 |
| 15 | -$50,000 | -$92,133 | -4% | -7% | 15 | 6.3 |
| 16 | -$30,000 | -$56,296 | -5% | -6% | 3 | 6.9 |
| 17 | ||||||
| 19 | -$60,000 | -$80,976 | -6% | -8% | 13 | 6.0 |
| 22 | ||||||
| 23 | -$71,000 | -$68,375 | -8% | -7% | 8 | 6.0 |
| 27 | -$690,000 | -$690,000 | -39% | -39% | 1 | 5.7 |
| Total | -$90,044 | -$156,701 | -8% | -9% | 112 | 6.4 |
There were 4 breakeven transactions. They were found in districts 11, 12, 15 and 16 and had an average holding period of 6 years.
Some conclusions we can draw from the above
- It is possible to see gains even if you buy at the last peak
- Overall, gains tend to outweigh losses
- The likelihood of gains corresponds to holding power
- Common assumptions regarding district are difficult to verify
1. It is possible to see gains even if you buy at the last peak
As you can see from the above, by 2018 the number of profitable transactions was much higher than the number of losing transactions. This was also true for 2019, and so far in 2021.
(While unprofitable transactions were higher in 2020, this was due to the Covid-19 pandemic reaching its height).
This is consistent with the historical norms of Singapore’s real estate market, where each property peak has managed to be higher than the last:
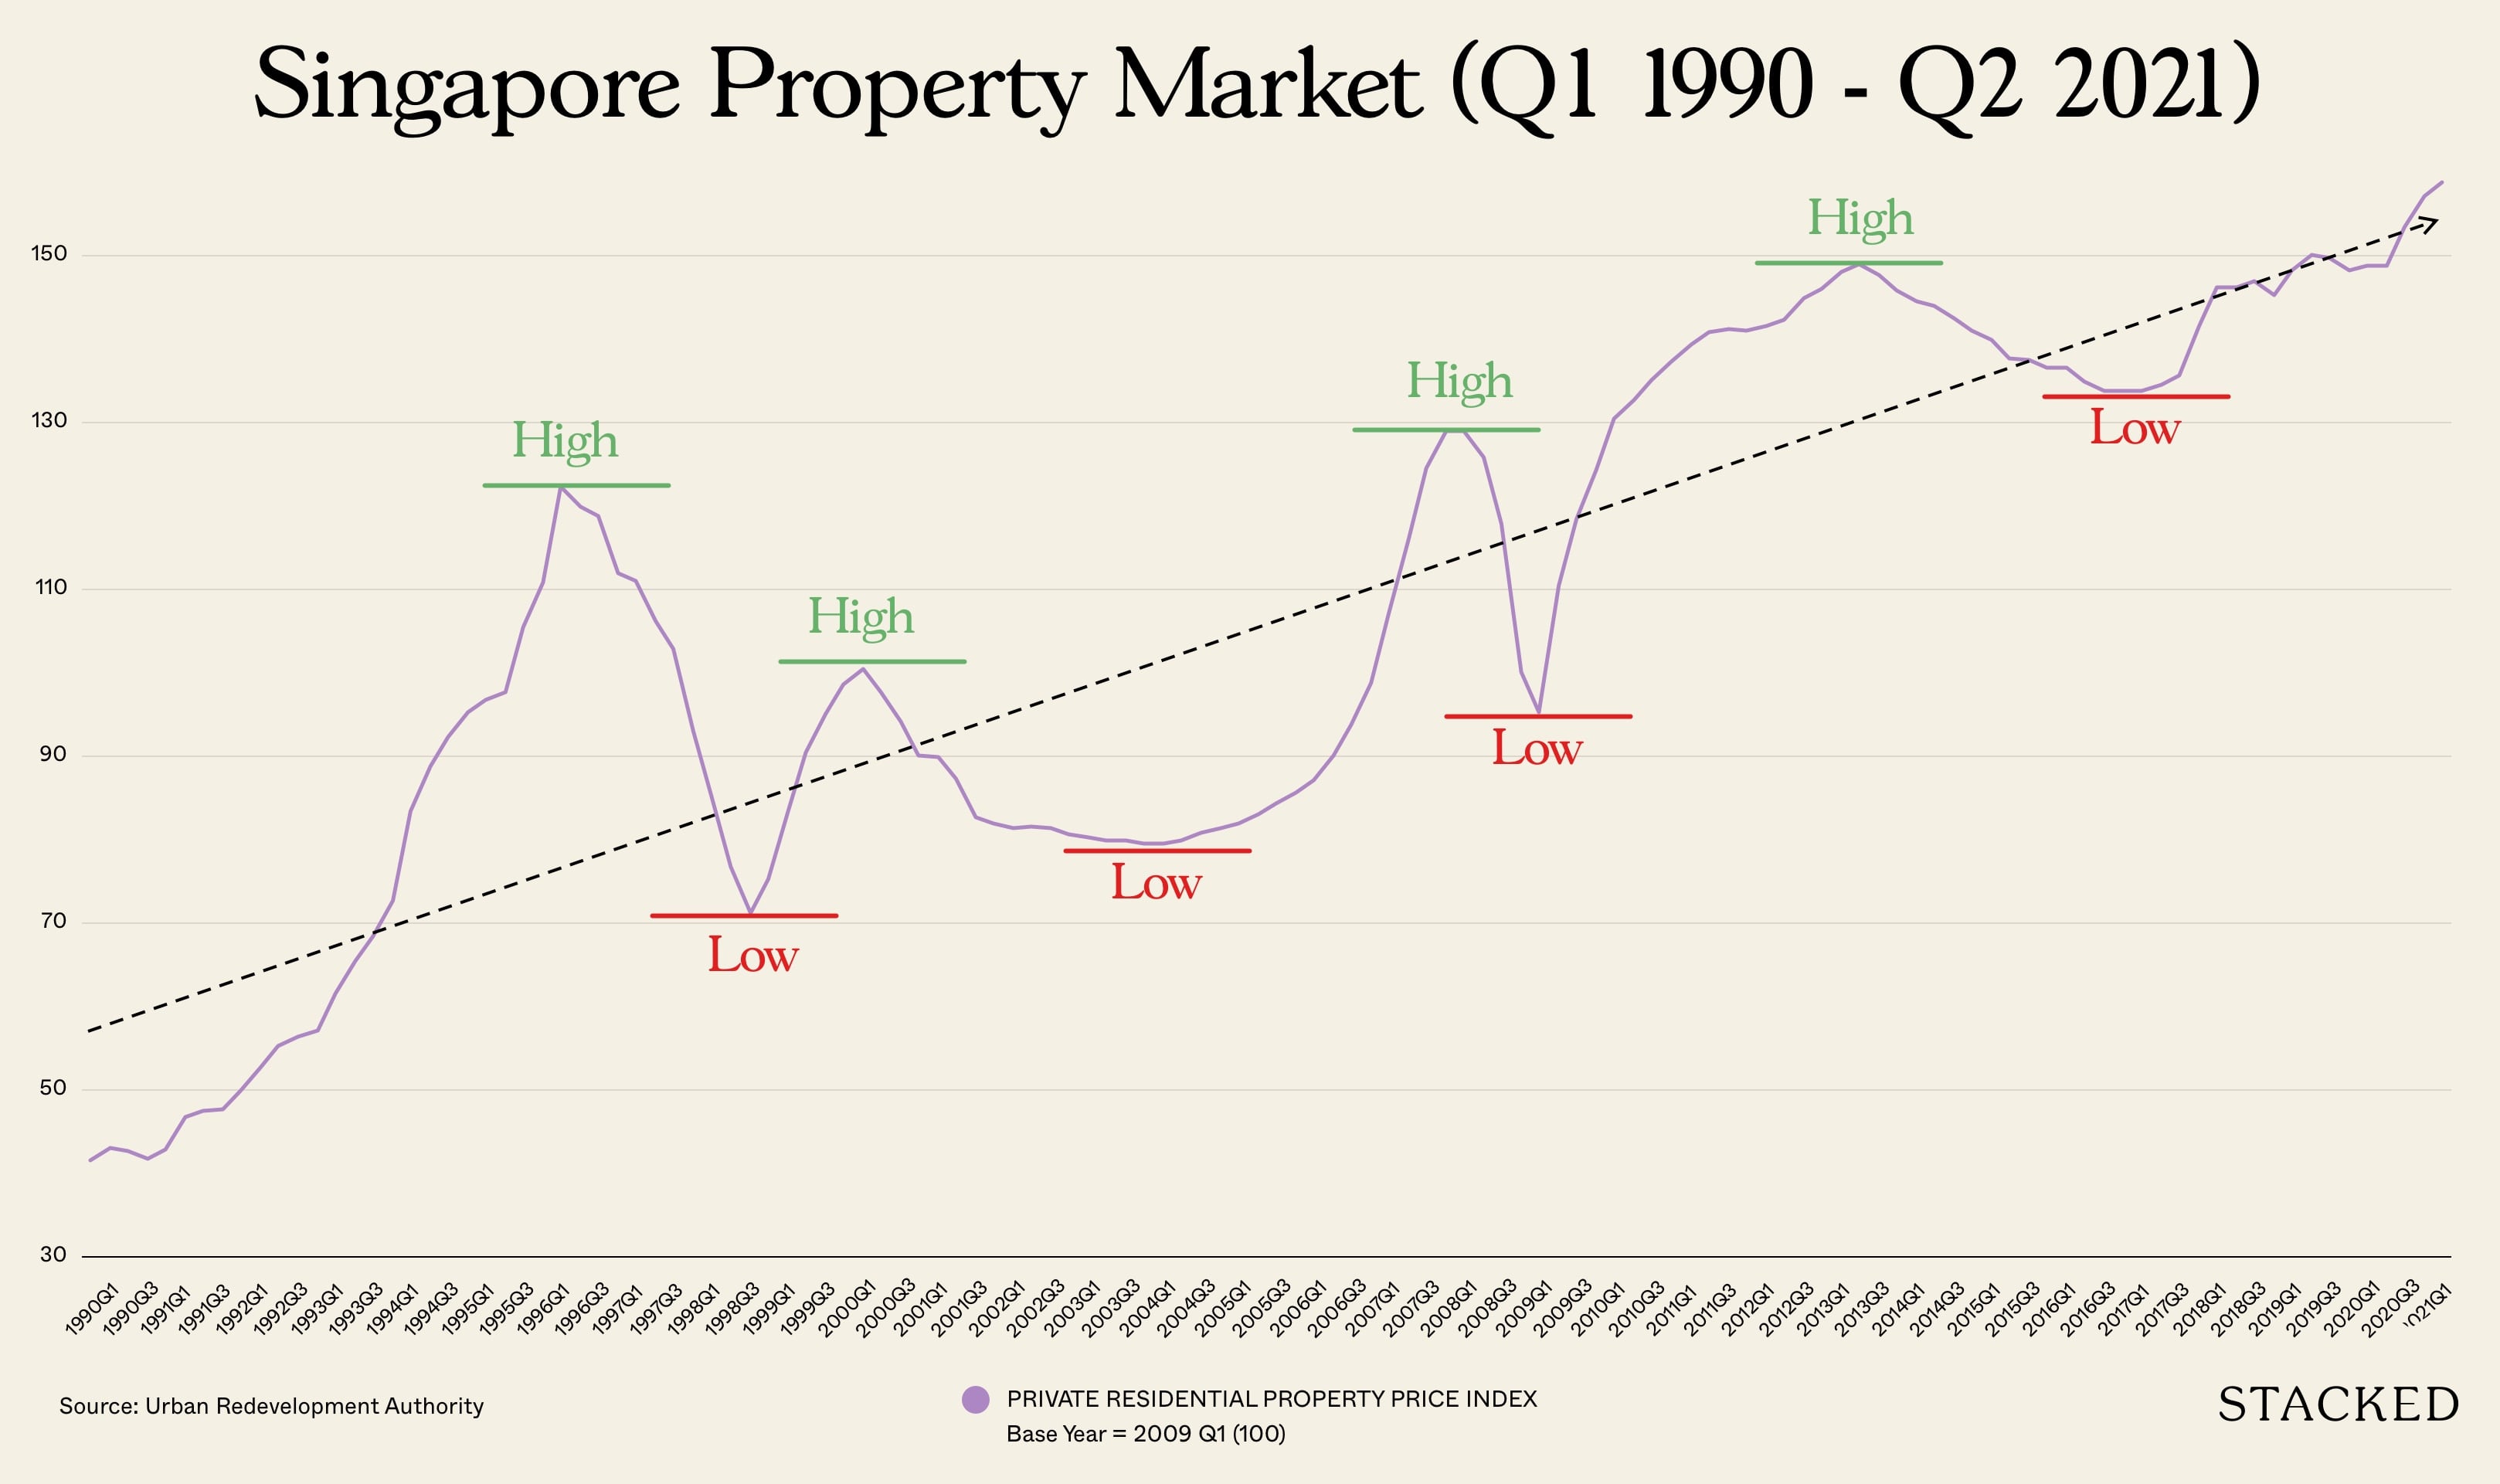
As we’ve mentioned in our article on property cycles, there is usually a sharp drop following the last peak – this is partly due to the speed of policy changes like cooling measures, which kick in overnight and “shock” the market.
However, many buyers will see prices recover, and even go past their previous peak, in as little as five years or under.
That said, please don’t conflate possibility with guarantee
This isn’t to guarantee that every property, even when bought at peak price, will definitely show gains. And of course, you have more room for gains if you don’t buy at the peak (whatever crystal ball one might have to know that).
What this basically shows is that, if you pick a decent unit and have sufficient holding power (see below), even buying at a peak may not be an irrecoverable error.
2. Overall, gains tend to outweigh losses
As you can see above, median losses are at $90,044, whereas median gains are at $108,000. On average, most districts also see more profitable than unprofitable transactions.
This runs contrary to the belief that “almost everyone” who bought in 2013 ended up seeing losses, or made the worst investment.
(But their gains are, of course, nowhere close to their counterparts who bought into property at around ’09, when the market was starting to ramp up). For sure if you bought at the right time, you would be in a very safe (and advantageous position).
3. The likelihood of gains corresponds to holding power
Because each property peak is higher than the last, holding power can matter more than when you buy. So long as you can ride out the downturns, you can still see gains:
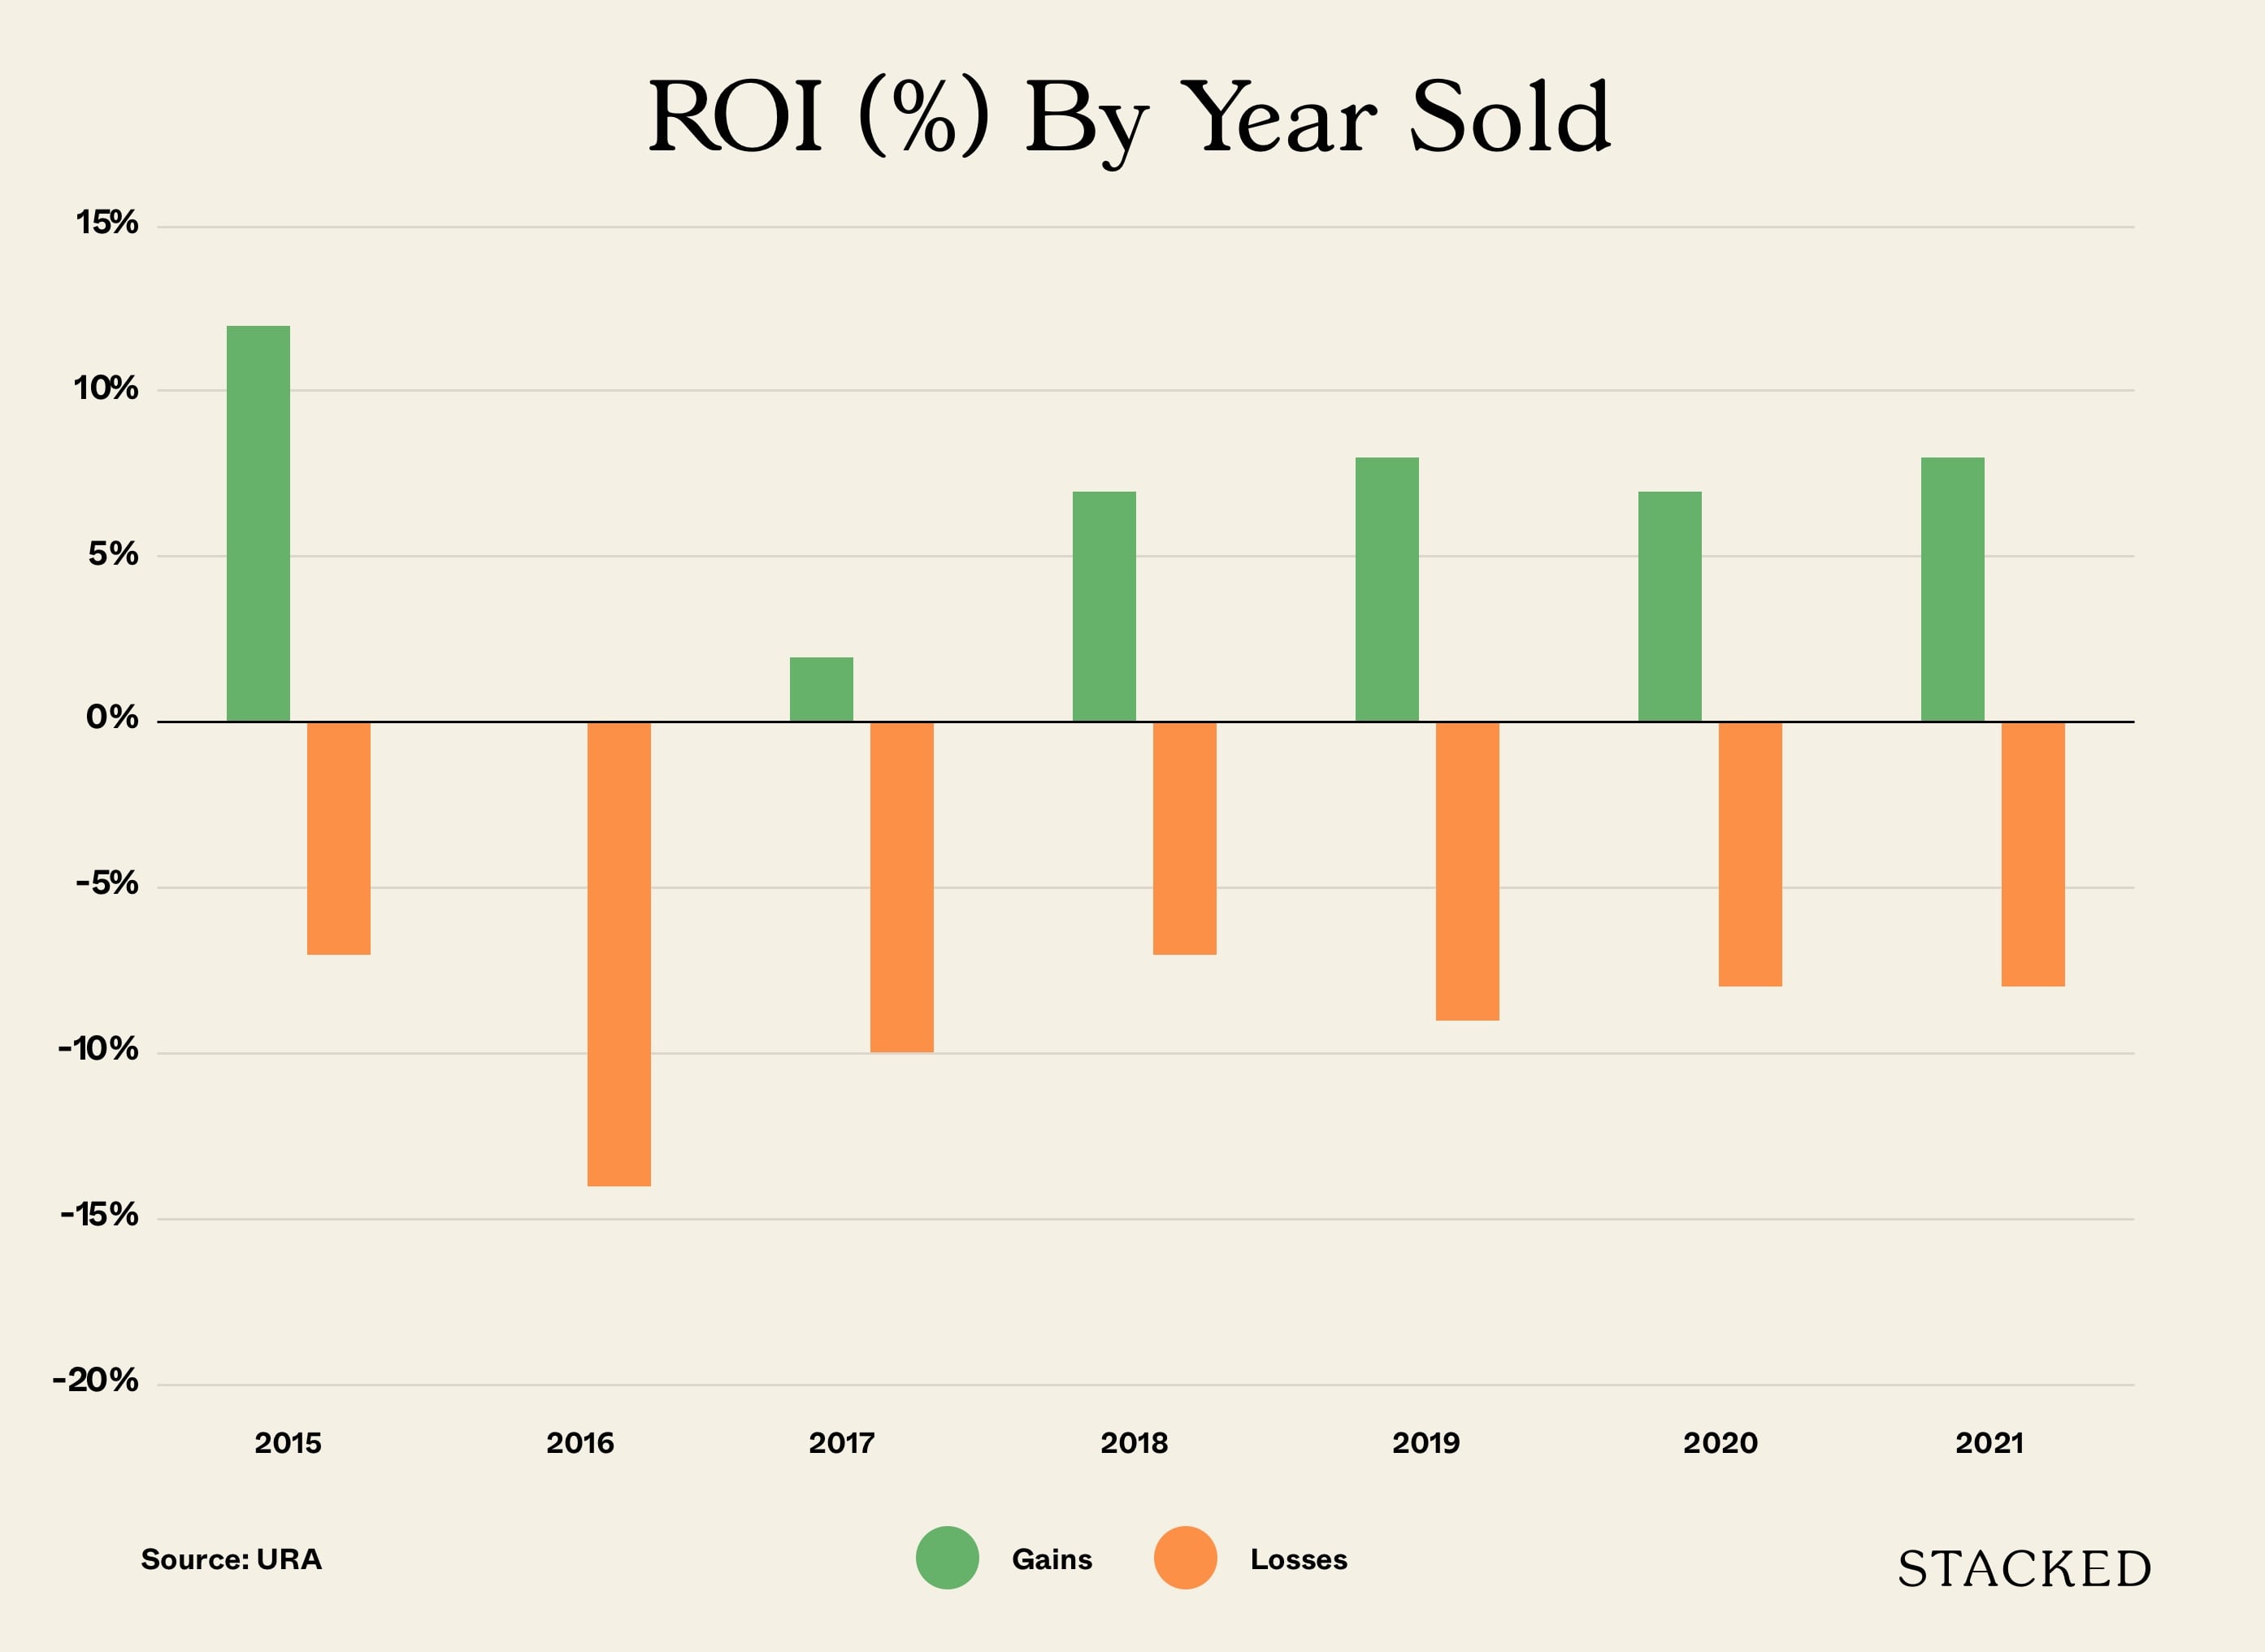
And here’s the number of profitable vs unprofitable transactions by year sold:

Unsurprisingly, many of those who sold within the SSD period incurred losses. Having to sell within the 4 year period is usually as a result of extenuating circumstances. (2014 was excluded due to too few transactions in that year).
At present, the SSD takes 12 per cent of your sale proceeds in the first year, eight per cent in the second year, and four per cent in the third year.
(The SSD also applies in an en-bloc sale, by the way).
Those that sold for a gain during this SSD period made enough to justify the sale.
As you can see from the chart, losses have been a greater proportion for 2013 buyers with the exception of 2018-2019 (the en bloc fever years). 2020 did result in a greater number of losses for these buyers, and we highlighted the Covid-19 pandemic as a possible reason. However, 2021 saw the greatest proportion of gains to losses for these buyers.
Admittedly, while we don’t have enough “good years” to show a strong relationship yet because it’s not long enough (we’ve only just surpassed the last peak), we can say that by going from 2021 so far, it’s safe to say that holding it longer would obviously be better.
To some extent, changes to home loans now enforce this – the Mortgage Servicing Ratio (MSR) and Total Debt Servicing Ratio (TDSR) prevent over-leveraging, and explain the strength of the seller’s market in 2021.
Few sellers are struggling to meet the mortgage, and can wait for the price they want. This is the future category you want to find yourself in, whatever the year you choose to buy.
Try to keep your loan repayments below 30 per cent of your monthly income, the less the better of course. This will minimise the risk of a fire sale, if you run into a crisis.
4. Common assumptions regarding district are difficult to verify
Despite many “truisms” hammered into our heads, assumptions regarding district are hard to prove (and may never be proven).
For example, it was a common saying that prime region properties – referring to the Core Central Region – will hold their value best, even during a downturn. But some prime districts, such as district 01 (Chinatown, Raffles Place) have seen worse results than some fringe districts.
Likewise, district 16 (Bedok) saw the best median gains by percentage, despite being in the Outside of Central Region (OCR).
There are too many moving parts to get a clear picture here, with possible distortions from low transaction numbers, to an unusually higher number of launches in a given year (a large number of new launches will pull up prices of nearby resale condos as well).
We can’t say for sure if CCR, RCR, or OCR properties from 2013 have fared better. It would seem a bigger determinant of performance is how long the properties are held (and of course, picking the right property and entry price).
Finally, remember that just because you buy at a high point of the market, it doesn’t mean you will be on the losing end once the market starts to fall
Sure, if you bought at a high and are looking to exit in as short a time as possible, you probably wouldn’t be in a good place once the market starts to fall. But nobody can predict the future, many people forget to account for human psychology and behaviour – and in Singapore, the big issue of Government intervention.
There are always people selling under unusual circumstances, who may need a speedy transaction more than a higher price. Likewise, as the launch of Pasir Ris 8 shows, developers sometimes give a bigger-than-intended discount to the first batch of buyers.
Ultimately, time in the market beats timing the market all day. If you have to buy now and have a strong motive to do so (family planning, need a bigger space, lifestyle benefits), having the holding power is the most important thing. As past history has shown time and time again, every new low will be higher than the last, and every high has been higher than the last too.
Every property transaction tends to be driven by unique motives; and it is always crucial to pick the right property as this will be something that you will have to stick with for the next couple of years. Let us know what you’re searching for at Stacked, and we can help. You can also get the latest reviews of new and resale properties alike, by giving us a follow.
At Stacked, we like to look beyond the headlines and surface-level numbers, and focus on how things play out in the real world.
If you’d like to discuss how this applies to your own circumstances, you can reach out for a one-to-one consultation here.
And if you simply have a question or want to share a thought, feel free to write to us at stories@stackedhomes.com — we read every message.
0 Comments