

There’s a saying that there are decades when nothing happens, and there are weeks when decades happen. That feels about right for the roller-coaster year of 2020, which was unprecedented for the Singapore property market: from a never-before Circuit Breaker that put an end to show flats and viewings, to a quarter that saw the worst economic contraction on record.
To date, the property market has shown remarkable resilience: the Singapore property market has ended 2020 with no surge in panicked selling or surge in mortgagee sales. However, we’re not out of the woods yet, as buyers and sellers brace for any potential fallout from the Covid-19 aftermath.
Here’s a year-end look at where the overall market stands:
The challenge for many buyers today isn't access to information.
It's interpreting that information in a way that makes sense for their finances, goals, and stage of life.
Over time, that's also why we decided to work with agents who shared the same data-driven and advisory-led approach behind our editorial, consultants who could help readers think through decisions more objectively, rather than simply push transactions.
Today, the team has worked with more than 2,000 clients across over $5B in property transactions.
31 December 2021 Update: Transaction figures have been updated to reflect the latest data.
Non-landed private properties
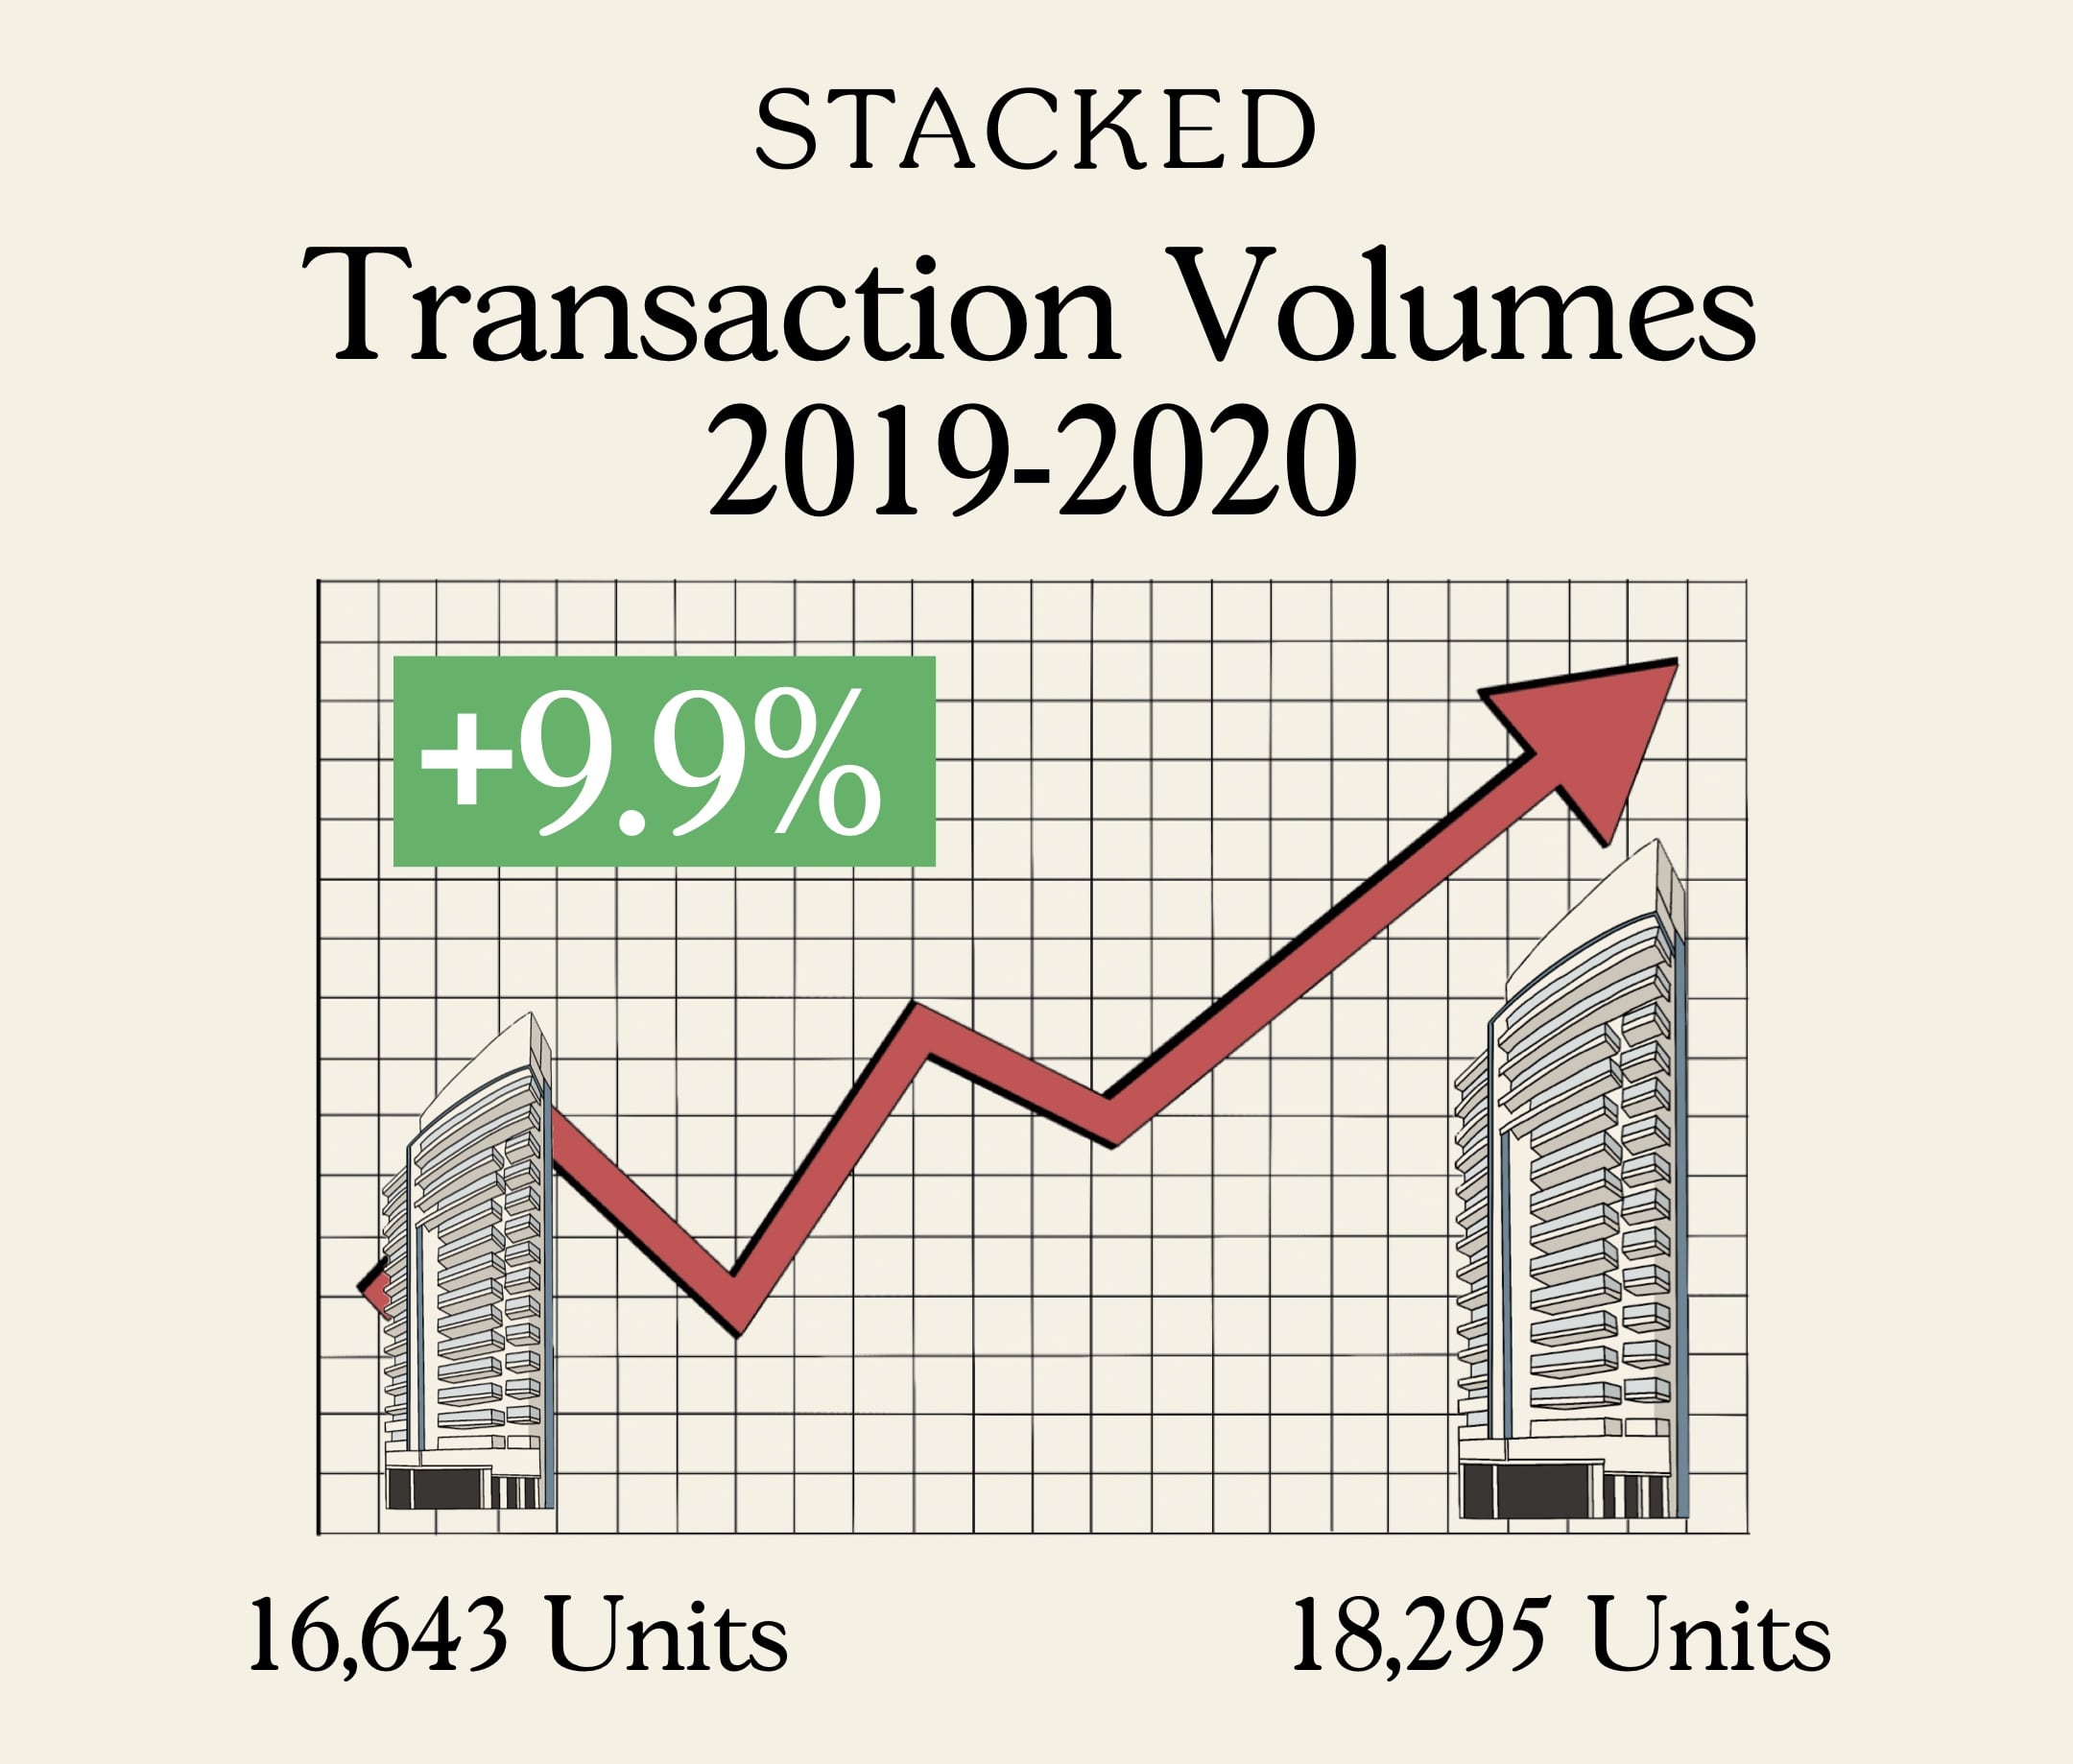
Total transaction volumes for private non-landed properties (excluding ECs) amounted to 18,295 for the whole of 2020. This is a 9.92 per cent increase from 2019, when total transaction volume came to 16,643 units.
Of the total transactions, 9,368 were new launch properties, while 8,749 were resale properties. Compared to the year before, this is a 6.0 per cent increase for new launch sales and a 15.9 per cent increase for resale units.
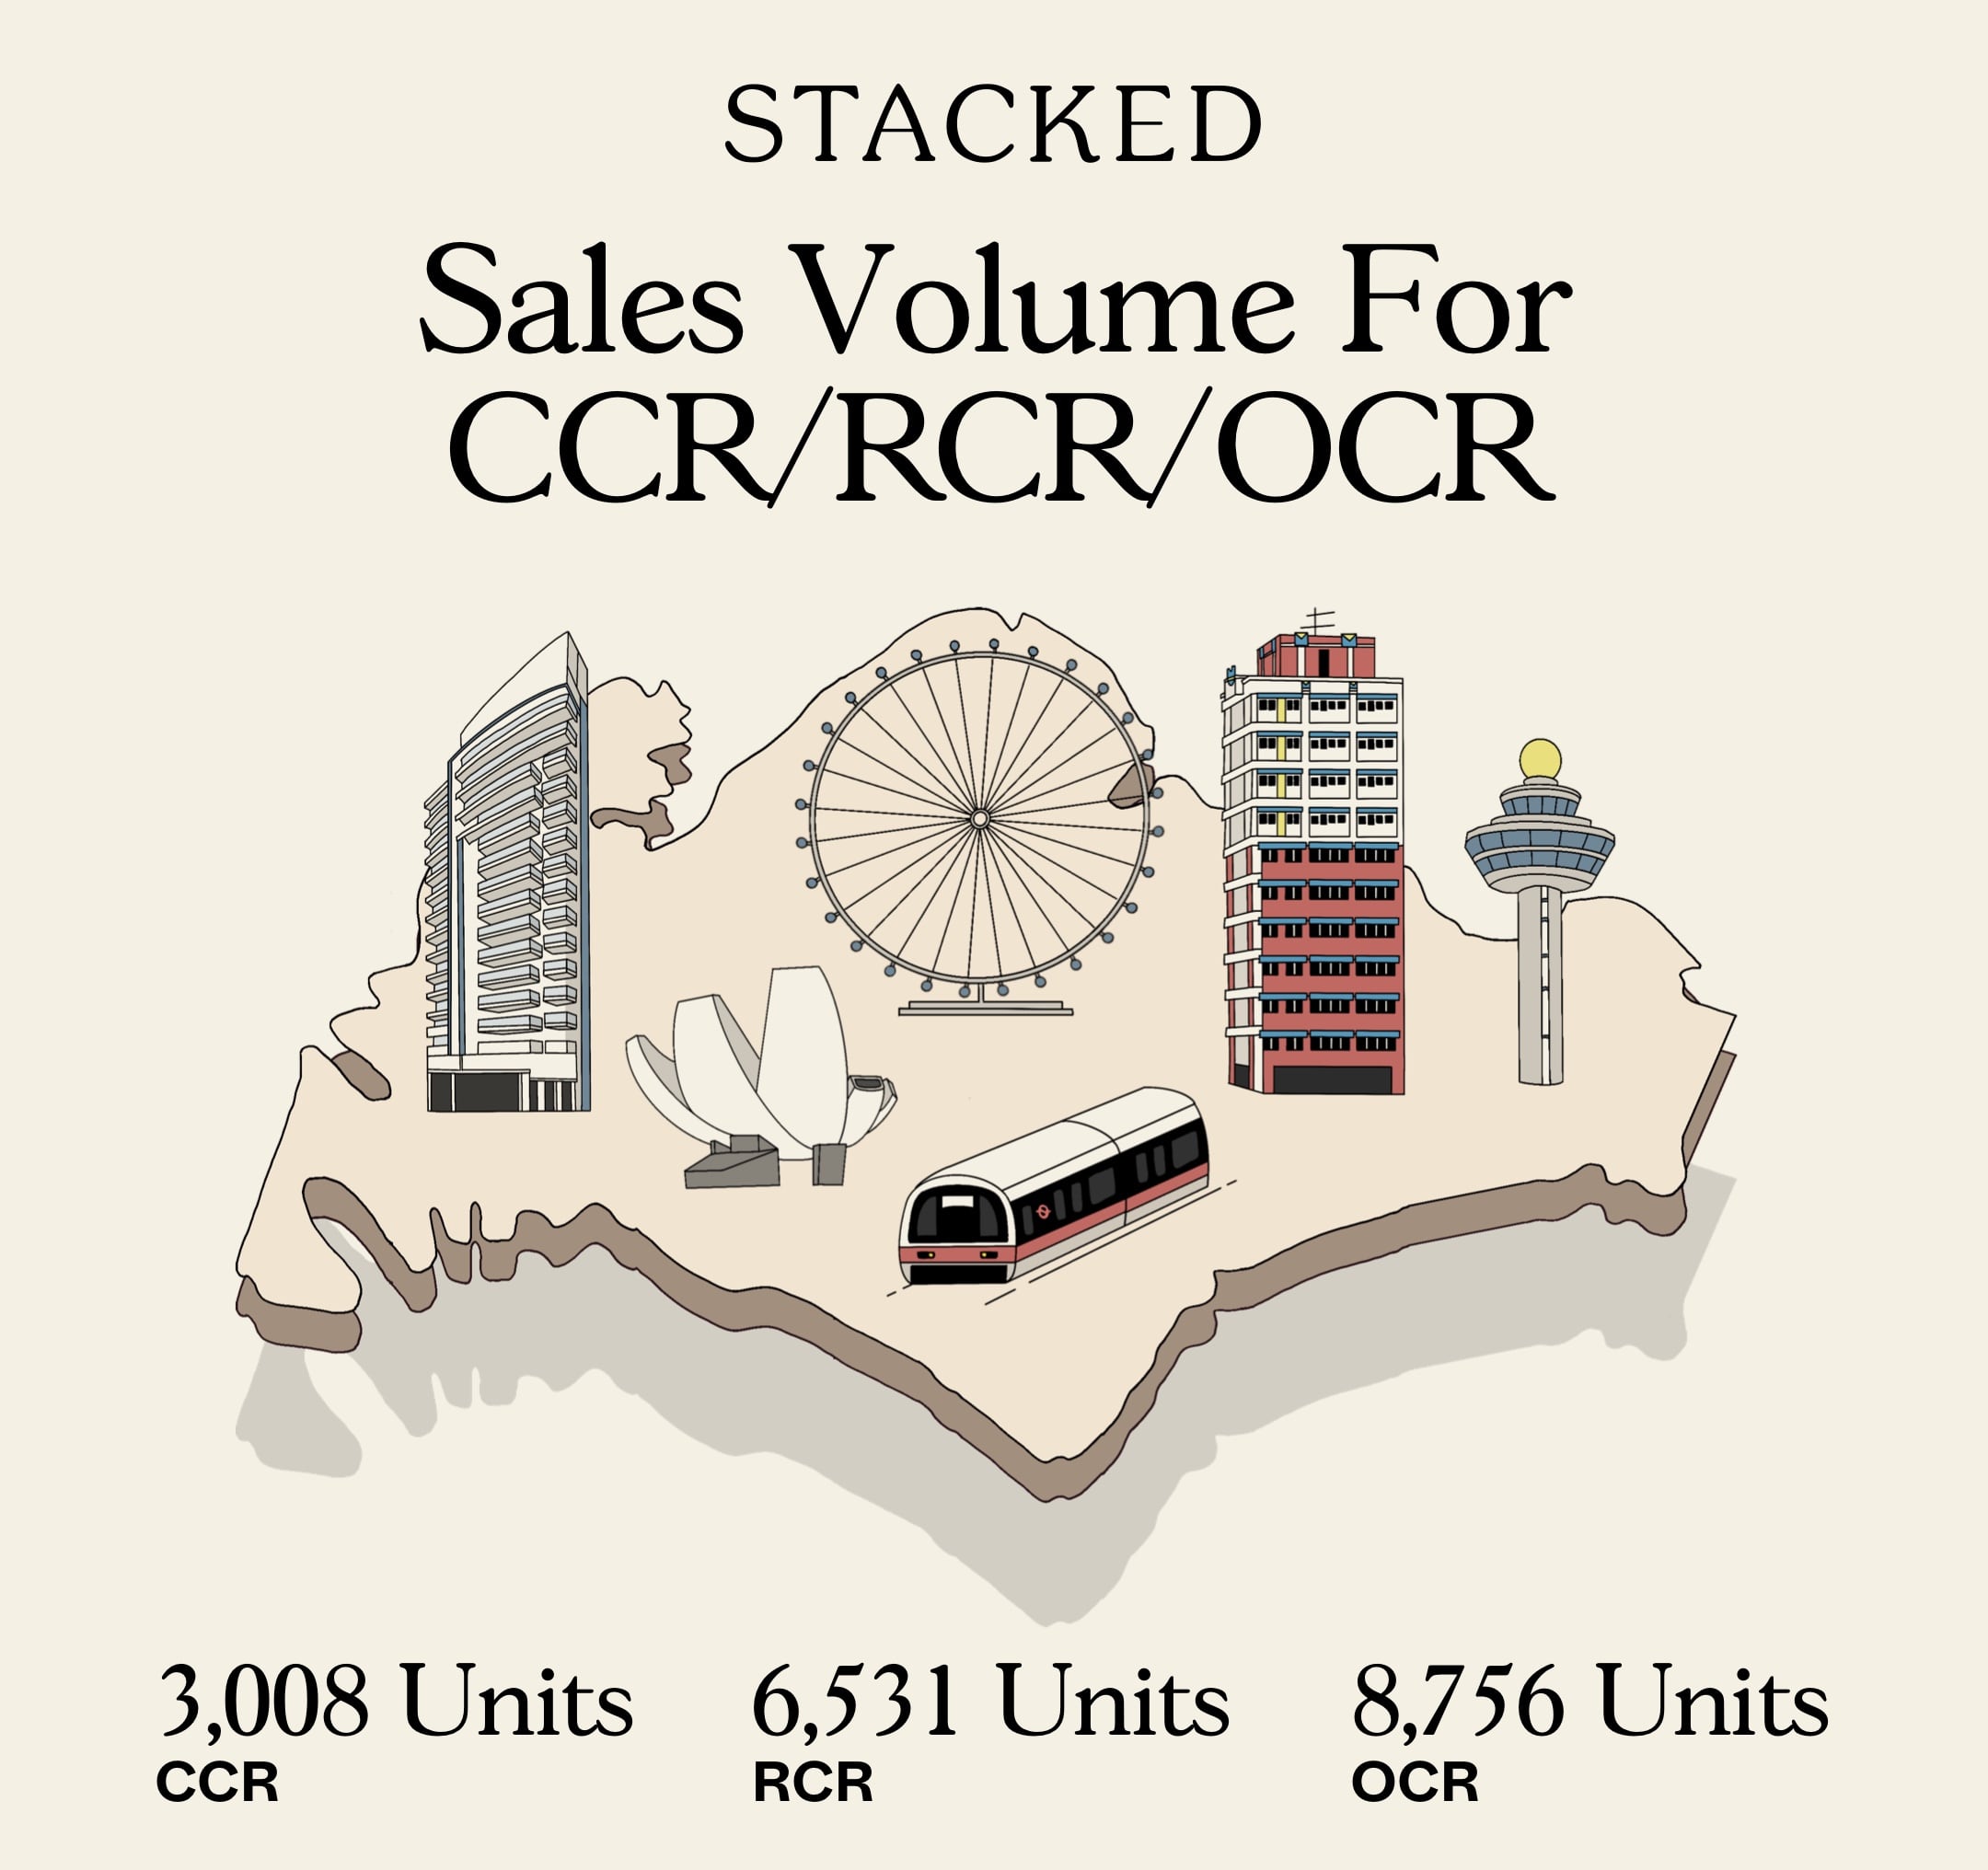
In the Core Central Region (CCR), sales volumes rose about 12.1 per cent over the year, from 2,683 to 3,008 units.
In the Rest of Central Region (RCR), sales volumes edged up to around 4.9 per cent, from 6,227 to 6,531 units.
In the Outside of Central Region (OCR), sales volumes rose around 13.2 per cent, from 7,733 to 8,756 units.
Price movement for non-landed private properties (Excluding ECs)
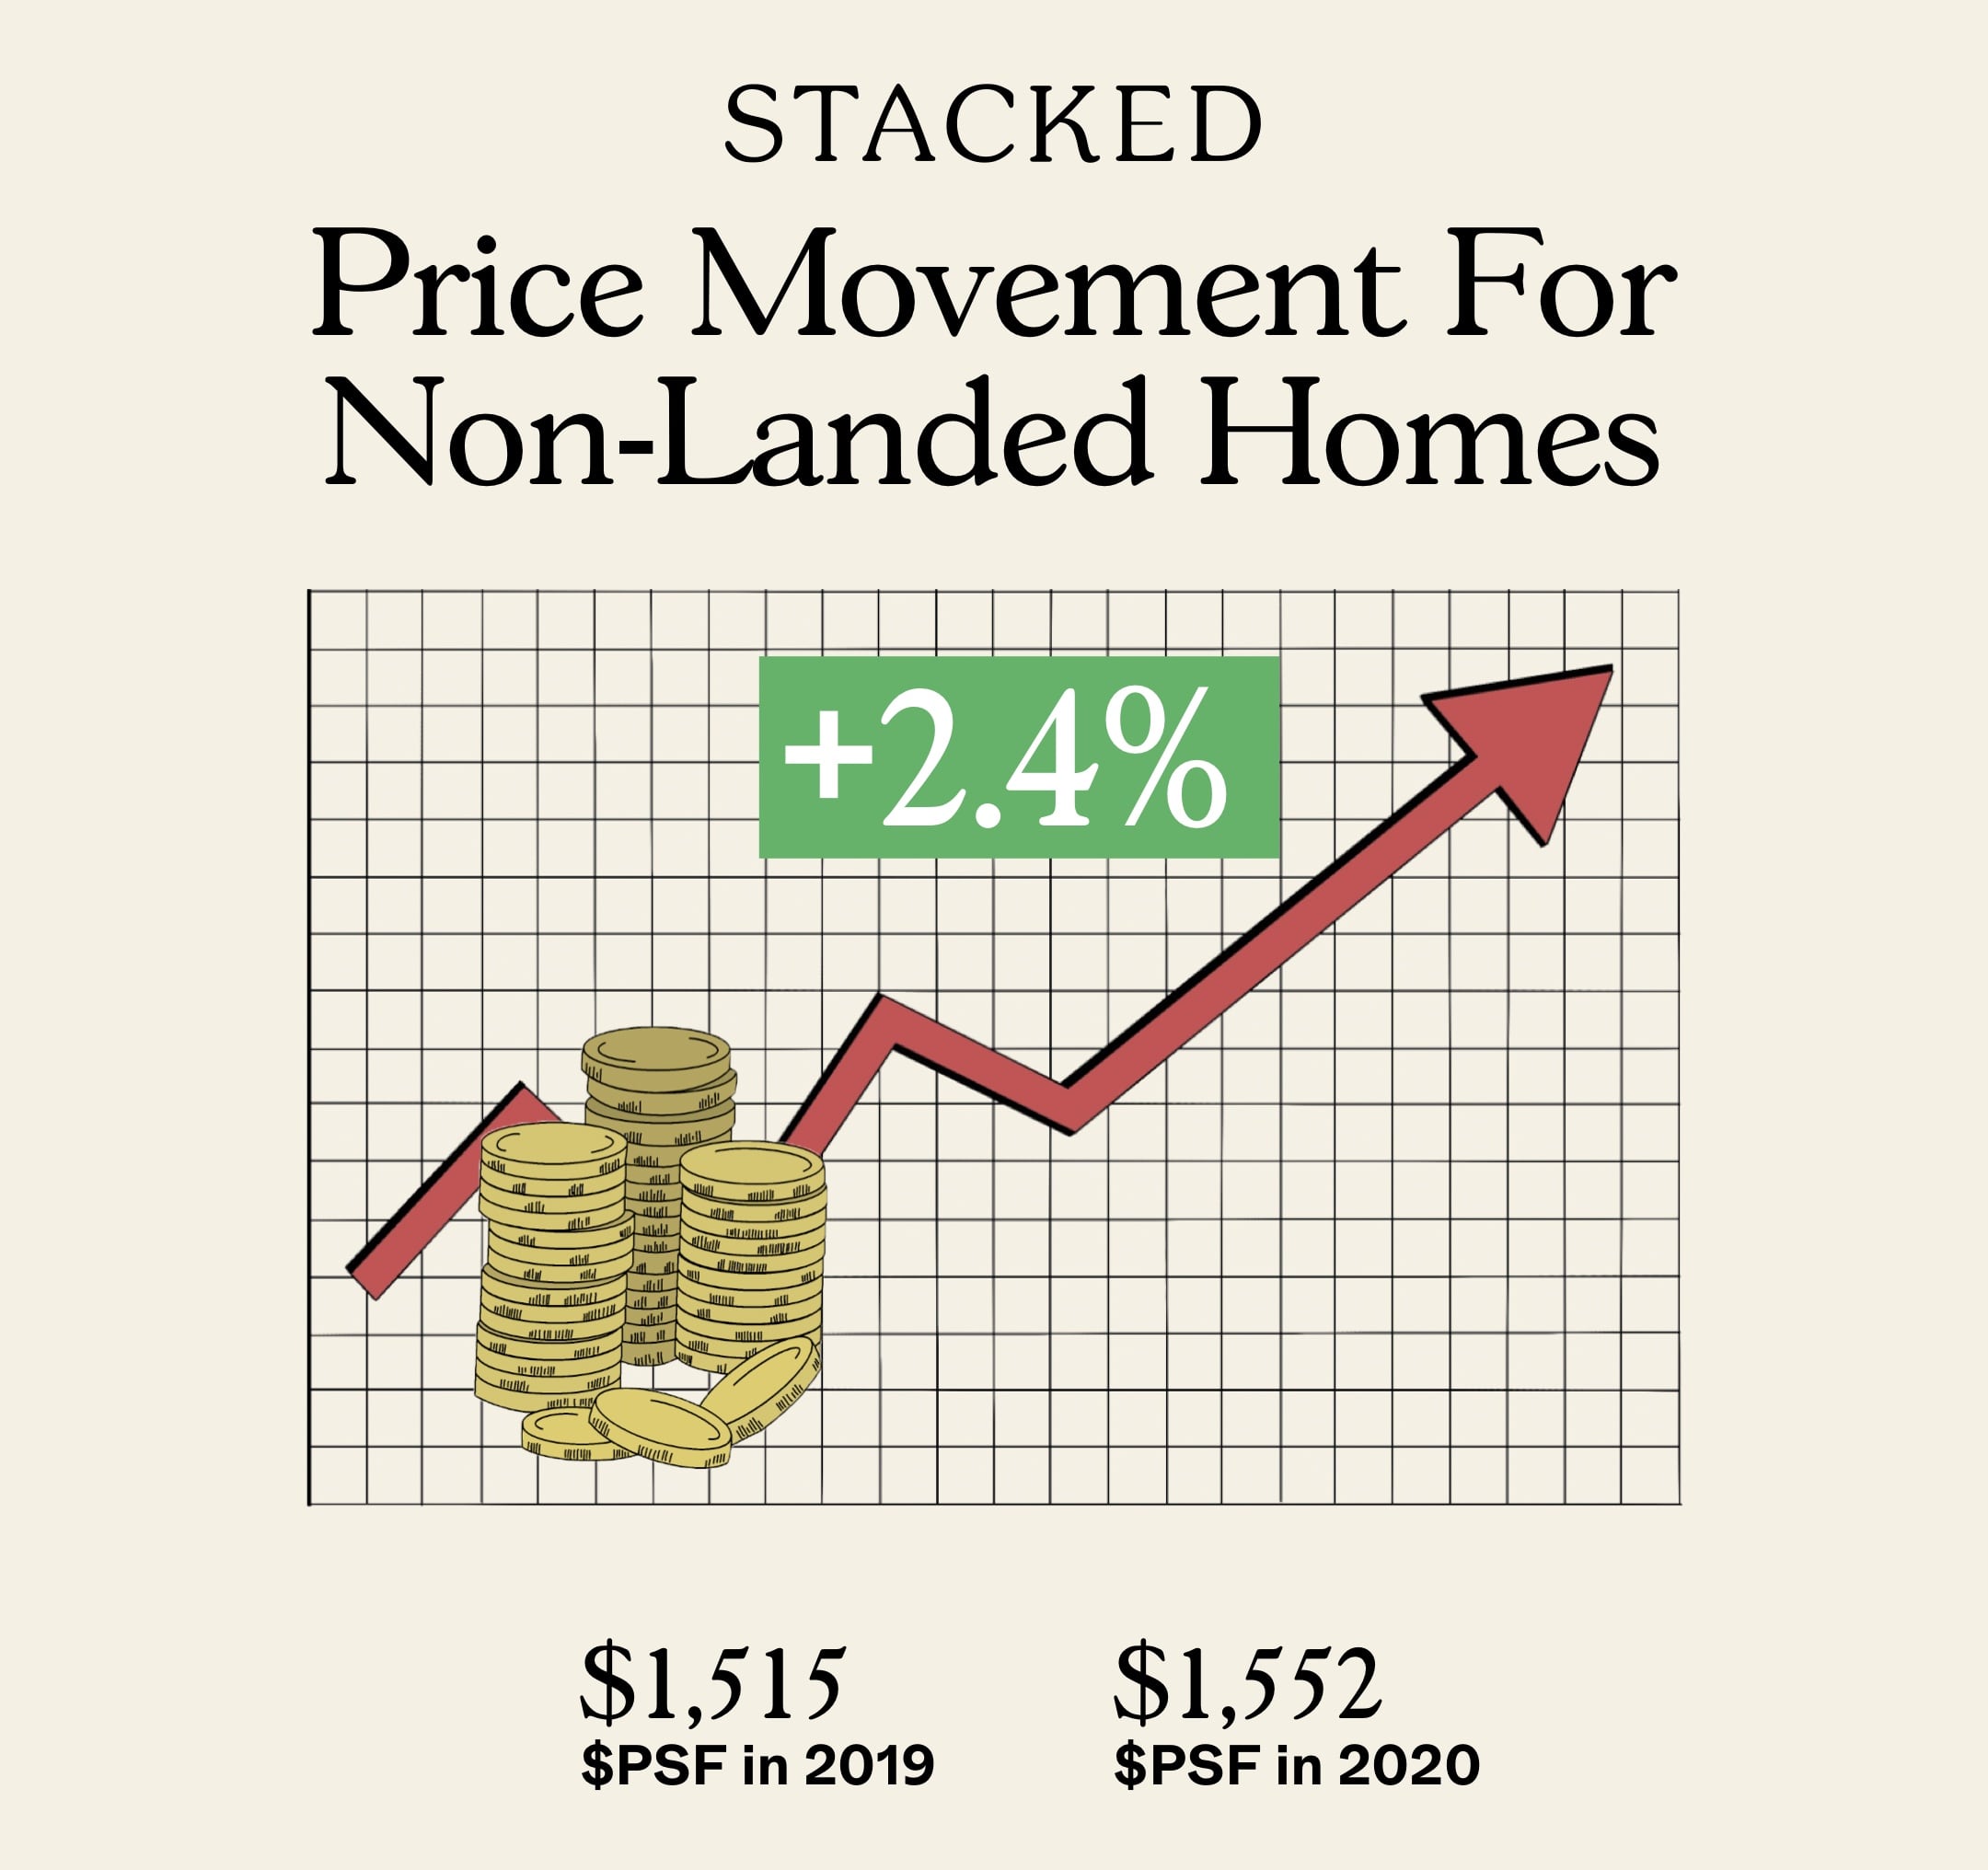
| Region | Volume (2019) | Median Price psf (2019) | Volume (2020) | Median Price psf (2020) | Approx. gain / loss |
| Singapore | 16,643 | $1,515 | 18,295 | $1,552 | +2.4% |
| CCR | 2,683 | $2,239 | 3,008 | $2,209 | -1.3% |
| RCR | 6,227 | $1,705 | 6,531 | $1,699 | -0.35% |
| OCR | 7,733 | $1,309 | 8,756 | $1,327 | +1.4% |
All new launch developments throughout 2020
The following is based on Square Foot Research. Some data was not available, at the time in which this report was written. For the most current details on pricing, take-up rates, etc. do drop us a query.
| Project Name | Location | Take-up Rate | Indicative Pricing/Average Pricing |
| 15 Holland Hill | 15 Holland Hill | 10.2% | S$ 2,700 - S$ 3,031 psf / S$ 2,886 psf |
| 19 Nassim | 19 Nassim Hill | 2% | S$ 3,401 - S$ 3,401 psf / S$ 3,401 psf |
| 77 @ East Coast | 77 Upper East Coast Road | 24.4% | S$ 1,671 - S$ 1,897 psf / S$ 1,763 psf |
| Cairnhill 16 | 16 Cairnhill Rise | - | - |
| Clavon | Clementi Ave 1 | 73.6% | S$ 1,487 - S$ 1,858 psf / S$ 1,648 psf |
| Dalvey Haus | 105A Dalvey Road | 11.1% | S$ 3,141 - S$ 3,192 psf / S$ 3,167 psf |
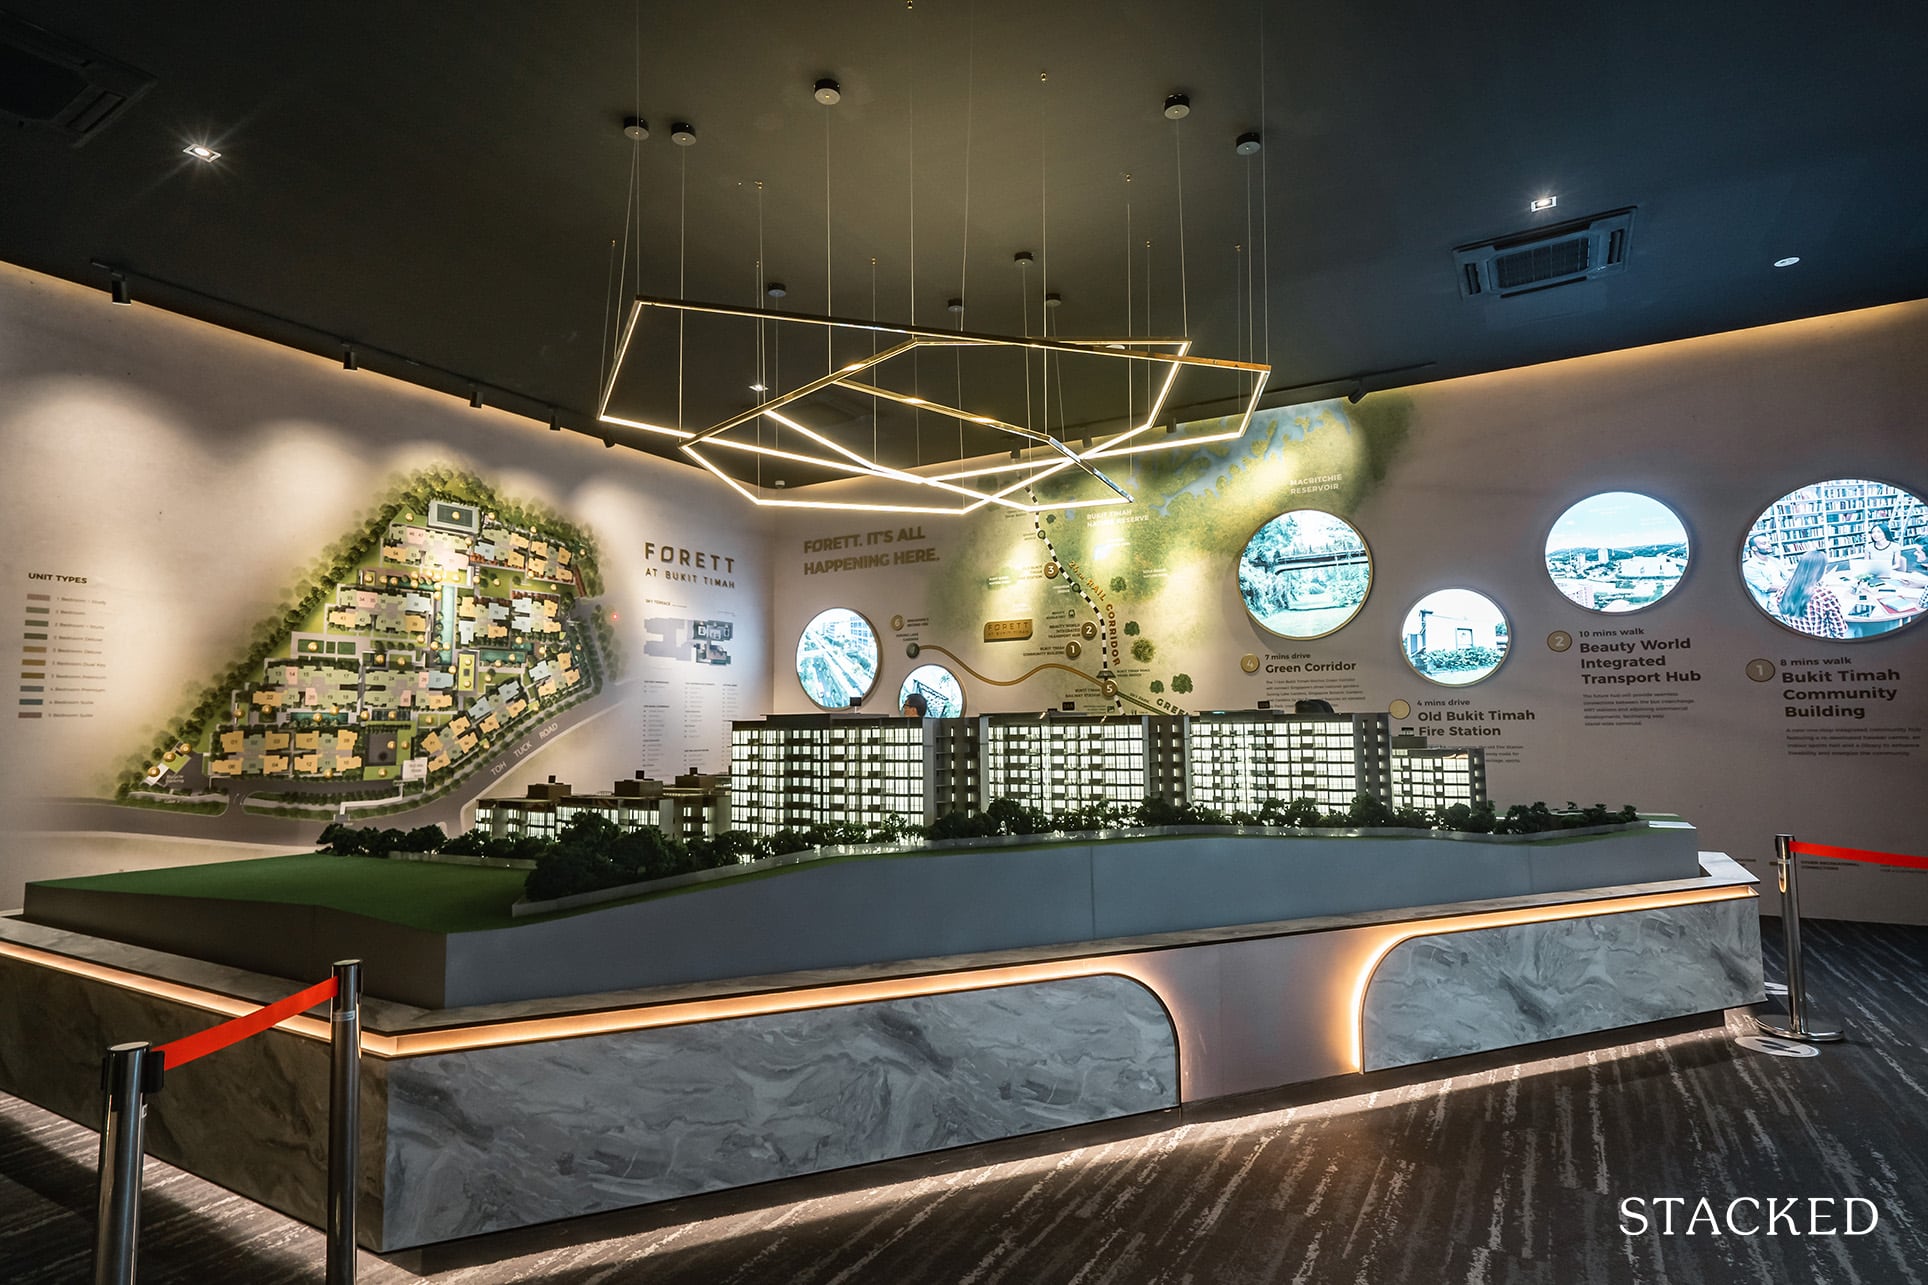
| Forett @ Bukit Timah | 46 Toh Tuck Road | 47.7% | S$ 1,635 - S$ 2,120 psf / S$ 1,931 psf |
| Grange 1866 | Grange Road | - | - |
| Hyll on Holland | 95 Holland Road | 1.9% | S$ 2,515 - S$ 2,904 psf / S$ 2,731 psf |
| Jewel @ Killiney Orchard | 110 Killiney Road | - | - |
| Ki Residences | Former Brookvale Park condo, Sunset Way | 25% | S$ 1,612 - S$ 1,950 psf / S$ 1,779 psf |
| Klimt Cairnhill | 69 Cairnhill Road | - | - |
| Kopar at Newton | Kampong Java Road | 44.7% | S$ 2,123 - S$ 2,590 psf / S$ 2,362 psf |
| Leedon Green | 1-11 Farrer Road | 13.8% | S$ 2,414 - S$ 2,918 psf / S$ 2,646 psf |
| Liv @ MB | 114A Arthur Road | - | - |
| Midtown Modern | Tan Quee Lan Street | - | - |
| Mooi Residences | 139 Holland Road | 16.7% | S$ 2,504 - S$ 2,669 psf / S$ 2,569 psf |
| Myra | 11 Meyappa Chettiar Road | 18.8% | S$ 2,016 - S$ 2,273 psf / S$ 2,096 psf |
| Noma | Guillemard Road | 72% | S$ 1,480 - S$ 1,808 psf / S$ 1,648 psf |
| Normanton Park | Normanton Park | - | - |
| One Bernam | Bernam Street | - | - |
| One Holland Village | Holland Road | 43.9% | - |
| One North Eden | One-North Gateway | - | - |
| Peak Residence | 333 Thomson Road | - | - |
| Penrose | Sims Drive | 71.6% | S$ 1,396 - S$ 1,856 psf / S$ 1,589 psf |
| Perfect Ten | 325 Bukit Timah Road | - | - |
| Phoenix Residences | Phoenix Avenue, Choa Chu Kang | 6.7% | S$ 1,496 - S$ 1,536 psf / S$ 1,517 psf |
| Phoenix Villas | 5 Phoenix Walk | - | - |
| Royal Oak Residence | Anderson Road | - | - |
| Rymden 77 | 75, 77, 79 Lorong H Telok Kurau | - | - |
| Tedge | 328-334 Changi Road | 31% | S$ 1,535 - S$ 1,742 psf / S$ 1,647 psf |
| The Atelier | 2 Makeway Ave | - | - |
| The Avenir | 8 River Valley Close | 12.2% | S$ 2,754 - S$ 3,328 psf / S$ 3,089 psf |
| The Landmark | 173 Chin Swee Road | 27.5% | S$ 1,905 - S$ 2,591 psf / S$ 2,151 psf |
| The Linq @ Beauty World | 110-122 Bukit Timah Road | 98.3% | S$ 1,998 - S$ 2,439 psf / S$ 2,188 psf |
| The M | Middle Road | 77.4% | S$ 2,374 - S$ 2,913 psf / S$ 2,598 psf |
| The Ryse Residences | Pasir Ris Central | - | - |
| Verdale | 2 De Souza Ave, off Jln Jurong Kechil | 21.7% | S$ 1,606 - S$ 1,893 psf / S$ 1,720 psf |
| Van Holland | 186 Holland Road | 26.1% | S$ 3,045 - S$ 3,045 psf / S$ 3,045 psf |
| Verticus | 5 Jalan Kemaman | 16% | S$ 1,773 - S$ 2,221 psf / S$ 1,991 psf |
Top 5 selling developments in 2020
- Treasure at Tampines (836 units)
- Parc Clematis (545 units)
- Jadescape (520 units)
- Clavon (471 units)
- The Florence Residences (418 units)
Top 5 non-landed private properties for resale gains in 2020
| Project Name | Transacted Price ($) | Unit Price ($ psf) | Sale Date | Postal District | Profitability |
| Gilstead Court | $760,000 | $547 | 2-Apr-99 | 11 | |
| Gilstead Court | $2,388,000 | $1,720 | 10-Sep-20 | 11 | 214.21% |
| Townhouse Apartments | $570,000 | $266 | 25-May-04 | 9 | |
| Townhouse Apartments | $1,795,000 | $838 | 25-Jun-20 | 9 | 214.91% |
| Lakeview Estate | $395,500 | $245 | 8-Nov-05 | 20 | |
| Lakeview Estate | $1,400,000 | $867 | 29-Jul-20 | 20 | 253.98% |
| Emerald Apartments | $805,000 | $462 | 15/7/05 | 9 | |
| Emerald Apartments | $2,880,000 | $1,652 | 10-Nov-20 | 9 | 257.76% |
| The Centrepoint | $415,000 | $559 | 4-Aug-04 | 9 | |
| The Centrepoint | $1,900,000 | $2,558 | 10-Jan-20 | 9 | 357.83% |
Bottom 5 private properties for resale gains in 2020
| Project Name | Transacted Price ($) | Unit Price ($ psf) | Sale Date | Profitability |
| Turquioise | $5,426,960 | $2,599 | 2-Nov-07 | |
| Turquioise | $2,800,000 | $1,341 | 25-Feb-20 | -48.41% |
| Reflections at Keppel Bay | $10,670,400 | $2,769 | 5-Aug-08 | |
| Reflections at Keppel Bay | $5,850,000 | $1,518 | 21-Jul-20 | -45.18% |
| The Azure | $4,072,100 | $2,149 | 12-Apr-11 | |
| The Azure | $2,300,000 | $1,214 | 1-Apr-20 | -43.52% |
| Orchard Scotts | $5,750,000 | $2,520 | 5-May-08 | |
| Orchard Scotts | $3,250,000 | $1,424 | 16-Jun-20 | -43.48% |
| The Sail @ Marina Bay | $4,296,000 | $3,001 | 2-Oct-07 | |
| The Sail @ Marina Bay | $2,550,000 | $1,781 | 6-Apr-20 | -40.64% |
Rental market for private non-landed properties (excluding ECs)
Island-wide, leasing volumes fell by about 1.8 per cent, from 88,116 in 2019, to 86,567 in 2020.
In the CCR, leasing volume fell around 3.9 per cent, from 26,023 to 25,041.
In the RCR, leasing volume fell around 2.2 per cent, from 29,755 to 29,093.
In the OCR, leasing volume increased around 0.3 per cent, from 32,338 to 32,433.
| Region | Leasing volume (2019) | Median Rental cost psf (2019) | Leasing volume (2020) | Median Rental cost psf(2020) | Approx. gain / loss |
| Singapore | 88,116 | $3.29 | 86,567 | $3.45 | +4.9% |
| CCR | 26,023 | $4.07 | 25,041 | $3.98 | -2.3% |
| RCR | 29,093 | $3.43 | 29,093 | $3.43 | 0.0% |
| OCR | 32,338 | $2.74 | 32,433 | $2.74 | 0.0% |
Top 5 developments for rental yield in 2020:
| Project | Tenure | TOP | Average rent psf | Leasing volume | Rental yield |
| The Hillford | 60 years from 2013 | 2016 | $4.64 | 124 | 4.8% |
| People's Park Complex | 99-years from1968 | 1972 | $3.24 | 90 | 4.2% |
| Melville Park | 99-years from 1992 | 1996 | $2.29 | 342 | 4.1% |
| Northoaks | 99-years from 1997 | 2000 | $1.94 | 117 | 3.9% |
| Viva Vista | Freehold | 2014 | $5.07 | 98 | 3.9% |
Bottom 5 developments for rental yield in 2020:
| Project Name | Tenure | TOP | Average rent psf | Leasing volume | Rental yield |
| Yong An Park | Freehold | 1986 | $2.82 | 35 | 1.8% |
| Pinewood Gardens | Freehold | 1990 | $2.55 | 44 | 1.7% |
| Flame Tree Park | Freehold | 1989 | $1.74 | 19 | 1.5% |
| Gilstead Court | Freehold | 1978 | $2.07 | 13 | 1.5% |
| Kum Hing Court | Freehold | Unrecorded | $2.07 | 41 | 1.1% |
HDB resale market
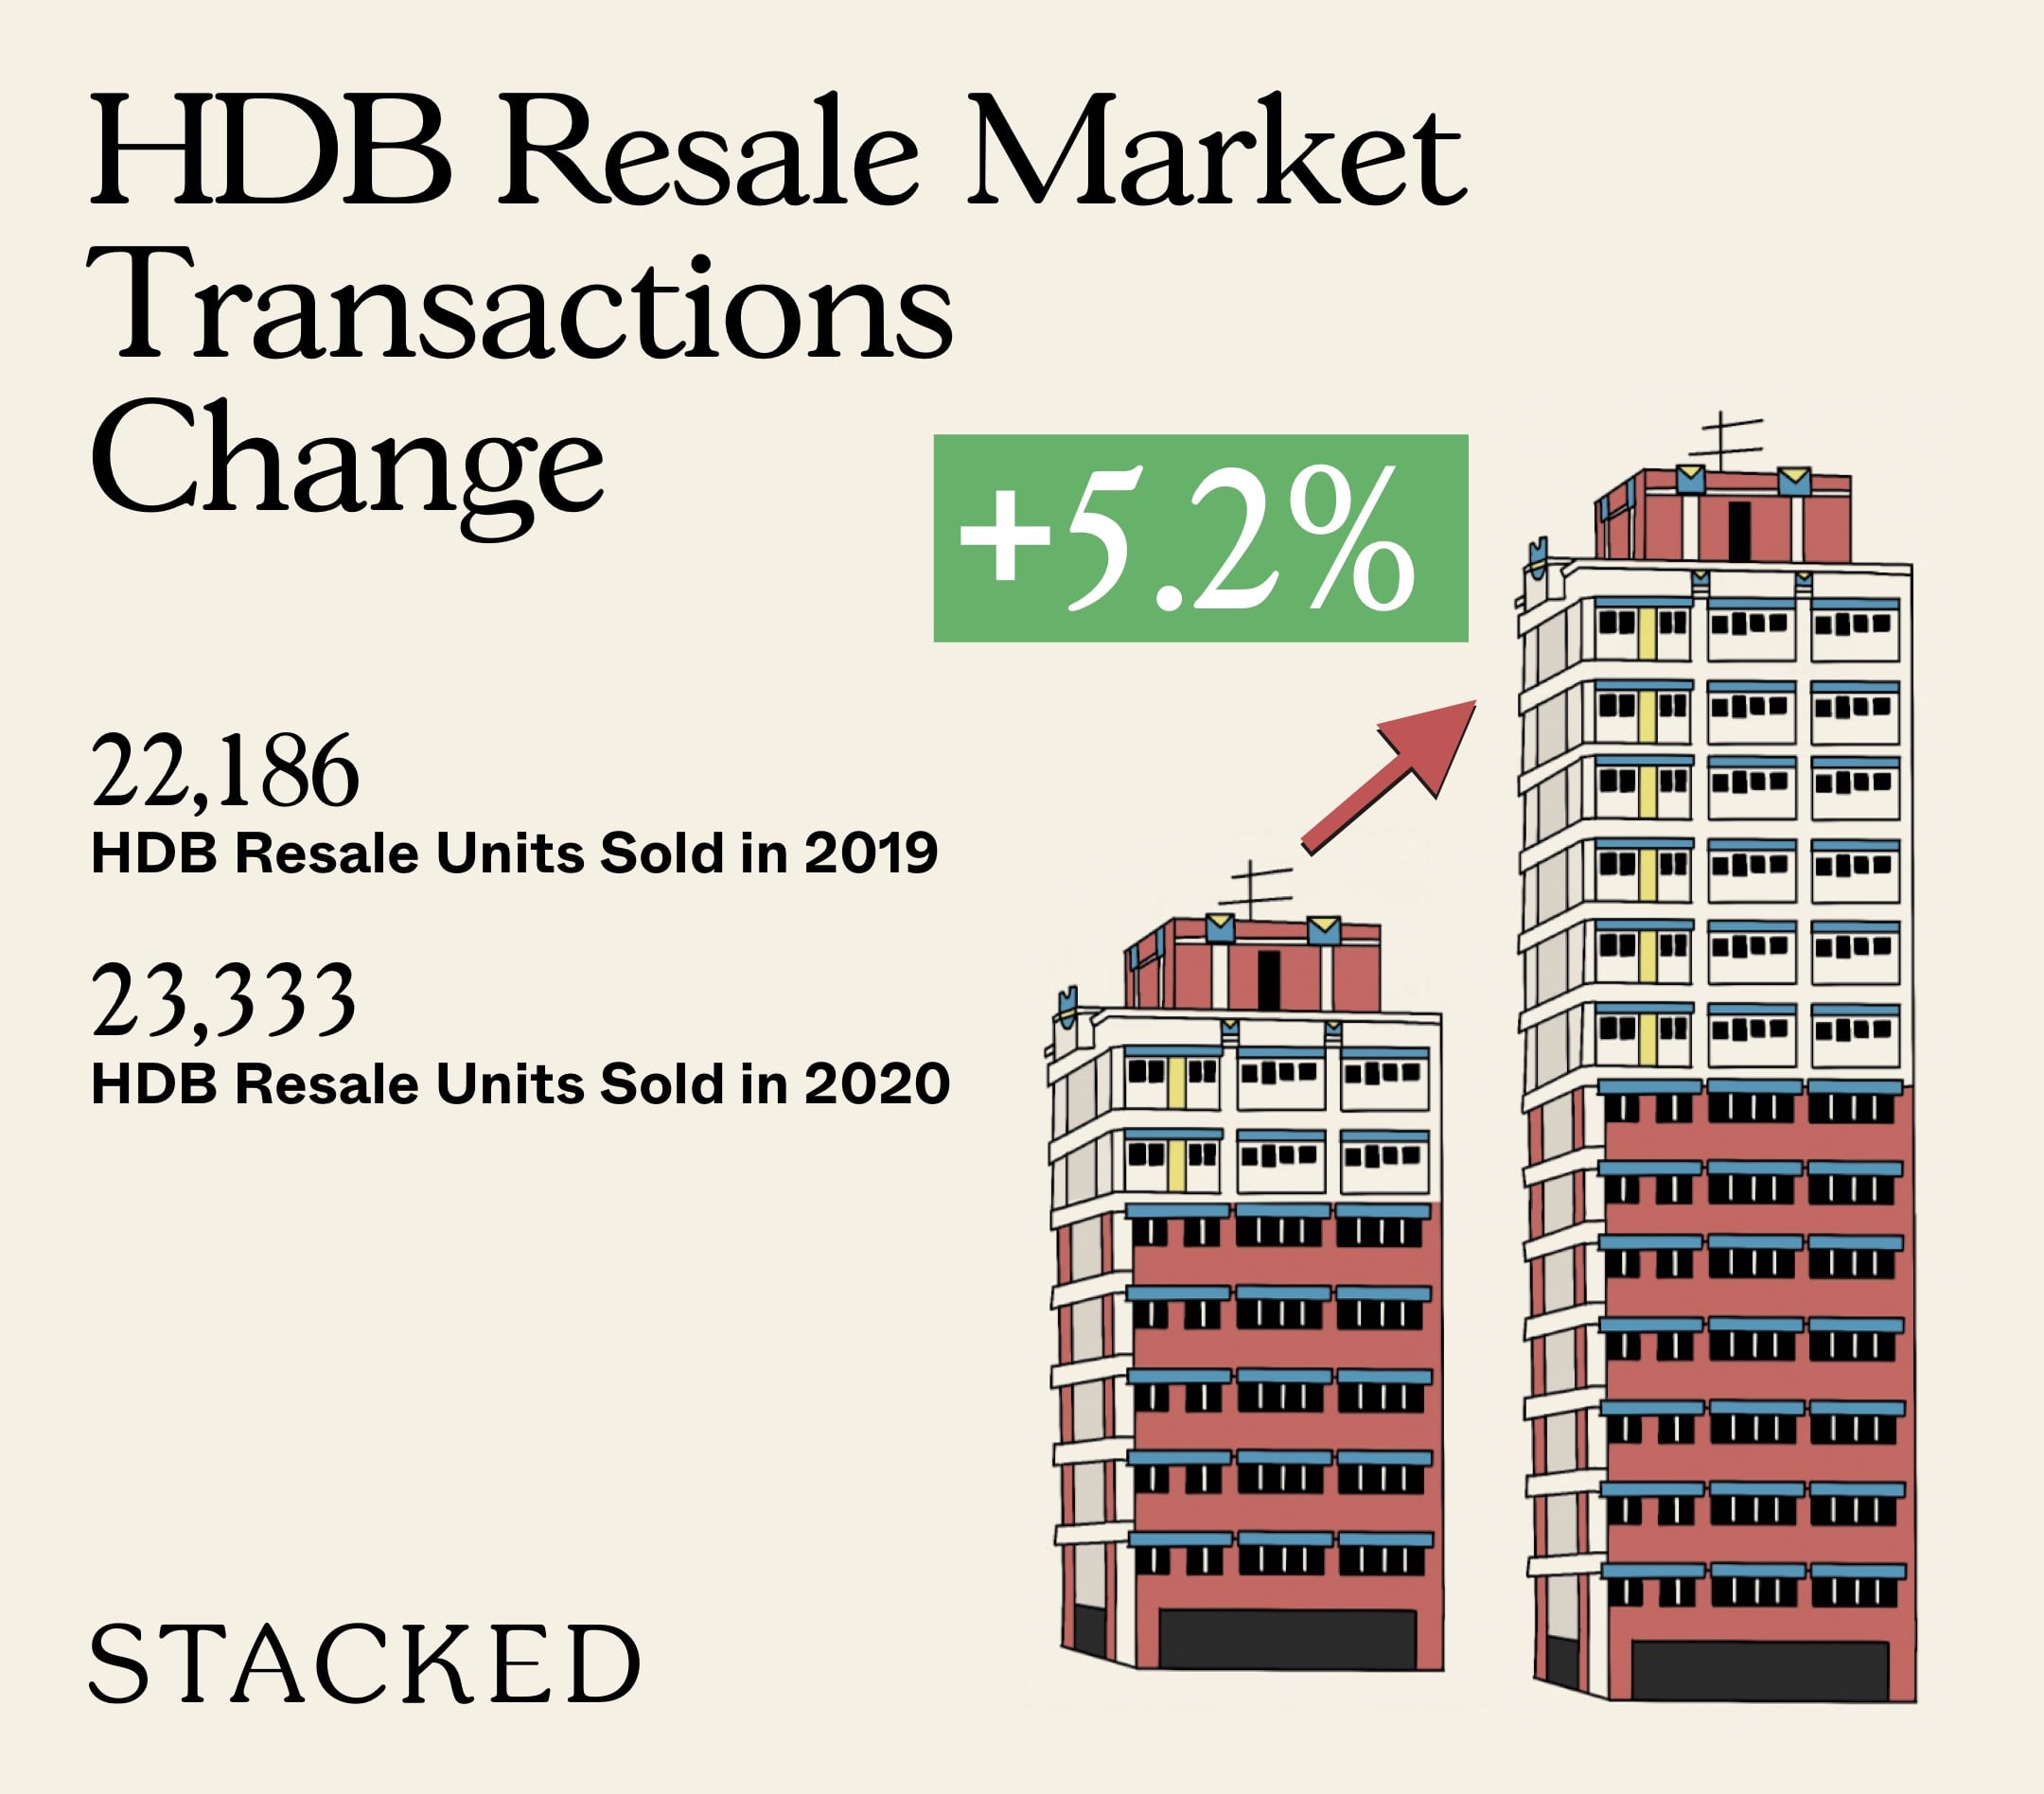
The total number of resale flat transactions rose by about 5.2 per cent in 2020. Total resale transactions numbered 23,333 units, up from 22,186 units last year.
The number of 2-room flat transactions rose from 414 to 418, up 1.0 per cent.
3-room flat transactions fell from 5,423 units to 5,384 units, down about 0.7 per cent, while 4-room flat transactions rose from 9,228 units to 9,647 units; up around 4.5 per cent.
5-room flat transactions rose from 5,427 units to 5,984 units, up 10.3 per cent, while Executive flat transactions rose from 1,669 units to 1,882 units, up 12.8 per cent.
There were only eight recorded transactions for 3Gen flats in 2020, down from 14 transactions the year before.
| Flat size | Transaction volume (2019) | Price psf (2019) | Transaction volume (2020) | Price psf (2020) | Approx. gain / loss |
| All flats | 22,186 | $416 | 23,333 | $434 | +4.3% |
| 1-room | 11 | $527 | 10 | $539 | +2.4% |
| 2-room | 414 | $461 | 418 | $471 | +2.1% |
| 3-room | 5,423 | $410 | 5,384 | $428 | +4.5% |
| 4-room | 9,228 | $421 | 9,647 | $443 | +5.1% |
| 5-room | 5,427 | $415 | 5,984 | $430 | +3.6% |
| Executive | 1,669 | $396 | 1,882 | $407 | +2.7% |
| 3Gen | 8 | $461 | 14 | $449 | -2.4% |
The rental market for HDB flats
Leasing volumes fell 21 per cent across the board, from 42,975 in 2019 to 34,794 in 2020.
Leasing volume for 3-room flats fell 19.2 per cent, from 13,631 units to 11,241 units.
Leasing volume for 4-room flats fell close to 20 per cent, from 14,935 to 12,221 units.
Leasing volume for 5-room flats fell 22.9 per cent, from 10,981 to 8,722 units.
Leasing volume for executive flats fell 30 per cent, from 2,841 to 2,098 units.
| Flat size | Transaction volume | Price psf (2019) | Price psf (2020) | Approx. gain / loss |
All flats | 34,794 | $2.08 | $2.12 | 1.9% |
3-room | 11,214 | $2.59 | $2.65 | 2.3% |
4-room | 12,221 | $2.12 | $2.14 | 0.9% |
5-room | 8,722 | $1.54 | $1.56 | 1.3% |
Executive | 2,098 | $1.30 | $1.31 | 0.76% |
All BTO launch sites of 2020
| Town Name | BTO Name | Launch Date |
| Sembawang | Canberra Vista | 11 Feb 2020 |
| Toa Payoh | Kim Keat Ripples | 11 Feb 2020 |
| Toa Payoh | Toa Payoh Ridge | 11 Feb 2020 |
| Choa Chu Kang | Keat Hong Verge | 12 Aug 2020 |
| Tengah | Parc Residences @ Tengah | 12 Aug 2020 |
| Woodlands | Champions Bliss | 12 Aug 2020 |
| Woodlands | UrbanVille @ Woodlands | 12 Aug 2020 |
| Ang Mo Kio | Kebun Baru Edge | 12 Aug 2020 |
| Bishan | Bishan Towers | 12 Aug 2020 |
| Geylang | Dakota One | 12 Aug 2020 |
| Pasir Ris | Costa Grove | 12 Aug 2020 |
| Tampines | Tampines GreenCrest | 12 Aug 2020 |
| Tampines | Tampines GreenGlade | 12 Aug 2020 |
| Tampines | Tampines GreenOpal | 12 Aug 2020 |
| Sembawang | Sun Sails | 17 Nov 2020 |
| Tengah | Garden Court @ Tengah | 17 Nov 2020 |
| Tengah | Garden Terrace @ Tengah | 17 Nov 2020 |
| Bishan | Bishan Ridges | 17 Nov 2020 |
| Tampines | Tampines GreenEmerald | 17 Nov 2020 |
| Toa Payoh | Bartley Beacon | 17 Nov 2020 |
| Toa Payoh | ParkView @ Bidadari | 17 Nov 2020 |
Executive Condominium (EC) launches in 2020
There were three EC launches in 2020, and Parc Central Residences was announced; sales for Parc Central Residences have not yet begun or been recorded at this time of writing.
| EC | Location | Est. TOP | Take-up rate | Indicative pricing / Average pricing |
| OLA | Anchorvale Crescent | 14 Dec. 2023 | 38% | $1011 - $1,303 psf / $1,152 psf |
| Parc Canberra | Canberra Walk | 9 Sep. 2023 | 87.1% | $967 - $1.165 psf / $1,099 psf |
| Piermont Grand | Sumang Walk | 28 Feb. 2023 | 81.5% | $945 - $1,233 psf / $1,121 psf |
| Parc Central Residences | Tampines Ave. 10 | Q2 2023 | - | - |
Policy measures/changes in 2020
- URA restricts the re-issue of Options to Purchase (OTPs)
- Extension on construction deadlines
- End of mortgage deferments
- Upcoming changes for sale of flats in prime areas
1. URA restricts the re-issue of Options to Purchase (OTPs)
The full details of this can be found in our earlier article.
URA has barred the practice of developers repeatedly re-issuing lapsed OTPs. Prior to this, it was a common practice for developers to re-issue OTPs, when they lapsed after 21 days. Developers would continue to do so, until the buyer could secure the funds needed.
Under the new rules, developers cannot re-issue the OTP for the same property, to the same buyer, within 12 weeks of the earlier OTP expiring.
Developers also cannot make upfront agreements or promise to renew the lapsed OTPs, as they did before (e.g. marketing it as a “reservation scheme”).
This policy change will mainly affect upgraders, who made the most use of re-issued OTPs. For example, it used to be common for upgraders to secure the OTP first, and then have the developer repeatedly renew it until they were able to sell their previous home.
The policy change does allow the OTP to have an extended validity period (up to 12 weeks instead of 21 days), but this still places greater urgency on the sale of the previous home.
The change is likely to lower the number of recorded transactions. This is because most transactions are recorded as soon as the OTP is secured – but it’s not recorded if the same units are later returned (i.e. not bought after the OTP lapses).
2. Extension on construction deadlines
In November 2020, developers received a universal four-month extension to complete projects.
This will extend developers’ deadlines for purposes such as the Additional Buyers Stamp Duty (ABSD) for developers. The ABSD for developers imposes a 30 per cent tax if projects are not completed and sold out within five years, and the ABSD deadline can sometimes lead to fire sales.
For individual home buyers, it’s important to consult your conveyancing lawyers on how this will impact the expected completion date. You may not be entitled to liquidated damages if delays fall within the stipulated four-month extension.
Delays in construction, along with renovations, may cause some buyers to favour resale over new units in the coming year; especially if the move-in date, or the date when landlords can start renting out, is vital.
3. End of mortgage deferments
Homeowners were allowed to defer mortgage payments (in whole or deferred interest-only) between April to December 2020.
It’s uncertain if authorities will extend the deferment period for 2021, but there has been no news to date. This is likely on a wait-and-see basis, with another round of deferments only if we see more mortgagee sales, missed home loan repayments, etc.
4. Upcoming changes for the sale of flats in prime areas
We have more details of this topic in an earlier article.
In future, flats in prime areas may face resale restrictions, to mitigate the “lottery effect”. This seems to be a response to the rising number of million-dollar flats, of which there were a record 71 transactions in 2020, as well as preparation for the Greater Southern Waterfront project.
The exact nature of restrictions has not been made clear, although we’re likely to hear more in 2021. This is likely to have a significant impact on the value of existing resale flats in certain areas, such as Tiong Bahru.
Notable trends that emerged in 2020
- An inflection point for the HDB resale market
- More focus on overall price than price per square foot
- HDB upgraders likely to be the main group of buyers
- Low home loan rates
1. An inflexion point for the HDB resale market
In 2020, the HDB resale market decided to do this:
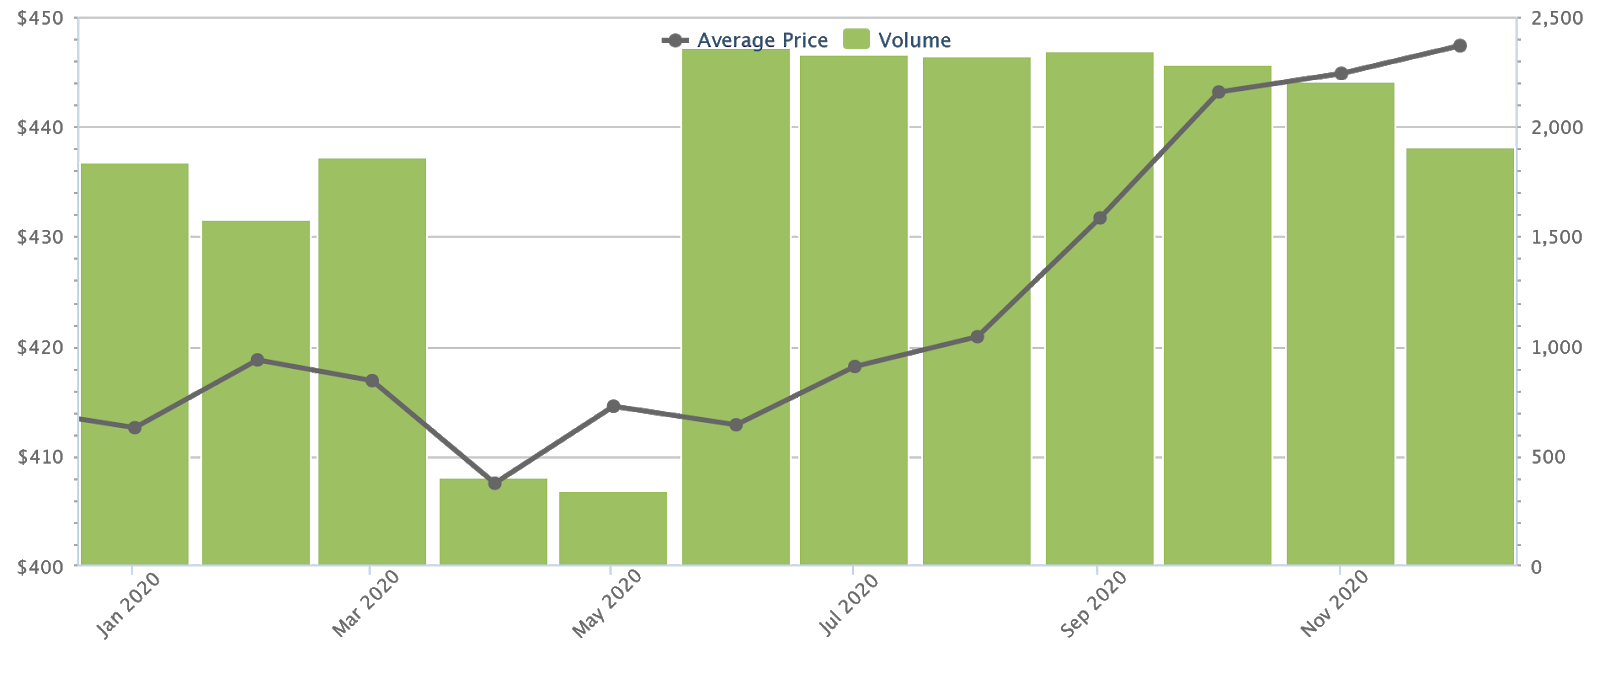
This marked the first significant uptick in HDB resale prices, that we’ve seen in around seven years. The pick-up happened after the Circuit Breaker, and simply didn’t stop climbing – we wrote a more detailed explanation on this earlier in the year, when we said Covid-19 may have ended up being a boon to resale flats.
HDB resale prices are still far from their last peak in 2013 ($478 psf), but they’re now only about 12.7 per cent down from this number:
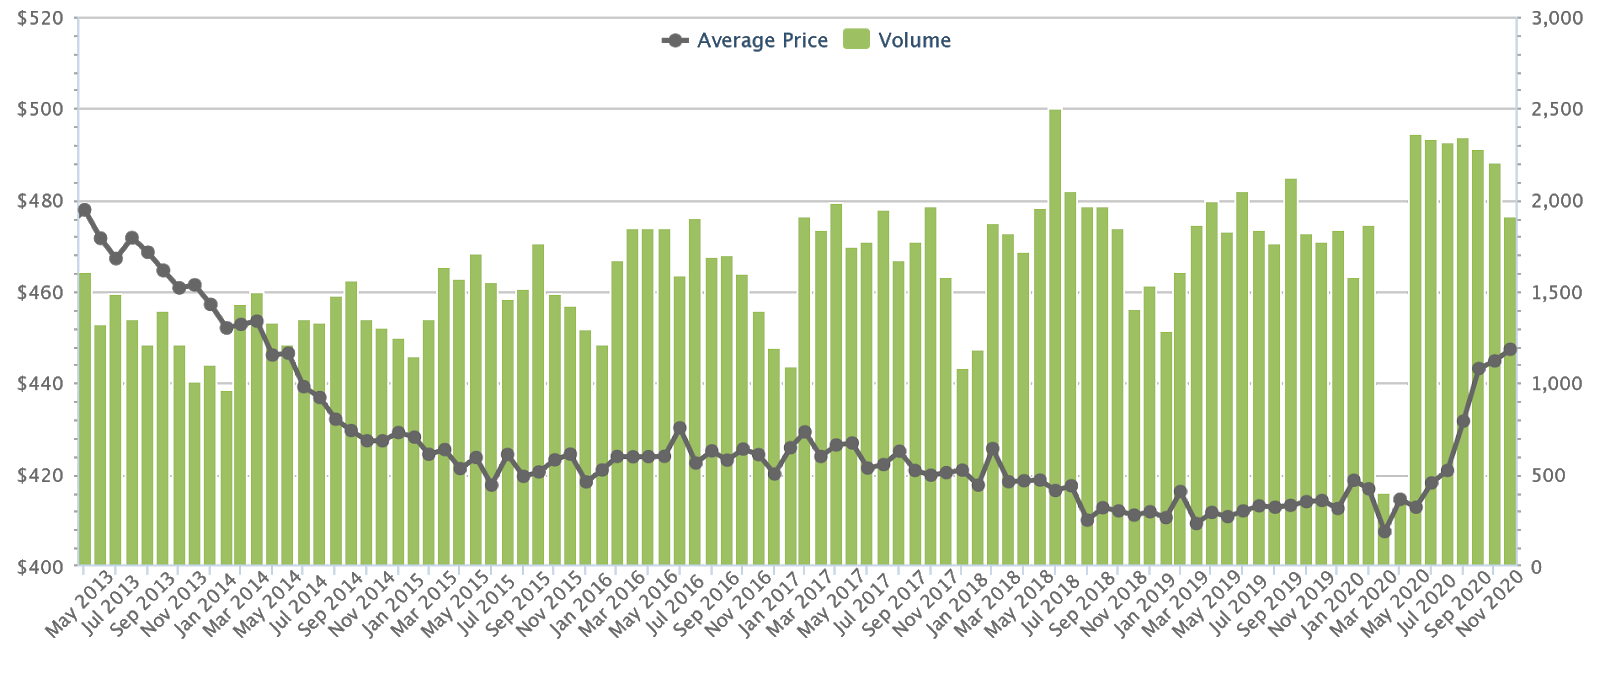
The uptick is supported by new rules regarding CPF usage, that comes from 2019. It’s easier for buyers to use their CPF for older flats, and to get full loans even if there are 60 or fewer years on the lease; this continues to provide price support to resale flats.
In addition, we’ve mentioned a bumper crop of flats reaching their Minimum Occupation Period (MOP). This will raise the supply of newer resale flats – those that are only five years old and still far from the impact of lease decay. These units will be attractive to buyers who need a home immediately, and we could see HDB resale volumes continue to climb into 2021.
2. More focus on overall price than the price per square foot
Condos such as The M, Midtown Bay, and Penrose would have made buyers baulk in the past, with their higher price per square foot.
The M, for instance, had units that reached up to $3,000 psf; but it still sold fast, due to a low quantum. Some of the one-bedders cost under $1 million; a very low price for the Middle Road / Bugis area.
However, this trend may change in the coming years, given the main buyer demographic we’re seeing (see below). We’d also be concerned with the impact of Covid-19 on prospective tenant pools, as many of these centrally located, shoebox units are mainly purchased to be rented out.
3. HDB upgraders are likely to be the main group of buyers
As part of an ongoing trend since 2019, it is HDB upgraders who make up a large buyer demographic. Their numbers are likely to increase even further in the year or two ahead, due to the large number of resale flats reaching MOP (see above).
This can run contrary to the trend for shoebox units, with a low quantum but high price psf. HDB upgraders are often families, and one or two-bedder condo bedders are usually too small for them. As such, the rise of this demographic – along with foreign worker numbers hampered by Covid-19 – might reverse the trend for shoebox units that we saw this year.
4. Low home loan rates
Due to the United States cutting interest rates till 2022, home loan rates in Singapore have also fallen. It’s now possible to get home loans for as low as 1.2 to 1.3 per cent per annum; about half the HDB loan rate of 2.6 per cent.
The rates are likely to rise in the coming year, as banks raise their spread to compensate. However, the cheap loan rates will prompt some buyers to abandon fixed or board rate loans and instead pick SIBOR loans.
It’s also possible that we’ll see more HDB flat buyers opt for bank loans. While HDB loan rates fluctuate less, they have also had higher interest than bank loans since around 2009. Some flat owners may feel a bit “burned” by this point and may seek to refinance.
Overall, the property market is in a good place despite the turmoil of 2020 – or perhaps because of it.
The interest in real estate – such as the surge in landed home transactions in October – may be due to investors seeking safe-haven assets. It’s possible that investors who currently shy away from the more volatile stock market are turning their attention to property, as we saw during the Global Financial Crisis (GFC).
It certainly helps that low interest rates make home loans very cheap, while also lowering bond yields; it’s another enticement for investors to turn their eyes toward the property market.
That said, we’re still far from smooth waters, as the impact of Covid-19 hasn’t yet fully sunk in. We don’t know, for instance, if mortgagee sales will rise when mortgage deferments end; nor can we predict the economic situation in other countries that could affect Singapore.
And from the team at Stacked, have a Happy New Year!
At Stacked, we like to look beyond the headlines and surface-level numbers, and focus on how things play out in the real world.
If you'd like to discuss how this applies to your own circumstances, you can reach out for a one-to-one consultation here.
And if you simply have a question or want to share a thought, feel free to write to us at stories@stackedhomes.com. We read every message.





0 Comments