


One of the biggest advantages of HDB flats is their low cost, in comparison to the potential rental income. In terms of gross rental yield, the typical mass-market condo averages two to three per cent per annum (as of 2021). It’s often only shoebox units, or the oldest condos, that can reach an average of five per cent.
With resale flats however, gross rental yields of five to seven per cent are the current norm; almost on par with some commercial properties. However, the fact remains that some HDB towns perform significantly better than others – these are the top ones to date:
Yield tables and rent charts are useful reference points, but the units that actually rent well and continue to attract tenants over time aren't always the ones at the top of a yield table.
The more important question is whether the investment still makes sense once you factor in holding costs, vacancy and your long-term plans. That's often where buyers find a second opinion most valuable.
Over time, that's also why we decided to work with agents who shared the same data-driven and advisory-led approach behind our editorial, consultants who could help readers think through decisions more objectively, rather than simply push transactions.
Today, the team has worked with more than 2,000 clients across over $5B in property transactions.
How we derived the HDB rental yield
The following is based on gross rental yield (annual rental income / cost). In addition, we have included the lease start date for most of the flats.
Note that there will always be variations for individual units (e.g., units closer to MRT stations may generate a higher yield, as might more recently renovated units) For details on a specific flat or block, contact us with the address and we’ll look it up for you.
We have separated the top 10 lists for 3-room, 4-room, and 5-room flats. We’ve left out executive flats as transaction volumes are lower, and median rents are sometimes unclear.
Top 10 HDB rental yield for 3-room flats
| Town | Yield | Median rents | Median prices | Average age (start date of 99-year lease) |
| Toa Payoh | 8.06% | $1,800 | $268,000 | 1971 |
| Geylang | 7.76% | $1,800 | $278,500 | 1977 |
| Kallang / Whampoa | 7.52% | $1,900 | $303,000 | 1974 |
| Bedok | 7.45% | $1,800 | $290,000 | 1979 |
| Bukit Batok | 7.42% | $1,700 | $275,000 | 1985 |
| Bukit Merah | 7.32% | $2,000 | $328,000 | 1976 |
| Queenstown | 7.32% | $2,000 | $328,000 | 1974 |
| Jurong West | 7.29% | $1,700 | $280,000 | 1983 |
| Jurong East | 7.22% | $1,800 | $299,000 | 1986 |
| Hougang | 7.22% | $1,750 | $291,000 | 1986 |
Top 10 HDB rental yield for 4-room flats
| Town | Yield | Median rents | Median prices | Average age (start date of 99-year lease) |
| Jurong West | 6.5% | $2,000 | $369,000 | 1997 |
| Bukit Batok | 6.32% | $2,000 | $380,000 | 1986 |
| Sembawang | 6.22% | $1,900 | $366,500 | 2004 |
| Ang Mo Kio | 6.22% | $2,100 | $405,444 | 1980 |
| Woodlands | 6.16% | $1,900 | $370,000 | 1998 |
| Bedok | 6.15% | $2,100 | $410,000 | 1986 |
| Serangoon | 6.11% | $2,230 | $438,000 | 1986 |
| Clementi | 6.06% | $2,500 | $495,000 | 1980 |
| Jurong East | 5.96% | $2,100 | $422,500 | 1998 |
| Hougang | 5.87% | $2,000 | $409,000 | 1992 |
Top 10 HDB rental yield for 5-room flats
| Town | 5 Room | Median Rents | Median Price | Average Age (start date of 99-year lease) |
| Jurong West | 5.77% | $2,250 | $468,000 | 2001 |
| Sembawang | 5.69% | $2,000 | $422,000 | 2001 |
| Jurong East | 5.27% | $2,300 | $524,000 | 1983 |
| Pasir Ris | 5.16% | $2,200 | $511,400 | 1994 |
| Woodlands | 5.12% | $1,900 | $445,000 | 1998 |
| Tampines | 5.06% | $2,300 | $545,000 | 1993 |
| Serangoon | 5.05% | $2,300 | $547,000 | 1989 |
| Choa Chu Kang | 5.03% | $1,950 | $465,500 | 2000 |
| Bukit Batok | 4.98% | $2,200 | $530,000 | 1989 |
| Geylang | 4.95% | $2,680 | $650,000 | 1988 |
Key things to note about the HDB rental market in 2021
- We may be reaching a new peak for HDB rental rates
- The rental difference is not very big, in absolute terms
- Newcomers are beginning to creep into the list
1. We may be reaching a new peak for HDB rental rates
Despite a fall in leasing volumes for February (mainly due to Chinese New Year), the HDB rental market has seen a rise in recent months:
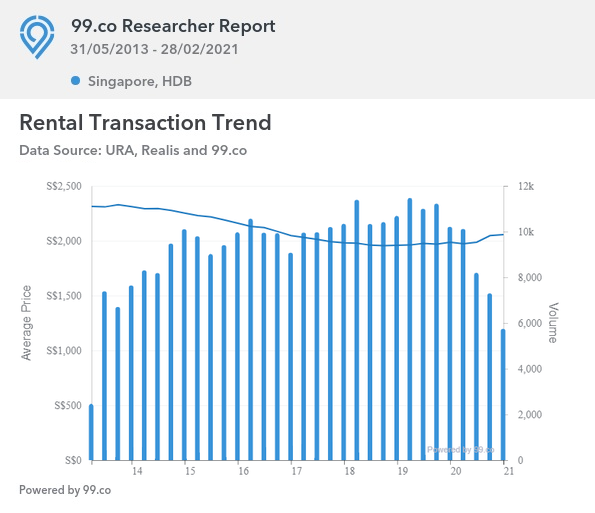
Despite lower transaction volumes, monthly rental rates have risen for eight consecutive months between June 2020 to February 2021; this is from an average of $1,977 to $2,049.
It’s expected to rise further along with leasing volumes over this past month, as the Chinese New Year month is usually a lull period.
Overall, HDB rental rates are still down around 12 per cent from the last peak in August 2013, when rates averaged $2,307. However, it’s worth noting that rental rates were more or less in continuous decline since 2013, so the past few months have made up several years of declining rental. It’s especially surprising, given that the rental market was expected to suffer the most from Covid-19.
What’s causing this to happen?
When HDB rental rates started rising around June (the time of the Circuit Breaker), the most common attribution was to Malaysia’s Movement Control Order (MCO), and “stuck” foreign workers. The reason given was that leasing volumes and prices picked up, because of foreigners unable to return and forced to stay.
However, that alone wouldn’t explain why HDB rental rates continued to soar afterward; and we’re not sure why. Conversations with realtors and analysts have given us a hodgepodge of explanations, including:
- Fewer flats being listed for rental, thus propping up rental prices (which we doubt, since we haven’t seen a notable drop in listings)
- There are more upgraders currently, and these families are renting out flats temporarily while they wait for their new homes to be built
- The Circuit Breaker was stifling, and prompted some younger Singaporeans to decide to move out as soon as possible, renting if they can’t buy
- Construction and renovation delays from Covid-19 have resulted in a greater need for temporary accommodation
It’s also possible that it’s all of the above combined. In any case, 2020 and 2021 are proving to be strange years for the property market; and good ones for flat owners renting out.
2. The rental difference is not very big, in absolute terms
For example, the median rent for a 4-room flat in Bedok is $2,100. The median rent for a 5-room flat in the same town is just $2,200. Likewise, the difference between a 4-room and 5-room flat in Hougang is just $130 ($2,000 and $2,130 respectively).
For reference, the typical size difference between a 4-room and 5-room flat is about 200 to 215 sq.ft (older flats tend to be bigger).
Prospective tenants may want to take note, as the rental costs for a bigger flat may be easily justified in some cases.
3. Newcomers are beginning to creep into the list
4-room flats are a good overall indicator of HDB trends, as they’re the most ubiquitous flat size. Notice that a number of neighbourhoods, that weren’t always on the top 10 lists before, are beginning to creep in among 4-room flats.
Clementi and the non-mature town of Sembawang are starting to see more interest. Clementi’s presence isn’t surprising, as the area has benefitted from proximity to One-North and Buona Vista. For Sembawang, recent improvements – particularly the emergence of Bukit Canberra – suggests this might be a place to watch.
Also note that, in the context of 4-room flats, four of the top five HDB towns are non-mature areas. The lower costs of these estates make it easier to generate a good yield. It’s something to think about, for more investment-minded flat buyers.
Following recovery from Covid-19, we expect that rental rates for HDB flats should continue to pick up
As more foreign workers return to Singapore, there will likely be more demand for rental flats. However, this may be mitigated by the sheer number of flats reaching their MOP this year. If everyone has the same idea to put their flat on the rental market right after five years, we may see the momentum slow.
Otherwise, 2020 and 2021 seem to be the pay-off year for many flat owners; especially those who bought 4-room units early on, in less mature estates.
We’ll keep you updated on the situation as it unfolds, so follow us on Stacked. We’ll also provide you with the most in-depth reviews of new and resale condos alike, in the Singapore private property market.
Yield tables and rent charts are useful reference points, but the units that actually rent well through a cycle, after vacancy, holding costs, and your intended exit, aren't always the ones at the top of the list.
If you'd like to discuss how this applies to your own circumstances, you can reach out for a one-to-one consultation here.
And if you simply have a question or want to share a thought, feel free to write to us at stories@stackedhomes.com. We read every message.





0 Comments