We Compared Old vs New Condos in One of Singapore’s Priciest Neighbourhoods — Here’s What We Found for Smaller Units
Get The Property Insights Serious Buyers Read First: Join 50,000+ readers who rely on our weekly breakdowns of Singapore’s property market.
A seasoned content strategist with over 17 years in the real estate and financial journalism sectors, Ryan has built a reputation for transforming complex industry jargon into accessible knowledge. With a track record of writing and editing for leading financial platforms and publications, Ryan's expertise has been recognised across various media outlets. His role as a former content editor for 99.co and a co-host for CNA 938's Open House programme underscores his commitment to providing valuable insights into the property market.
District 11 (D11) has some of the most famous high-end residential enclaves: think Newton, Novena, Watten Estate and Thomson. Here, the condo landscape has a wide-ranging mix of old and new projects alike; but thanks to its central location, even the oldest condos here can still fetch a premium. D11 is also one of the districts that draw both owner-occupiers as well as landlords, as proximity to the CBD ensures near-constant tenant demand. In light of that, does condo age matter in D11, and how much? Demand seems strong across the board anyway; so does it make sense to go for a lower $PSF, even in an ageing unit? Let’s take a closer look:
Quick Summary:
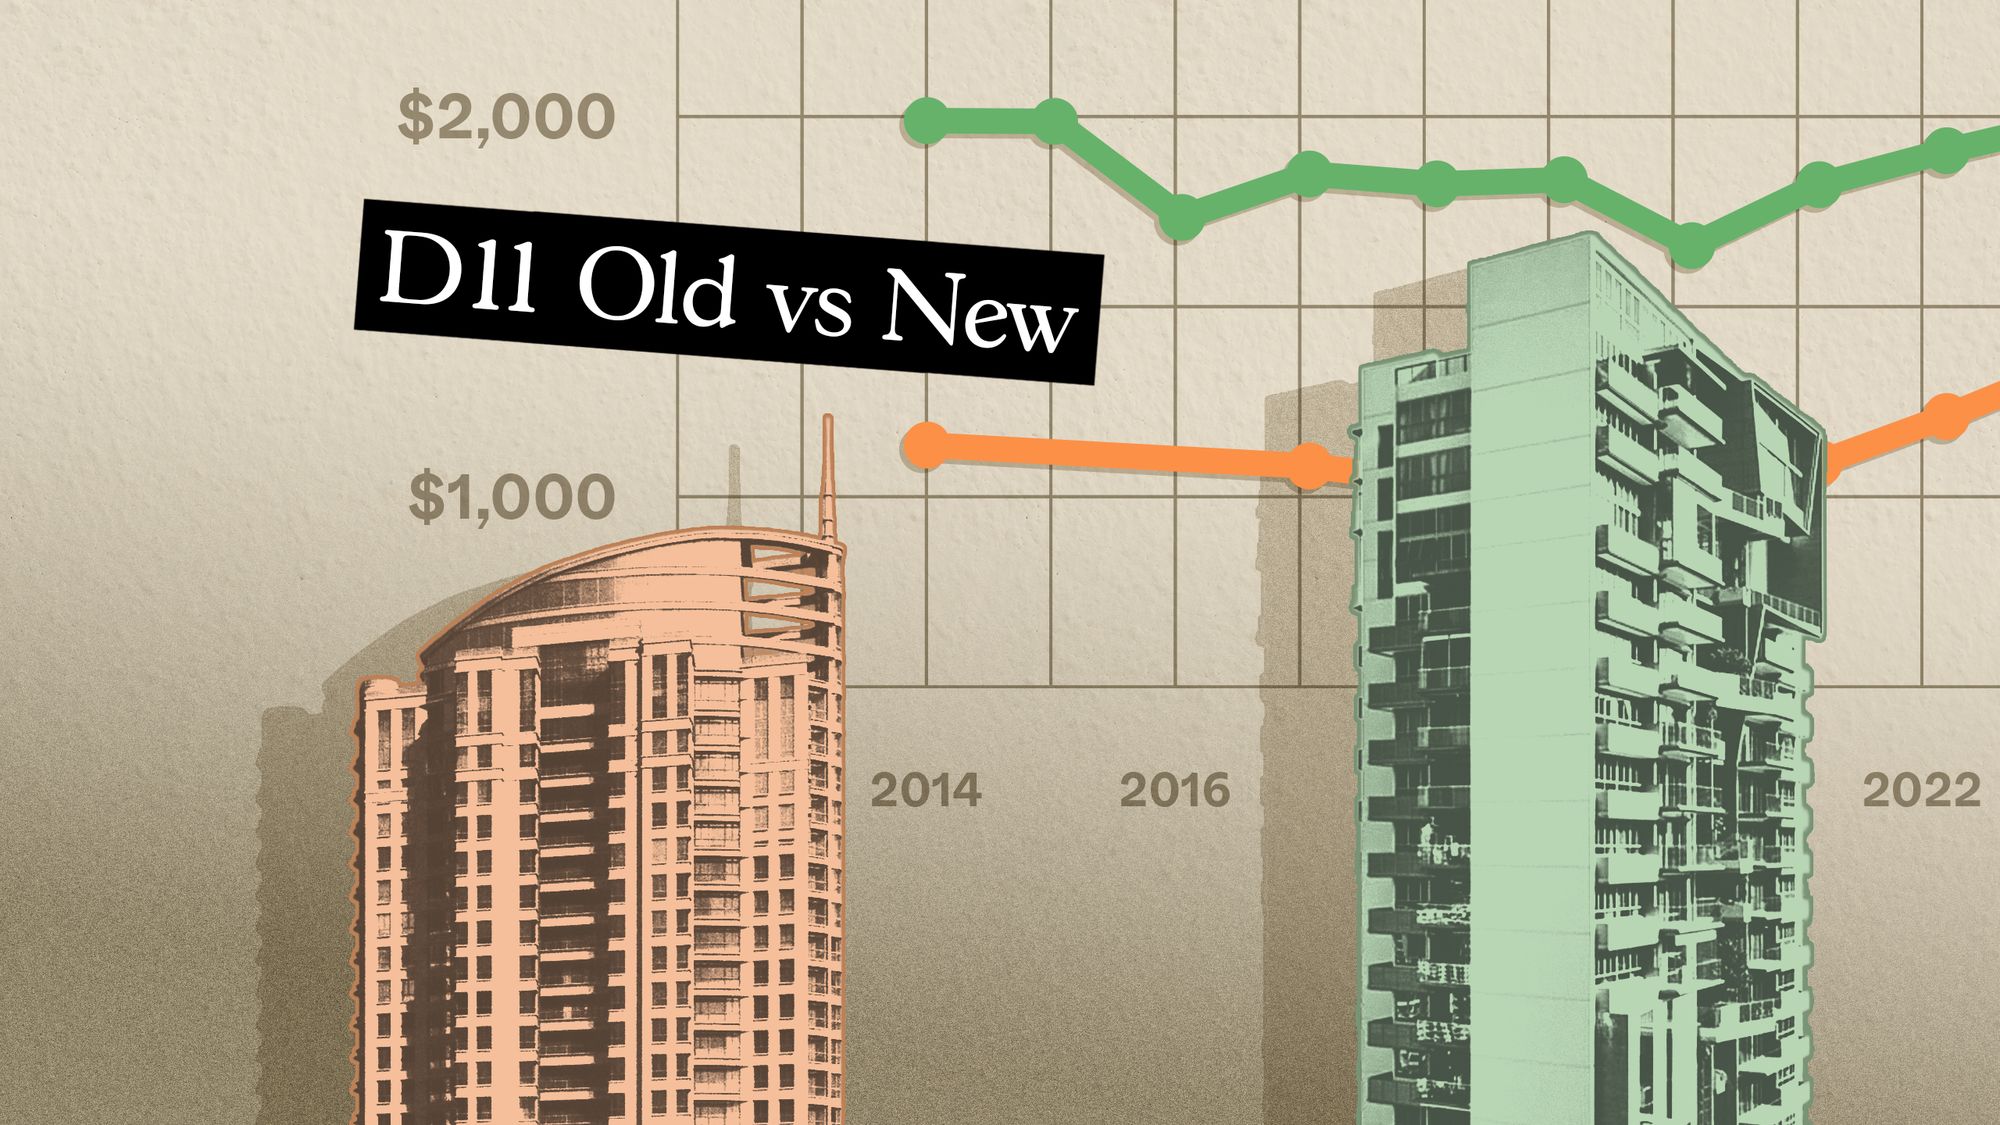
- Older condos in D11 have held their own, with many showing stronger growth than newer counterparts. Their larger unit sizes and lower entry prices continue to attract both home buyers and investors despite their age.
- One-bedders show weaker overall performance, but projects like Hillcrest Arcadia show that size and value can offset age. Its nearly 1,000 sq ft one-bedder unit at under $1 million was quite a find.
- Two-bedders remain the most balanced segment, with newer units leading in $PSF but older ones keeping pace in overall appreciation. Rental yields are strong on both ends, showing that age has limited impact on returns in D11.
Let’s start by looking at the overall performance of resale condos in D11
We’ll use resale transactions, to exclude any distortions from developer discounts:
| Year | D11 | All non-landed private properties |
| 2014 | $1,534 | $1,215 |
| 2015 | $1,481 | $1,197 |
| 2016 | $1,466 | $1,248 |
| 2017 | $1,677 | $1,293 |
| 2018 | $1,674 | $1,323 |
| 2019 | $1,563 | $1,346 |
| 2020 | $1,598 | $1,280 |
| 2021 | $1,704 | $1,354 |
| 2022 | $1,786 | $1,473 |
| 2023 | $1,936 | $1,595 |
| 2024 | $1,994 | $1,681 |
| Annualised | 2.66% | 3.30% |

In terms of $PSF and percentage gain, condos in D11 have appreciated slower in the wider market. However, this is just a general snapshot. We need to look at the performance of 99-year leasehold properties, separately from freehold counterparts:
| Year | D11 | All non-landed private properties |
| 2014 | $1,417 | $1,066 |
| 2015 | $1,394 | $1,051 |
| 2016 | $1,366 | $1,140 |
| 2017 | $1,317 | $1,123 |
| 2018 | $1,517 | $1,164 |
| 2019 | $1,335 | $1,189 |
| 2020 | $1,447 | $1,159 |
| 2021 | $1,463 | $1,227 |
| 2022 | $1,678 | $1,370 |
| 2023 | $1,770 | $1,516 |
| 2024 | $1,799 | $1,616 |
| Annualised | 2.42% | 4.25% |

Leasehold properties in D11 have also trailed the wider market, at least in terms of $PSF. This is partly due to D11 properties being pricier, on account of the central location (see the table above), so this results in slower percentage gains.
For completeness, here’s a look at how the 999-year and freehold properties have performed:
| Year | D11 | All non-landed private properties |
| 2014 | $1,559 | $1,385 |
| 2015 | $1,493 | $1,366 |
| 2016 | $1,484 | $1,393 |
| 2017 | $1,745 | $1,461 |
| 2018 | $1,706 | $1,524 |
| 2019 | $1,612 | $1,572 |
| 2020 | $1,631 | $1,488 |
| 2021 | $1,752 | $1,586 |
| 2022 | $1,814 | $1,709 |
| 2023 | $1,974 | $1,799 |
| 2024 | $2,032 | $1,855 |
| Annualised | 2.68% | 2.97% |

When it comes to freehold, the price gap for D11 (on a $PSF basis) is not as wide as compared to leasehold.
Now let’s get to the heart of our query: how well do older leasehold condos in D11 perform, compared to newer counterparts?
We’ll look at leasehold because these are the projects that are most susceptible to age (due to lease decay.) Our definition of “new” is projects that are 20 years old or younger, while “old” projects refer to those above the age of 20.
This is because most condos in Singapore seem to typically last around 19 to 24 years before redevelopment, making 20 years a good midpoint. It’s also conventionally accepted in the market that an “old” or “older” condo is one that’s past the 20 year mark.
To maintain consistency, we’ll also define newer condos as projects with leases commencing between 1994 and 2014, and older condos as those with leases starting in 1993 or earlier. This ensures that we’re comparing the same set of developments across time. We’ll only use sub sale and resale transactions, to prevent distortions from developer discounts.
| Year | New | Old | Difference |
| 2014 | $1,652 | $1,057 | $595 |
| 2015 | $1,516 | $1,027 | $489 |
| 2016 | $1,492 | $834 | $658 |
| 2017 | $1,539 | $888 | $650 |
| 2018 | $1,595 | $952 | $642 |
| 2019 | $1,614 | $970 | $644 |
| 2020 | $1,641 | $960 | $681 |
| 2021 | $1,707 | $1,021 | $687 |
| 2022 | $1,787 | $1,179 | $607 |
| 2023 | $1,924 | $1,244 | $680 |
| 2024 | $1,916 | $1,253 | $663 |
| Annualised | 1.49% | 1.72% |

Over the past decade, older projects have seen faster growth of 1.72 per cent, versus 1.49 per cent for newer counterparts. The gap between old and new has also widened over time.
That said, the lower $PSF of older properties often reflects their larger unit sizes, so their quantum may be much higher than newer ones. To get a clearer sense of this, let’s compare the actual quantum of the two:
| Year | New | Old | Difference |
| 2014 | $2,722,217 | $2,453,533 | $268,684 |
| 2015 | $1,843,995 | $2,593,125 | -$749,130 |
| 2016 | $1,772,110 | $2,323,667 | -$551,557 |
| 2017 | $1,873,160 | $1,745,628 | $127,532 |
| 2018 | $2,169,425 | $3,192,333 | -$1,022,908 |
| 2019 | $2,211,382 | $2,331,269 | -$119,887 |
| 2020 | $2,050,475 | $2,816,000 | -$765,525 |
| 2021 | $2,061,486 | $2,941,861 | -$880,375 |
| 2022 | $2,358,851 | $3,525,000 | -$1,166,149 |
| 2023 | $2,217,897 | $2,810,833 | -$592,936 |
| 2024 | $2,432,232 | $3,637,778 | -$1,205,545 |
| % increase from 2014 to 2024 | -10.65% | 48.27% |

Interestingly, newer projects saw an overall price decline of about 10.65 per cent, while older properties rose by roughly 48.27 per cent. Also, for most of the past decade, older developments commanded higher average prices than newer ones – not the period from 2015 to 2022.
So far, this suggests demand for older, larger units has remained strong, while the market shrugged off newer condos entering at smaller sizes and a higher $PSF.
However, the transaction volume and type of units sold each year can skew averages, so we should check that next:
*Note: There are no freehold/999-year lease condos that are 20 years old or newer in D11, so we will exclude freehold from our comparison.
1-bedroom units
More from Stacked
Old vs New Family-Sized Condos in District 9: A Data-Driven Analysis of Value in 2025
Previously, we looked at price movements of older versus newer one and two-bedders in District 9 (D9). When it comes…
Average $PSF
| Year | New | Old | Difference |
| 2014 | $1,961 | $1,110 | $851 |
| 2015 | $1,959 | ||
| 2016 | $1,707 | ||
| 2017 | $1,821 | $1,055 | $766 |
| 2018 | $1,795 | $1,015 | $780 |
| 2019 | $1,806 | $1,055 | $751 |
| 2020 | $1,633 | $1,136 | $498 |
| 2021 | $1,793 | $1,063 | $729 |
| 2022 | $1,882 | 1185 | $697 |
| 2023 | $1,960 | $1,322 | $638 |
| 2024 | $1,966 | $1,023 | $943 |
| Annualised | 0.03% | -0.81% |

One-bedders in D11, both old and new, have shown weak performance. The older counterparts fared worse with an average decline of 0.81 per cent, whilst newer counterparts saw flat price movement.
Newer projects still consistently transacted at higher $PSF values, which is a market norm; so the $PSF gap between the older and newer one-bedders has widened over the decade.
Now let’s look at the actual quantum of the one-bedders:
Average price
| Year | New | Old | Difference |
| 2014 | $1,202,500 | $875,000 | $327,500 |
| 2015 | $1,069,000 | ||
| 2016 | $958,278 | ||
| 2017 | $1,018,454 | $663,363 | $355,091 |
| 2018 | $1,082,333 | $940,000 | $142,333 |
| 2019 | $1,050,000 | $893,333 | $156,667 |
| 2020 | $982,002 | $1,045,000 | -$62,998 |
| 2021 | $1,049,089 | $814,500 | $234,589 |
| 2022 | $1,042,259 | $1,020,000 | $22,259 |
| 2023 | $1,135,500 | $1,210,000 | -$74,500 |
| 2024 | $1,111,600 | $980,000 | $131,600 |
| % increase from 2014 to 2024 | -7.56% | 12.00% |

There’s a significant divergence in performance, with older one-bedders managing a 12 per cent increase, but newer ones seeing a decline of 7.56 per cent.
The reason for this is evident when we look at unit sizes:
Average size (based on units transacted)
| Year | New | Old |
| 2014 | 619 | 813 |
| 2015 | 544 | |
| 2016 | 564 | |
| 2017 | 562 | 653 |
| 2018 | 606 | 926 |
| 2019 | 581 | 847 |
| 2020 | 603 | 921 |
| 2021 | 588 | 770 |
| 2022 | 556 | 851 |
| 2023 | 579 | 915 |
| 2024 | 566 | 958 |

Despite being classified as one-bedders, the older units have a square footage that can rival larger units. The average one-bedder size transacted in 2024, for older properties, is a massive 958 sq ft.
Even setting aside GFA harmonisation (which would make the older ones average about 900+ sq ft., deducting six per cent for air-con ledges), the size of the older one-bedders are what we’d consider three-bedders today.
For D11, the market shows a clear preference for these older, larger, and hence more versatile one-bedders.
These are the total number of transactions we looked at:
No. of transactions
| Year | New | Old |
| 2014 | 2 | 4 |
| 2015 | 2 | |
| 2016 | 5 | |
| 2017 | 13 | 3 |
| 2018 | 3 | 1 |
| 2019 | 2 | 3 |
| 2020 | 7 | 2 |
| 2021 | 9 | 4 |
| 2022 | 3 | 2 |
| 2023 | 6 | 1 |
| 2024 | 5 | 1 |
Let’s look at the specific project names, for one-bedders transacted in 2024
New
| Project | Average $PSF | Average price | Average size | No. of unit sold | Lease start year |
| SOLEIL @ SINARAN | $1,966 | $1,111,600 | 566 | 5 | 2006 |
Old
| Project | Average $PSF | Average price | Average size | No. of unit sold | Lease start year |
| HILLCREST ARCADIA | $1,023 | $980,000 | 958 | 1 | 1975 |
The size and price difference makes it clear why the majority of buyers lean toward the older side. Hillcrest Arcadia offers a massive 958 sq ft at a quantum of below $1 million, which is a very rare price point in today’s market. Conversely, the newer Soleil @ Sinaran pushes past $1.1 million for a mere 566 sq ft.
For those curious about the size, it’s because Hillcrest Arcadia (completed in 1980 with a lease from 1975) was from the earliest generation of condos; back then, one-bedders were not seen as merely compact units for tenants. They were still considered a form of high-end living (a “bungalow in the sky” concept), hence the huge unit sizes.
Here’s a look a look at the side-by-side performance between the two:
| Year | HILLCREST ARCADIA | SOLEIL @ SINARAN |
| 2014 | $1,110 | $2,262 |
| 2015 | $1,959 | |
| 2016 | $1,738 | |
| 2017 | $1,055 | $1,880 |
| 2018 | $1,015 | $1,924 |
| 2019 | $1,055 | $1,806 |
| 2020 | $1,136 | $1,681 |
| 2021 | $1,063 | $1,869 |
| 2022 | $1,185 | $1,882 |
| 2023 | $1,322 | $1,951 |
| 2024 | $1,023 | $1,966 |
| Annualised | -0.81% | -1.39% |
While both projects saw a decline in $PSF, it was still the newer one-bedder (Soleil) that saw a steeper drop.
We’d normally also compare rental yields, but we can’t for this project as Soleil @ Sinaran has no record of rentals for the one-bedders.
2-bedroom units
Average $PSF
| Year | New | Old | Difference |
| 2014 | $1,590 | $1,143 | $447 |
| 2015 | $1,539 | $1,003 | $536 |
| 2016 | $1,594 | $929 | $665 |
| 2017 | $1,549 | $977 | $572 |
| 2018 | $1,648 | $1,012 | $636 |
| 2019 | $1,750 | $1,042 | $708 |
| 2020 | $1,763 | $1,008 | $755 |
| 2021 | $1,708 | $1,082 | $626 |
| 2022 | $1,838 | $1,140 | $698 |
| 2023 | $1,962 | $1,252 | $710 |
| 2024 | $1,995 | ||
| Annualised (2014 to 2023) | 2.36% | 1.02% |

There were no transactions for older two-bedders in 2024, so we’ll base the comparison on annualised growth from 2014 to 2023 instead.
Over this period, newer two-bedders recorded an annualised price growth of 2.36 per cent, compared to 1.02 per cent for older units. As expected, newer projects consistently transacted at a higher $PSF throughout the decade, and the gap between the two has widened.
Two-bedders have generally seen better results than one-bedders in D11 though; whether they’re older or newer.
Now let’s look at their quantum:
Average price
| Year | New | Old | Difference |
| 2014 | $1,533,333 | $1,275,000 | $258,333 |
| 2015 | $1,508,222 | $1,425,000 | $83,222 |
| 2016 | $1,543,991 | $1,320,000 | $223,991 |
| 2017 | $1,534,286 | $1,106,857 | $427,429 |
| 2018 | $1,684,995 | $1,438,000 | $246,995 |
| 2019 | $1,815,462 | $1,480,333 | $335,128 |
| 2020 | $1,775,700 | $1,400,000 | $375,700 |
| 2021 | $1,754,125 | $1,538,000 | $216,125 |
| 2022 | $1,836,399 | $1,620,000 | $216,399 |
| 2023 | $1,973,163 | $1,670,000 | $303,163 |
| 2024 | $2,027,667 | ||
| % increase from 2014 to 2023 | 28.68% | 30.98% |

Both new and old two-bedders saw notable appreciation in average price. Newer units rose by about 28.7 per cent, while older ones climbed higher at 31 per cent.
The fact that older two-bedders kept pace (and even edged ahead of newer ones in percentage growth) highlights that D11’s older projects can still perform.
Again, spaciousness may be another factor:
Average size (based on units transacted)
| Year | New | Old |
| 2014 | 965 | 1158 |
| 2015 | 981 | 1421 |
| 2016 | 969 | 1421 |
| 2017 | 991 | 1180 |
| 2018 | 1030 | 1421 |
| 2019 | 1037 | 1421 |
| 2020 | 1005 | 1389 |
| 2021 | 1030 | 1421 |
| 2022 | 1004 | 1421 |
| 2023 | 1006 | 1335 |
| 2024 | 1019 |

These unit sizes would be considered three or even four-bedders today; and we can see that the older projects are consistently larger.
This is the total number of transactions we looked at:
No. of transactions
| Year | New | Old |
| 2014 | 6 | 2 |
| 2015 | 9 | 1 |
| 2016 | 13 | 1 |
| 2017 | 21 | 7 |
| 2018 | 24 | 1 |
| 2019 | 13 | 3 |
| 2020 | 14 | 1 |
| 2021 | 24 | 1 |
| 2022 | 22 | 1 |
| 2023 | 17 | 2 |
| 2024 | 12 |
Now let’s look at the specific projects by name:
New
| Project | Average $PSF | Average price | Average size | No. of unit sold | Lease start year |
| AMARYLLIS VILLE | $1,884 | $1,816,539 | 964 | 7 | 1997 |
| ROCHELLE AT NEWTON | $1,915 | $1,938,000 | 1012 | 1 | 2008 |
| SOLEIL @ SINARAN | $2,028 | $2,098,889 | 1038 | 9 | 2006 |
Old
| Project | Average $PSF | Average price | Average size | No. of unit sold | Lease start year |
| HILLCREST ARCADIA | $1,252 | $1,670,000 | 1335 | 2 | 1975 |
From here, you’d notice that resale prices among the newer condos are quite close to new launch prices in 2025:
Average prices ranged from about $1.82 million at Amaryllis Ville to $2.1 million at Soleil @ Sinaran. This is about the price of a new launch two-bedder today (around $1.8 million to $2 million), but the aforementioned projects would give you more space for an almost similar price tag.
By contrast, the only older development with two-bedder transactions was Hillcrest Arcadia, where units averaged $1,670,000; but the 1,335 sq ft layout would be on par with a three or even four-bedder by newer standards. So in this sense, the price discrepancy isn’t too surprising.
Next, let’s examine how the two-bedders in these individual projects have performed over the past decade.
| Year | SOLEIL @ SINARAN | AMARYLLIS VILLE | HILLCREST ARCADIA | ROCHELLE AT NEWTON |
| 2014 | $1,837 | $1,540 | $936 | |
| 2015 | $1,741 | $1,508 | $1,003 | $1,522 |
| 2016 | $1,778 | $1,479 | $929 | |
| 2017 | $1,712 | $1,468 | $803 | $1,463 |
| 2018 | $1,733 | $1,528 | $1,012 | |
| 2019 | $1,829 | $1,490 | $1,042 | |
| 2020 | $1,820 | $1,554 | $1,008 | |
| 2021 | $1,751 | $1,684 | $1,082 | $1,654 |
| 2022 | $1,902 | $1,817 | $1,140 | $1,790 |
| 2023 | $2,028 | $1,884 | $1,252 | $1,915 |
| 2024 | $2,019 | $1,996 | $1,917 | |
| Annualised (2014 to 2023) | 1.11% | 2.26% | 3.28% | – |
Since there were no transactions in certain years, we’ll focus only on developments with recorded transactions in both 2014 and 2023.
Interestingly, Hillcrest Arcadia – despite being the oldest project above – recorded the highest annualised price growth. As we saw above, its comparatively low entry price and larger unit sizes likely keep it attractive, even if it is older.
Next, let’s take a look at how the rental yields compare across these same projects.
| Project | Average price in 2023 | Average monthly rent (June 2024 – June 2025) | Rental yield |
| ROCHELLE AT NEWTON | $1,938,000 | $4,817 | 2.98% |
| AMARYLLIS VILLE | $1,816,539 | $5,057 | 3.34% |
| HILLCREST ARCADIA | $1,670,000 | $4,775 | 3.43% |
| SOLEIL @ SINARAN | $2,098,889 | $6,613 | 3.78% |
It’s interesting that Soleil @ Sinaran, despite having the highest average price, also achieved the highest rental yield at 3.78 per cent. Perhaps this is due to its proximity to Novena MRT station (NSL), or the proximity of Tan Tock Sent Hospital.
(Whilst not as favoured by owner-occupiers, landlords may favour proximity to hospitals, as the sizeable foreign staff in healthcare make good potential tenants.)
Hillcrest Arcadia recorded the second-highest yield at 3.43 per cent, which is largely on account of its lower unit price.
Conclusion:
Overall, the data shows that newer condos in D11 continue to command higher $PSF prices; but the performance of older developments – particularly Hillcrest Arcadia – suggests that age alone isn’t a barrier to strong appreciation or rental demand.
Older projects tend to offer larger living spaces at lower entry prices, and this can look especially attractive in the 2025 market (e.g., Hillcrest’s sub-$1 million pricing for a one-bedder that’s almost the size of a three-bedder.)
We also see a marked preference for two-bedders as opposed to one-bedders, based on overall performance over the decade. A main takeaway here, however, is that buyers and investors don’t need to be too worried about age in D11 – in fact, the larger and older projects can be more attractive.
Next up, join us on Stacked Pro and as well look up the results for three and four-bedders in D11, and whether age has any effect on them. If you’d like to get in touch for a more in-depth consultation, you can do so here.
Ryan J
A seasoned content strategist with over 17 years in the real estate and financial journalism sectors, Ryan has built a reputation for transforming complex industry jargon into accessible knowledge. With a track record of writing and editing for leading financial platforms and publications, Ryan's expertise has been recognised across various media outlets. His role as a former content editor for 99.co and a co-host for CNA 938's Open House programme underscores his commitment to providing valuable insights into the property market.Read next from Property Investment Insights
Property Investment Insights We Compared Old vs New Condos in One of Singapore’s Fastest-Changing Neighbourhoods — Here’s What We Found Out
Property Investment Insights We Compared Old vs New Condos in One of Singapore’s Priciest Family Neighbourhoods: Here’s What We Found For Family-Sized Units in District 21
Property Investment Insights Which Condos Made the Biggest Profits in 2025? One Owner Earned $3.8M in Just 5 Years
Property Investment Insights Are Older One- and Two-Bedders in District 21 Holding Up Against the New Launches? We Break It Down
Latest Posts
Property Market Commentary 6 Curiously Abandoned Houses In Singapore And The Stories Behind Them
Property Market Commentary Which HDB Towns Are Getting Close To Condo Prices In 2025?
Editor's Pick This New Upper Bukit Timah Condo Starts From $993K: But Would You Trade MRT Convenience for Greenery?
Editor's Pick “I Didn’t Think Property Prices Could Go Up So Fast Anymore With ABSD” Why One Buyer’s Regret Still Feels Familiar Today
On The Market We Found 5 Freehold 1-Bedroom Condos Under $1 Million With The Most Efficient Layouts
Editor's Pick I Toured A Rare Quiet Yet Central Freehold Landed Enclave Where Houses Sell For $12 Million
Singapore Property News The Hidden Price of Upgrading To A Condo In Singapore: What Most Buyers Don’t Budget For
Editor's Pick W Residences Marina View – Singapore Condo Review: A Luxury Condo Above A 5-Star Hotel From $1.77m
On The Market We Found 5 Spacious HDB Flats Above 1,300 Sqft You Can Still Buy Under $600K
Property Market Commentary Why Singapore Homes Feel So Unaffordable (Even If Incomes Have Risen)
Editor's Pick Why Older Freehold Condos Are Struggling to Go En-Bloc in 2025
Property Advice Most New Condo Buyers in Singapore Forget to Check This Before Buying (Until It’s Too Late)
Singapore Property News Why This Rare New Queenstown Condo Nearly Sold Out Even At $2,800 Psf
On The Market Surprisingly Affordable 5 bedroom Condos You Can Buy Right Now Under $2.3 Million
Landed Home Tours I Toured A Rare Freehold Landed Street Where $5M Still Gets You A Proper Family Home