

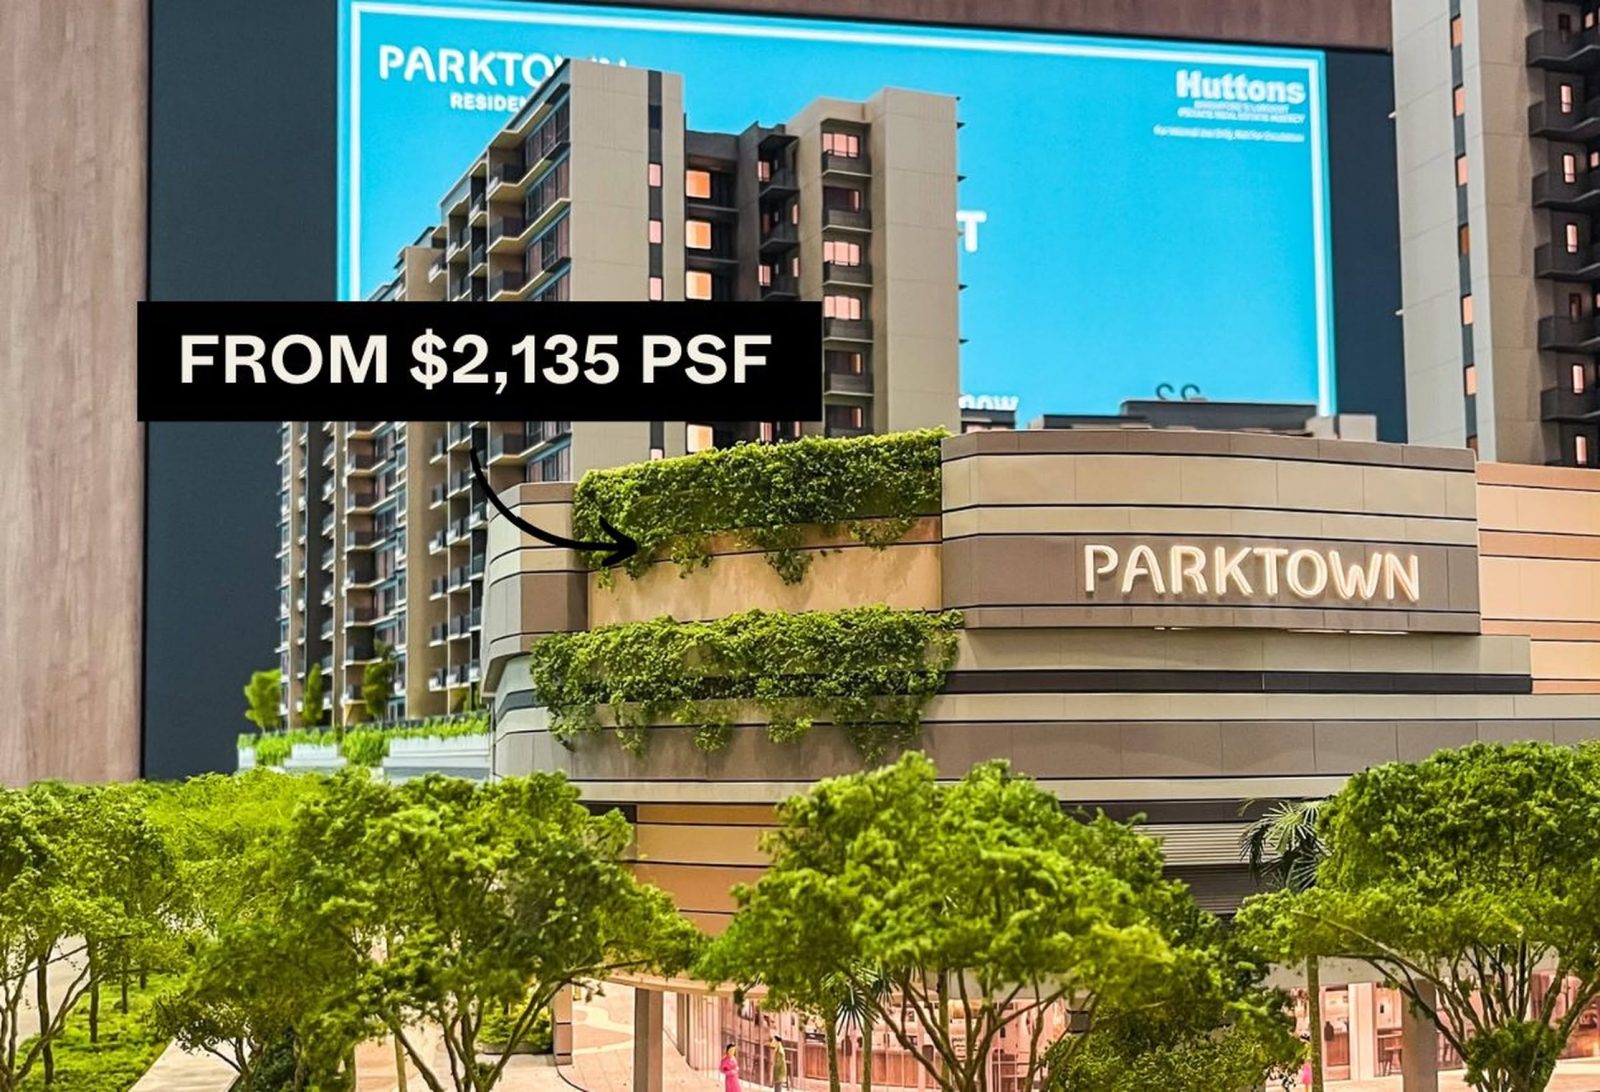
As we’ve said in our full review, Parktown Residence will be the first integrated development in Tampines, featuring a retail mall, direct MRT access, a new bus interchange, and a community hub. This marks a milestone for the area, which is still undergoing transformation, positioning Parktown Residence as a key focal point in the district’s long-term growth.
However, while the convenience of an integrated development is undeniable, the question is how much of a premium should an integrated development command is what would be on most buyer’s minds. To determine that, we’d have to look at Parktown Residence’s price point in comparison to other integrated developments, nearby resale condos, and the new launch market. In this Parktown Residence pricing review, we will cover:
- Parktown Residence Indicative Pricing
- The land price and where it stands in the past 2 years
- Who the target audience for Parktown Residence is
- What the price premium is, and whether it makes sense
- The competition in the surrounding area
- How it compares against other available new launches today
The challenge for many buyers today isn't access to information.
It's interpreting that information in a way that makes sense for their finances, goals, and stage of life.
Over time, that's also why we decided to work with agents who shared the same data-driven and advisory-led approach behind our editorial, consultants who could help readers think through decisions more objectively, rather than simply push transactions.
Today, the team has worked with more than 2,000 clients across over $5B in property transactions.
Parktown Residence Indicative Pricing
| Type | Size | Price | $PSF |
| 1+Study | 463 | $1,070,000 | $2,311 |
| 2 Bedroom | 592 | $1,330,000 | $2,247 |
| 3 Bedroom | 926 | $2,070,000 | $2,235 |
| 4 Bedroom | 1335 | $2,850,000 | $2,135 |
| 5 Bedroom | 1679 | $3,780,000 | $2,251 |
From the indicative prices, you can see that the 1+Study unit is priced just above the $1 million mark. The 2-bedroom units are slightly higher, starting at $1.33 million, while 3-bedroom units begin at just over $2 million. These price points set the stage for a premium positioning in the market, particularly given the integrated nature of the development and the fact that it’s in a less developed part of Tampines.
The starting $PSF ranges from $2,135 to $2,311. Given the progressive staging of prices, we estimate an average $PSF of around $2,300 - $2,400, depending on unit size and floor level. This pricing is in line with other integrated developments but notably higher than non-integrated projects in the same region. The premium pricing reflects the convenience and amenities that come with integrated developments, but it also raises the question of whether buyers are willing to pay a higher price for this added convenience.
To give buyers a clearer picture of potential price movements, we have included a pricing matrix that outlines what unit prices could look like at different $PSF levels ranging from $2,000 to $2,800. This helps illustrate the impact of varying price points on affordability across different unit types.
| Bedroom Type | 1+Study | 2 Bedroom | 3 Bedroom | 4 Bedroom | 5 Bedroom |
| $PSF | 463 Sq Ft | 592 Sq Ft | 926 Sq Ft | 1,335 Sq Ft | 1,679 Sq Ft |
| $2,000 | $926,000 | $1,184,000 | $1,852,000 | $2,670,000 | $3,358,000 |
| $2,100 | $972,300 | $1,243,200 | $1,944,600 | $2,803,500 | $3,525,900 |
| $2,200 | $1,018,600 | $1,302,400 | $2,037,200 | $2,937,000 | $3,693,800 |
| $2,300 | $1,064,900 | $1,361,600 | $2,129,800 | $3,070,500 | $3,861,700 |
| $2,400 | $1,111,200 | $1,420,800 | $2,222,400 | $3,204,000 | $4,029,600 |
| $2,500 | $1,157,500 | $1,480,000 | $2,315,000 | $3,337,500 | $4,197,500 |
| $2,600 | $1,203,800 | $1,539,200 | $2,407,600 | $3,471,000 | $4,365,400 |
| $2,700 | $1,250,100 | $1,598,400 | $2,500,200 | $3,604,500 | $4,533,300 |
| $2,800 | $1,296,400 | $1,657,600 | $2,592,800 | $3,738,000 | $4,701,200 |
At $2,400 PSF, prices do look within reasonable expectations for an integrated development, especially in today’s new launch backdrop in 2025.
While Parktown Residence is situated in the less mature Tampines North area, its direct connectivity to a mall and an MRT station significantly enhances its attractiveness. This level of convenience could help buyers justify its pricing.
Additionally, the developer acquired the land at $885 PSF per plot ratio (ppr), making it one of the lowest land costs secured in the past two years for an Integrated Development.
This relatively lower land acquisition cost suggests that the developer has more flexibility in pricing units competitively compared to other recent launches that had higher land costs. However, we do have to add that Integrated Developments typically come with higher construction costs as well - as compared to regular condo projects.
| Date of Award | Location | GFA(m2) | Successful Tender Price | $PSF PPR |
| 21/02/2024 | Orchard Boulevard | 24,610 | $428,280,980 | $1,617 |
| 11/07/2023 | Marina Gardens Lane | 68,573 | $1,034,480,000 | $1,402 |
| 15/11/2023 | Lorong 1 Toa Payoh | 66,121 | $968,000,000 | $1,360 |
| 27/06/2024 | River Valley Green (Parcel A) | 32,527 | $463,999,999 | $1,325 |
| 07/08/2024 | Zion Road (Parcel B) | 52,002 | $730,088,888 | $1,304 |
| 20/05/2024 | Holland Drive | 58,224 | $805,390,000 | $1,285 |
| 15/11/2023 | Clementi Avenue 1 | 47,079 | $633,447,945 | $1,250 |
| 15/11/2023 | Pine Grove (Parcel B) | 52,583 | $692,388,000 | $1,223 |
| 16/04/2024 | Zion Road (Parcel A) | 85,557 | $1,106,888,000 | $1,202 |
| 08/02/2024 | Media Circle | 30,834 | $395,288,889 | $1,191 |
| 07/08/2024 | Margaret Drive | 39,994 | $497,000,000 | $1,154 |
| 10/08/2023 | Jalan Tembusu | 72,003 | $828,800,000 | $1,069 |
| 21/01/2025 | Dairy Farm Walk | 45,951 | $504,515,000 | $1,020 |
| 10/10/2024 | Tampines Street 94 | 61834 | $668,280,000 | $1,004 |
| 13/04/2023 | Lentor Gardens | 45,921 | $486,800,222 | $985 |
| 18/09/2023 | Lentor Central | 41,169 | $435,166,426 | $982 |
| 16/04/2024 | Upper Thomson Road (Parcel B) | 80,060 | $779,555,000 | $905 |
| 18/09/2023 | Champions Way | 30,309 | $294,889,000 | $904 |
| 26/11/2024 | Faber Walk | 36,114 | $349,857,988 | $900 |
| 11/07/2023 | Tampines Avenue 11 | 126700 | $1,206,390,880 | $885 |
| 07/08/2024 | De Souza Avenue | 30,793 | $278,900,000 | $841 |
| 21/01/2025 | Tengah Garden Avenue | 76,376 | $675,000,000 | $821 |
| 07/08/2024 | Canberra Crescent | 32,698 | $279,000,800 | $793 |
| 20/06/2023 | Parry Avenue | 18,077 | $71,988,000 | $370 |
Another thing we should point out is the purchase of the Government Land Sale (GLS) site at Tampines Street 94 for $1,004 PSF PPR. This site is located right next to Tampines West MRT on the Downtown Line and would have an underground connection straight to the MRT. Additionally, the site includes a commercial component, meaning it is not entirely residential and will provide added convenience for residents with amenities at their doorstep.
Since Parktown Residence was purchased at a lower land rate and is launching first, there is a strong likelihood that the Tampines Street 94 site will be priced higher when it launches. This bodes well for Parktown Residence, as a higher-priced future development nearby could provide price support and long-term appreciation potential - provided the market accepts Parktown Residence’s initial pricing.
Who is the target audience?
Given its integrated nature, Parktown Residence would be especially appealing to those seeking the ultimate convenience of living. These could be buyers just looking for a more affordable and new Integrated Development. However, the primary target audience for Parktown Residence is likely to be HDB upgraders in the area who are looking to transition from their HDB to a private condo while still benefiting from living in the same neighbourhood and convenience.
| HDB Town | Land Area (Hectares) Total | Land Area (Hectares) Residential | Dwelling Units Under Management as at 31 March 2024 | Projected Ultimate |
| Ang Mo Kio | 825 | 303 | 51,309 | 66,000 |
| Bedok | 996 | 440 | 64,415 | 96,000 |
| Bishan | 690 | 172 | 19,676 | 34,000 |
| Bukit Batok | 785 | 291 | 46,982 | 56,000 |
| Bukit Merah | 858 | 312 | 54,153 | 68,000 |
| Bukit Panjang | 489 | 219 | 37,098 | 44,000 |
| Choa Chu Kang | 612 | 320 | 50,171 | 66,000 |
| Clementi | 412 | 203 | 29,709 | 39,000 |
| Geylang | 678 | 214 | 34,306 | 50,000 |
| Hougang | 1309 | 367 | 57,557 | 72,000 |
| Jurong East | 384 | 165 | 24,122 | 33,000 |
| Jurong West | 987 | 480 | 76,580 | 94,000 |
| Kallang/ Whampoa | 852 | 246 | 40,580 | 74,000 |
| Pasir Ris | 601 | 318 | 29,654 | 44,000 |
| Punggol | 957 | 374 | 60,833 | 96,000 |
| Queenstown | 858 | 227 | 32,991 | 63,000 |
| Sembawang | 708 | 331 | 30,330 | 65,000 |
| Sengkang | 1055 | 397 | 76,265 | 96,000 |
| Serangoon | 737 | 163 | 21,631 | 30,000 |
| Tampines | 1200 | 549 | 82,465 | 110,000 |
| Tengah | 740 | 165 | 4,260 | 42,000 |
| Toa Payoh (includes Bidadari) | 556 | 248 | 44,868 | 61,000 |
| Woodlands | 1262 | 486 | 71,947 | 102,000 |
| Yishun | 778 | 398 | 69,601 | 84,000 |
| Other Estates | 126 | 22,412 | 25,000 | |
Source: HDB Annual Report 23/24
Tampines has the highest number of dwelling units among Singapore’s HDB estates, which means there is a potential pool of buyers for developments like Parktown Residence. The development’s location within this estate provides some context for future demand, though it is important to note that actual demand will depend on various factors.
The integrated nature of Parktown Residence, with its amenities such as a retail mall and MRT access, adds convenience for residents, which could make it appealing to buyers looking for both private living and easy access to facilities. This is a relevant factor in its market positioning.
For HDB upgraders, the demand will likely be focused on larger units, such as 3-bedroom apartments and above, as many families typically seek at least 3 bedrooms when upgrading from a 4- or 5-room flat.
Tampines also has several newer HDB flats, particularly those built around 2020, which will start to reach their Minimum Occupation Period (MOP) over the next few years. As these units become available for resale, there may be some overlap in demand with developments like Parktown Residence, though how many will consider upgrading is uncertain. In total, around 16,000 HDB units built since 2020 could see their MOP in the coming years.
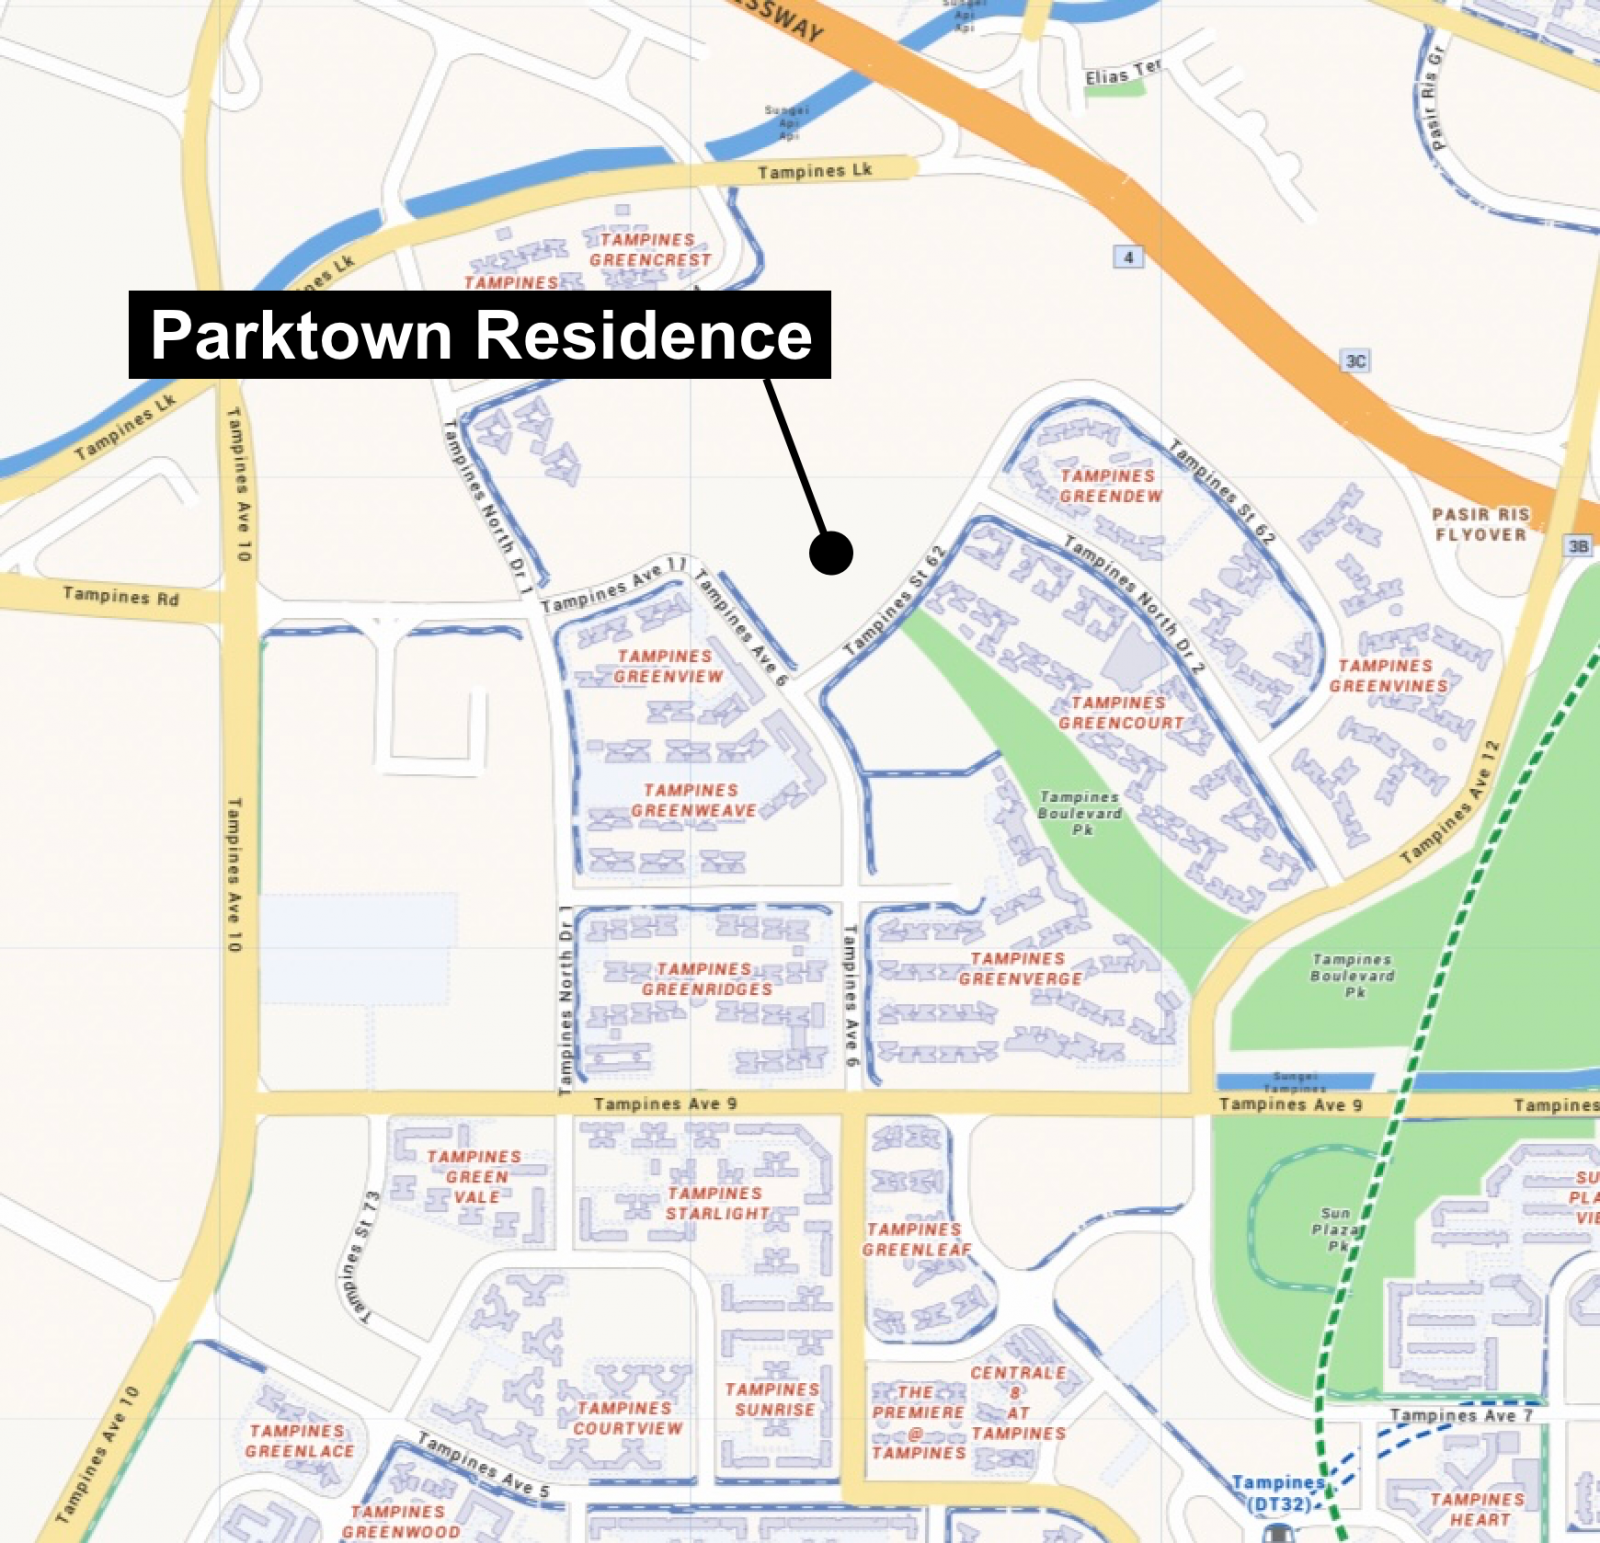
But here's something peculiar about the unit mix on offer: Parktown Residence offers a range of unit types, but the distribution may not align with the typical HDB Upgrader segment.
Why Parktown Residence’s unit mix is interesting
| Bedroom Type | Unit Type | No. of Units | Size (sq ft) | Unit Breakdown |
| 1-Bedroom + Study | AS1/ AS2/ AS3/ AS4 | 73 | 463 / 506 sq ft | 6.10% |
| 2-Bedroom | B1/ B2/ B2(p)/ B3 | 160 | 592 sq ft | 49.10% |
| 2-Bedroom Premium | BP1/ BP1(p)/ BP2/ BP2 (p)/ BP3 / BP3 (p)/ BP4 / BP4(p)/ BP5 | 292 | 678 / 721 sq ft | |
| 2-Bedroom + Study | BPS1 / BPS1 (p) / BPS2 | 134 | 764 sq ft | |
| 3-Bedroom | C1/ C2/ C3/ C4/ C5 | 135 | 926 / 936 / 947 sq ft | 34.20% |
| 3-Bedroom Premium | CP1 / CP1 (p) / | 158 | 1,055 / 1,066 / 1,076 sq ft | |
| 3-Bedroom Premium + Study | CPS1/ CPS1(p) / CPS2 / CPS2 (p) / CPS3 / CPS3 (p) / CPS4 / CPS5 | 115 | 1,163 / 1,173 / 1,184 sq ft | |
| 4-Bedroom | D1 / D1(p) / D2 / D2(p) / D3 / D3(p) / D4 / D4(p) | 57 | 1,335 / 1,345 / 1,356 sq ft | 8.70% |
| 4-Bedroom Premium | DP1 / DP1 (p) / DP2 / D2P (p) | 47 | 1,485 / 1,496 sq ft | |
| 5-Bedroom | E1 / E1 (p) | 22 | 1,679 sq ft | 1.80% |
From the table, it’s clear that nearly one-third of the units at Parktown Residence are 3-bedroom units, with 44% being 3-bedroom and larger. A significant portion, 49.1%, is made up of 2-bedroom units.
This might seem unusual, as areas like Tampines typically attract HDB upgraders, and 2-bedroom units are not usually the preferred choice for families, of course, except in cases where buyers do not have children.
To assess whether this unit mix is appropriate, we can look at recently completed developments such as Treasure at Tampines, as well as other integrated projects in HDB estates, including Pasir Ris 8, Sengkang Grand Residences, and North Park Residences. These developments could provide some insight into how well a similar mix of unit types has been received in comparable markets.
Treasure at Tampines unit mix
| Unit Type | Size of Units (sqft) | No. Of Units | Proportion |
| 1-Bedroom | 463 – 484 sqft | 231 | 10.5% |
| 2-Bedroom | 581 – 614 sqft | 265 | 12.0% |
| 2-Bedroom Premium | 657 – 678 sqft | 160 | 7.3% |
| 2-Bedroom + Study | 678 sqft | 313 | 14.2% |
| 3-Bedroom | 818 – 947 sqft | 417 | 18.9% |
| 3-Bedroom Premium | 1,012 – 1,087 sqft | 344 | 15.6% |
| 4-Bedroom | 1,238 – 1,270 sqft | 176 | 8.0% |
| 4-Bedroom Premium | 1,281 – 1,367 sqft | 187 | 8.5% |
| 5-Bedroom Premium | 1,668 – 1,722 sqft | 110 | 5.0% |
At Treasure at Tampines, 2-bedroom units make up 33.5% of the entire development. While this is less than half, it still represents a significant number - over 700 units. This indicates that there is demand for 2-bedroom units in a development of this size, which could offer some context when evaluating the unit mix at Parktown Residence.
Let’s take a look at how prices have moved across different bedroom types. This will provide a clearer understanding of price trends for various unit sizes and how they compare within the market.
| Year | 1BR | 2BR | 3BR | 4BR | 5BR |
| 2019 | $1,387 | $1,374 | $1,291 | $1,293 | $1,180 |
| 2020 | $1,519 | $1,418 | $1,334 | $1,321 | $1,210 |
| 2021 | $1,648 | $1,505 | $1,412 | $1,383 | $1,259 |
| 2022 | $1,547 | $1,592 | $1,575 | $1,493 | $1,403 |
| 2023 | $1,670 | $1,657 | $1,623 | $1,702 | $1,534 |
| 2024 | $1,700 | $1,689 | $1,705 | $1,712 | $1,644 |
| Overall Performance | 22.6% | 22.9% | 32.1% | 32.4% | 39.3% |
The average $PSF at Treasure at Tampines stands at $1,698. The 2-bedroom units have performed well, largely driven by overall market sentiments. However, this also suggests there is a solid demand for this bedroom type, indicating that 2-bedroom units can still attract buyers even in larger developments in OCR areas.
2 Bedroom purchases from HDB Upgraders
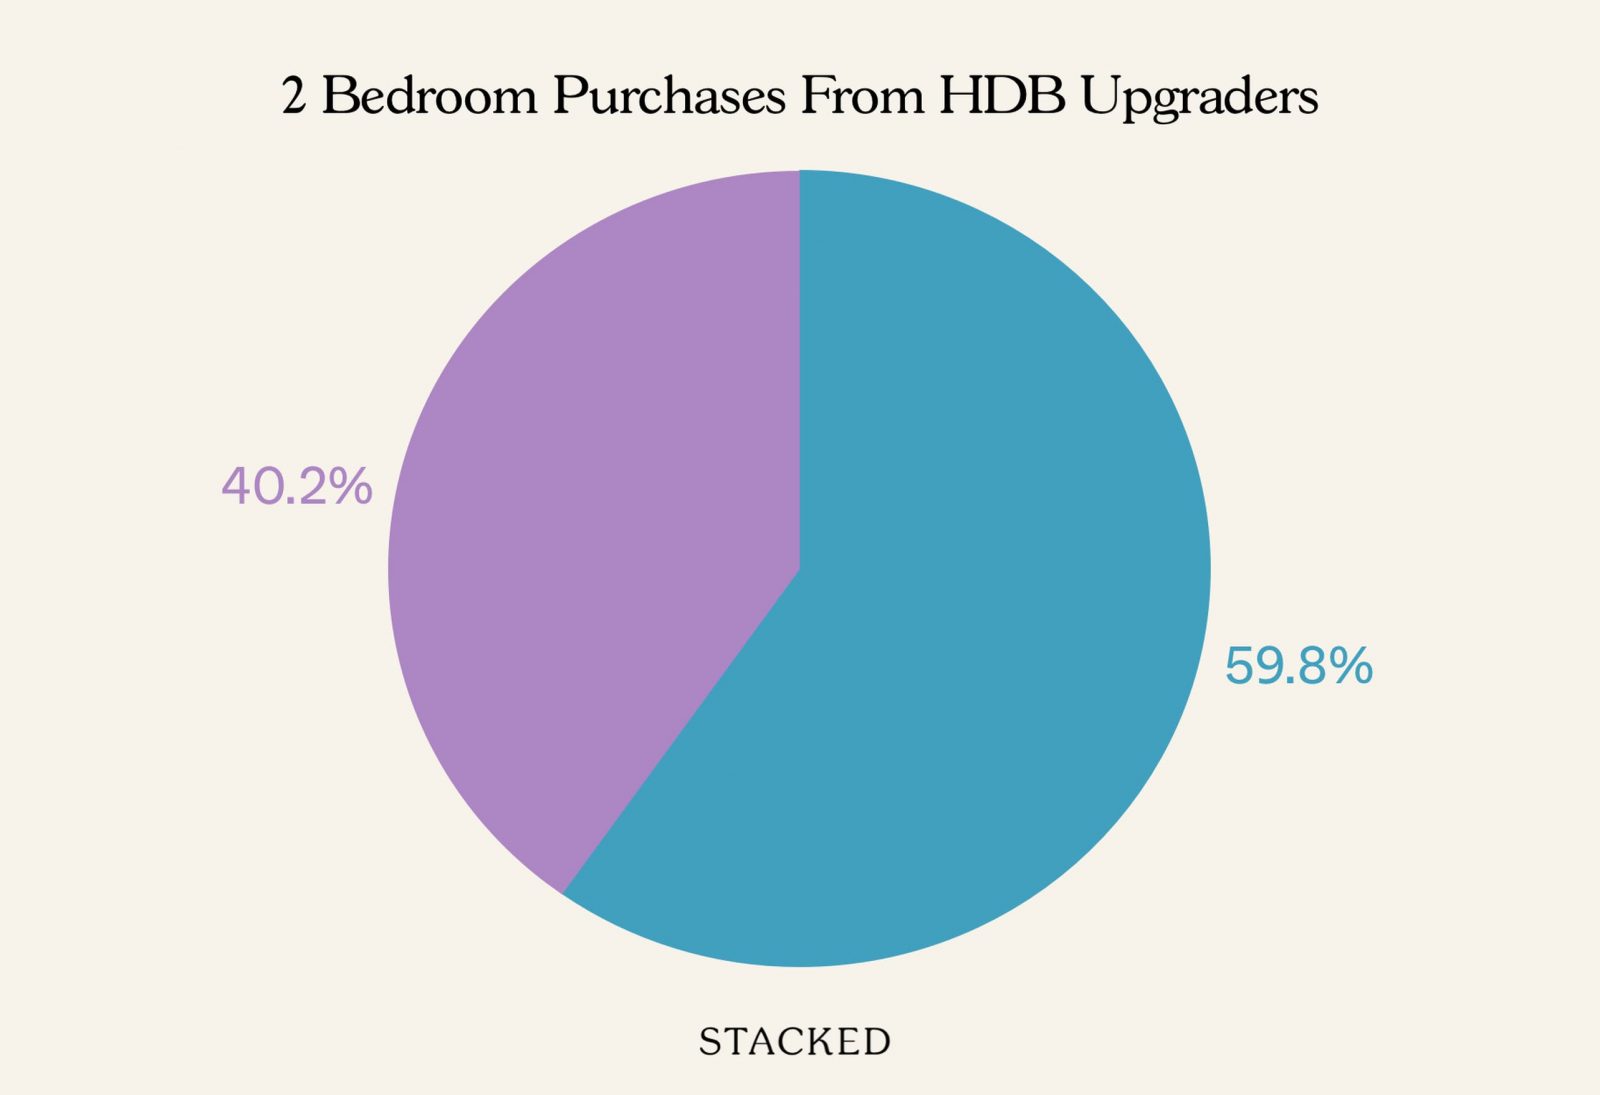
Approximately 64% of buyers of the 2-bedroom units at Treasure at Tampines had an HDB address, suggesting that a large majority of these buyers are HDB upgraders.
3 Bedroom purchases from HDB Upgraders
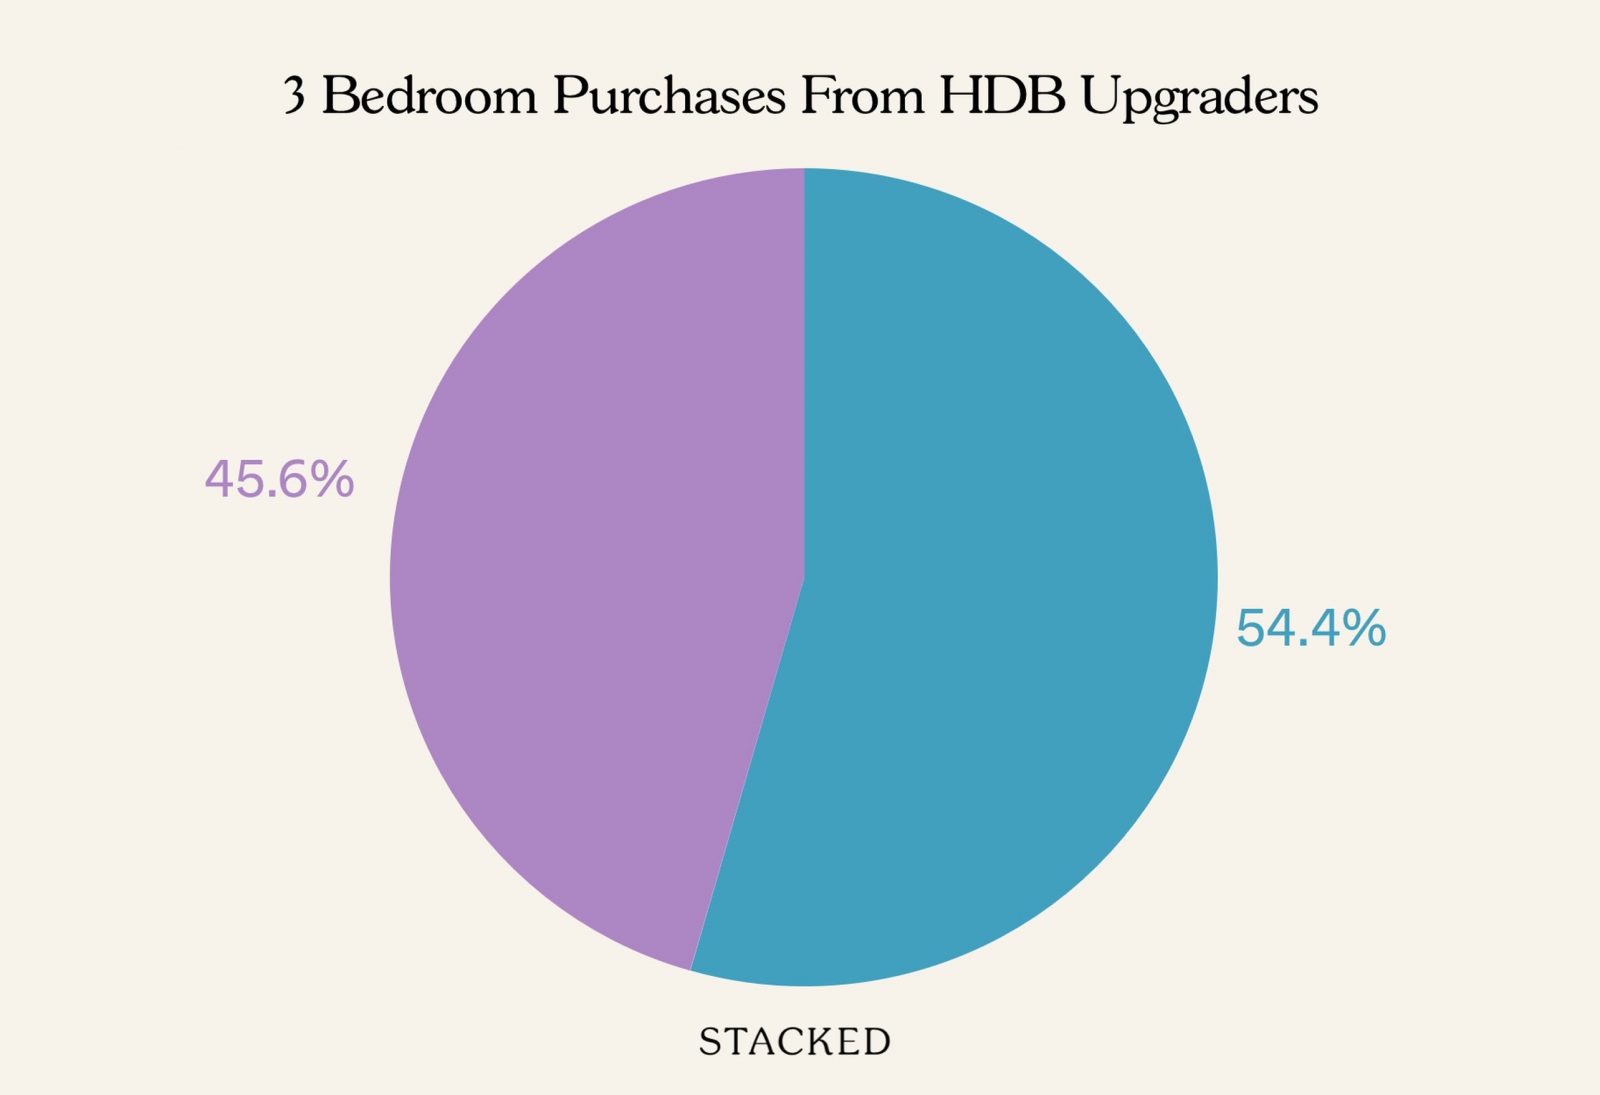
A slightly lower proportion of buyers with HDB addresses purchased a 3-bedroom unit at Treasure at Tampines. This might not be entirely surprising, as 2-bedroom units are more affordable than 3-bedroom units, making them a more accessible option, especially for those with one child or no children coming from a 3-room flat.
What this indicates is that there is demand for 2-bedroom units in Tampines. Additionally, the integrated nature of developments like these makes them more attractive to investors, as the convenience of amenities and transport links can simplify the renting process. This could explain why a higher proportion of buyers chose the 2-bedroom units.
What about other integrated developments?
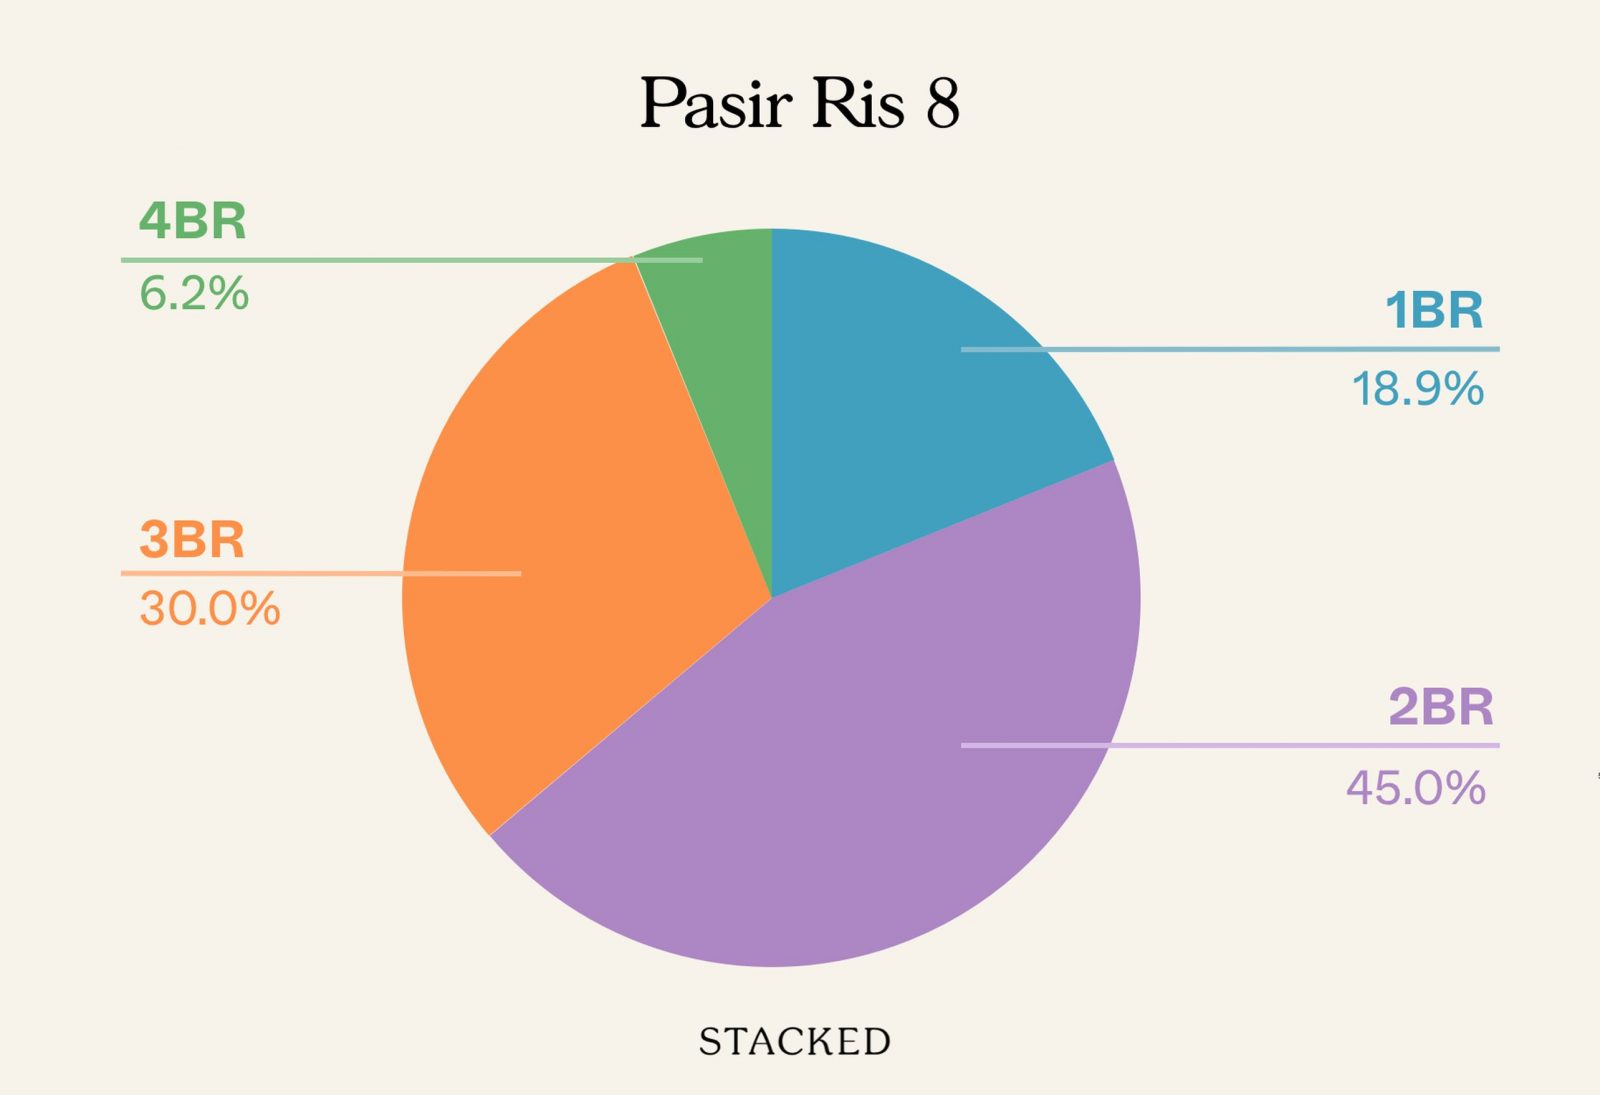
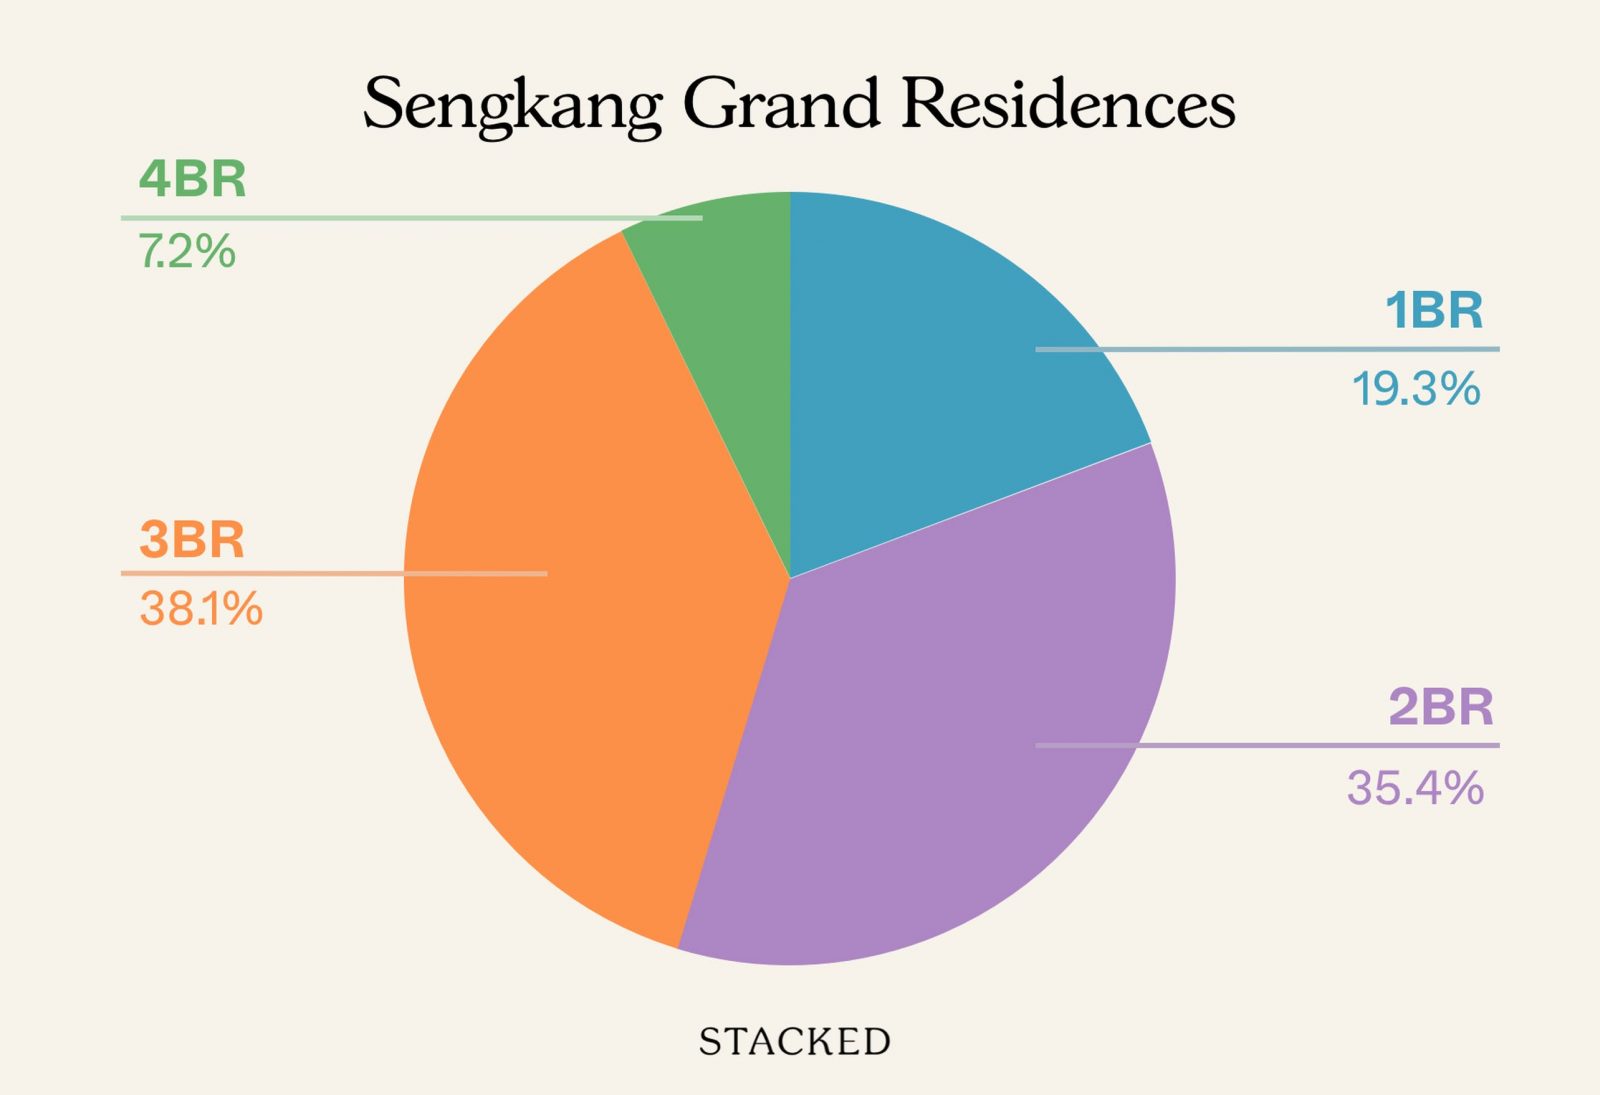
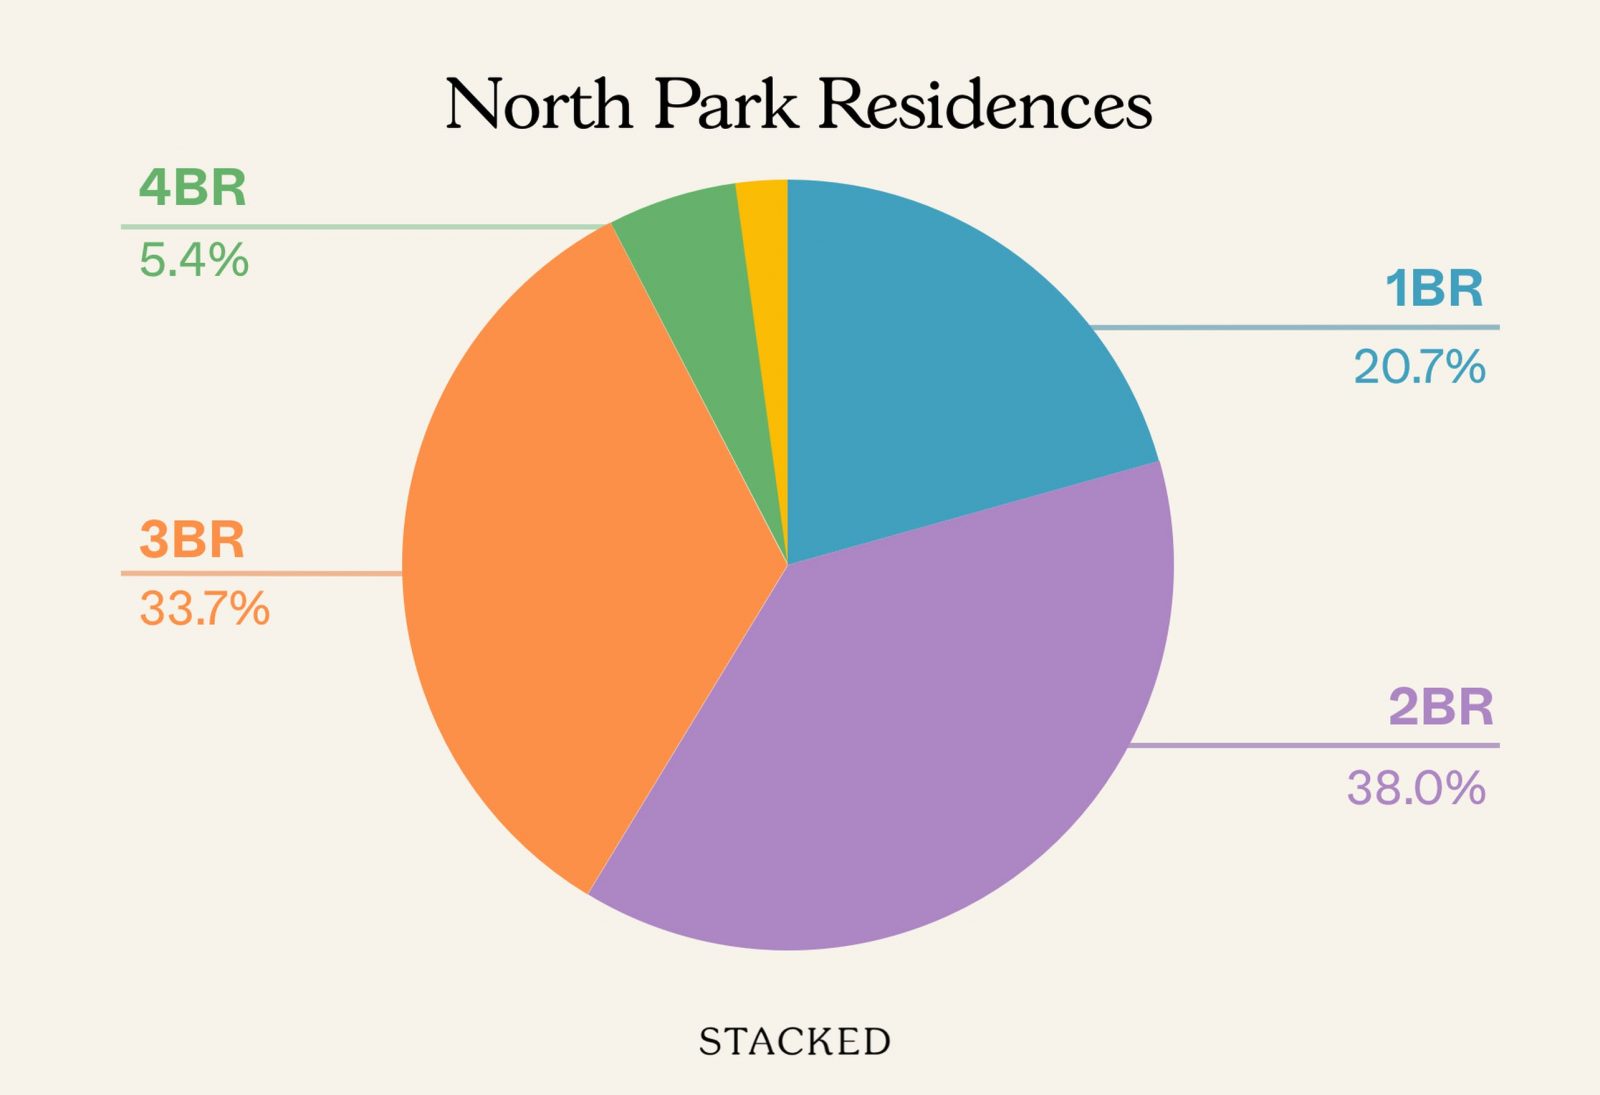
You can see that the majority of units at Pasir Ris 8 were 2-bedroom units, and the development successfully sold 85% of its units over the launch weekend. At Sengkang Grand Residences, 2-bedroom units make up 35% of the total units, which is almost on par with the 3-bedroom units at 38%. Similarly, at North Park Residences, 2-bedroom units also make up the majority, though the gap between them and the 3-bedroom units is narrower.
The popularity of 2-bedroom units at Treasure at Tampines and other integrated developments is noteworthy. The integrated nature of these developments also tends to attract investors, further reinforcing the credibility of the unit mix. This could be relevant when considering Parktown Residence, as it suggests that such a balance mix of unit types can work in such developments.
Now, let’s turn our attention to the supply of existing condos in the Tampines estate. There are a couple of key questions we need to explore. First, are there any shortages of specific unit types? For instance, is there a lack of smaller units that might appeal to some HDB upgraders in the area? Secondly, what are the price trends in the resale market?
Supply of condos in the area
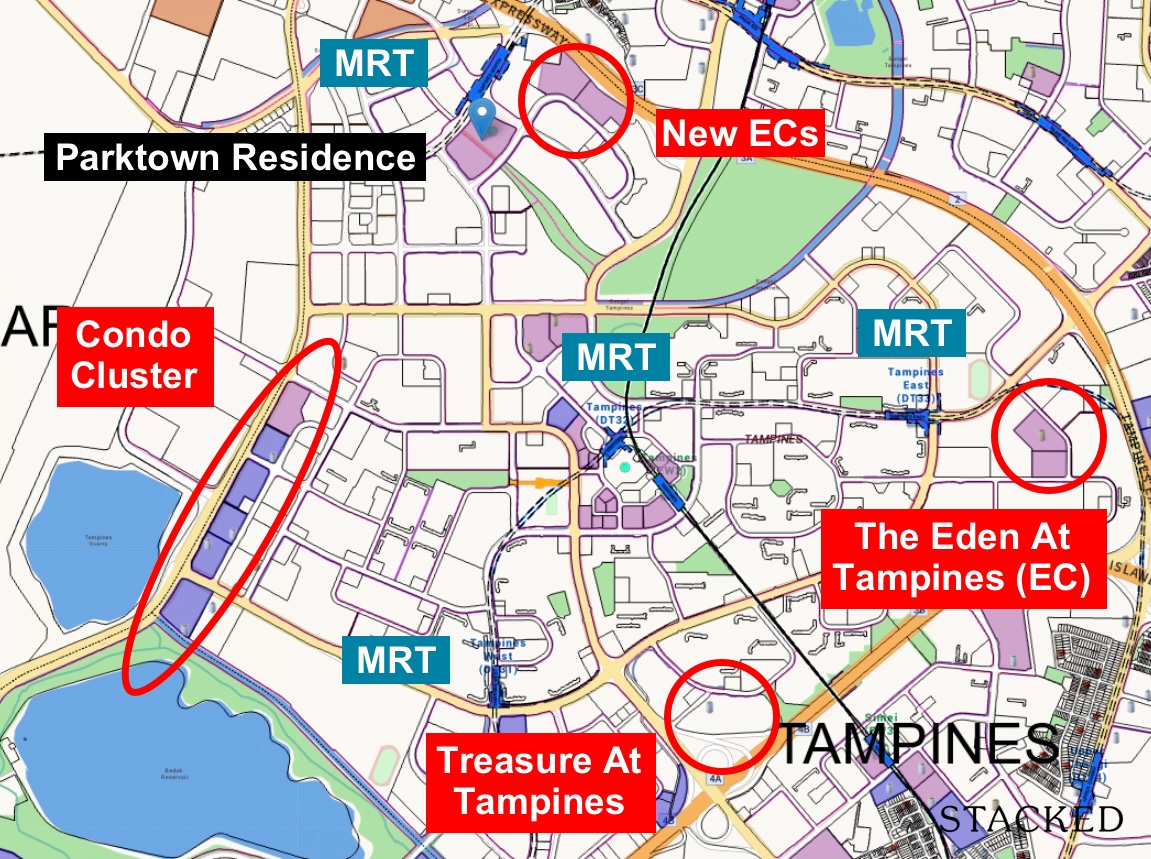
| Project Name | Tenure | Type | Completion Year | 1 | 2 | 3 | 4 | 5 | Total Units |
| ARC AT TAMPINES | 99 yrs from 22/02/2011 | Executive Condominium | 2014 | 94 | 368 | 112 | 574 | ||
| CITYLIFE@TAMPINES | 99 yrs from 13/08/2012 | Executive Condominium | 2016 | 24 | 315 | 166 | 9 | 514 | |
| PARC CENTRAL RESIDENCES | 99 yrs from 22/04/2019 | Executive Condominium | 2024 | 546 | 122 | 32 | 700 | ||
| PINEVALE | 99 yrs from 31/01/1997 | Executive Condominium | 1999 | 318 | 4 | 322 | |||
| Q BAY RESIDENCES | 99 yrs from 21/08/2012 | Condominium | 2016 | 125 | 187 | 243 | 60 | 15 | 630 |
| THE ALPS RESIDENCES | 99 yrs from 03/08/2015 | Condominium | 2019 | 182 | 238 | 178 | 26 | 2 | 626 |
| THE EDEN AT TAMPINES* | 99 yrs from 12/09/2000 | Executive Condominium | 2003 | 27 | 277 | 104 | 430 | ||
| THE SANTORINI | 99 yrs from 16/10/2013 | Condominium | 2017 | 165 | 172 | 211 | 34 | 15 | 597 |
| THE TAMPINES TRILLIANT | 99 yrs from 13/07/2011 | Executive Condominium | 2015 | 524 | 146 | 670 | |||
| THE TAPESTRY | 99 yrs from 31/07/2017 | Condominium | 2021 | 269 | 294 | 238 | 45 | 15 | 861 |
| THE TROPICA | 99 yrs from 04/12/1996 | Condominium | 2000 | 60 | 343 | 134 | 537 | ||
| TREASURE AT TAMPINES | 99 yrs from 29/11/2018 | Condominium | 2023 | 231 | 738 | 761 | 363 | 110 | 2203 |
| WATERVIEW | 99 yrs from 16/06/2010 | Condominium | 2014 | 308 | 308 | 56 | 24 | 696 | |
| Total | 972 | 2142 | 4630 | 1372 | 222 | 9360 | |||
| Proportion | 10.4% | 22.9% | 49.5% | 14.7% | 2.4% |
Note that the supply here is based on information we could find and may not be fully accurate, but serves as a good enough estimate.
Overall, 3-bedroom units make up 50% of the supply in the estate. Two-thirds of the units in the area are 3 bedrooms and above, which can be attributed to the fact that around half of the projects here are Executive Condominiums.
This may help explain why both Treasure at Tampines and Parktown Residence have chosen to offer a larger proportion of 2-bedroom units. Given the success of Treasure at Tampines, where 2-bedroom units performed well, offering more 2-bedroom units could also prove to be more profitable for the developers of Parktown Residence.
Before we compare resale prices of condos around the Tampines estate, it’s important to make some adjustments to ensure a more accurate comparison. This is due to the harmonisation framework, which results in prices on a per square foot basis appearing higher, as they do not account for unlivable space like the AC ledge. To address this, we’ve discounted the existing $PSF by 6% and also added an additional $100 PSF, given that we’re working with the starting $PSF.
| Type | Size | Price | $PSF | Less 6% (Adjust to Pre-Harmonisation) | Plus $100 $PSF |
| 1+Study | 463 | $1,070,000 | $2,311 | $2,172 | $2,272 |
| 2 Bedroom | 592 | $1,330,000 | $2,247 | $2,112 | $2,212 |
| 3 Bedroom | 926 | $2,070,000 | $2,235 | $2,101 | $2,201 |
| 4 Bedroom | 1335 | $2,850,000 | $2,135 | $2,007 | $2,107 |
| 5 Bedroom | 1679 | $3,780,000 | $2,251 | $2,116 | $2,216 |
From here, we can assume an average of around $2,200 psf (pre-harmonisation).
| Project | Completed | 1BR | 2BR | 3BR | 4BR | 5BR |
| ARC AT TAMPINES | 2014 | $1,363 | $1,338 | $1,317 | ||
| CITYLIFE@TAMPINES | 2016 | $1,616 | $1,452 | $1,414 | ||
| PARC CENTRAL RESIDENCES | 2024 | $1,575 | ||||
| PINEVALE | 1999 | $1,001 | $925 | |||
| Q BAY RESIDENCES | 2016 | $1,417 | $1,418 | $1,445 | $1,401 | $1,490 |
| THE ALPS RESIDENCES | 2019 | $1,572 | $1,463 | $1,467 | ||
| THE EDEN AT TAMPINES | 2003 | $1,195 | $1,134 | $1,158 | ||
| THE SANTORINI | 2017 | $1,422 | $1,395 | $1,396 | $1,367 | |
| THE TAMPINES TRILLIANT | 2015 | $1,517 | $1,578 | |||
| THE TAPESTRY | 2021 | $1,721 | $1,664 | $1,650 | $1,694 | $1,661 |
| THE TROPICA | 2000 | $1,076 | $1,277 | $1,338 | ||
| TREASURE AT TAMPINES | 2023 | $1,705 | $1,689 | $1,703 | $1,713 | $1,624 |
| WATERVIEW | 2014 | $1,369 | $1,463 | $1,506 | ||
| PARKTOWN RESIDENCE* | Est 2030 | $2,272 | $2,212 | $2,201 | $2,107 | $2,216 |
| Project | Completed | 1BR | 2BR | 3BR | 4BR | 5BR |
| ARC AT TAMPINES | 2014 | $1,095,667 | $1,426,098 | $1,963,176 | ||
| CITYLIFE@TAMPINES | 2016 | $1,270,000 | $1,703,818 | $1,986,326 | ||
| PARC CENTRAL RESIDENCES | 2024 | $1,690,000 | ||||
| PINEVALE | 1999 | $1,338,500 | $2,300,000 | |||
| Q BAY RESIDENCES | 2016 | $782,389 | $1,158,906 | $1,600,800 | $2,018,127 | $2,550,800 |
| THE ALPS RESIDENCES | 2019 | $742,815 | $1,019,500 | $1,478,444 | ||
| THE EDEN AT TAMPINES | 2003 | $1,028,800 | $1,430,321 | $1,644,000 | ||
| THE SANTORINI | 2017 | $732,545 | $1,126,875 | $1,548,736 | $1,820,000 | |
| THE TAMPINES TRILLIANT | 2015 | $1,565,352 | $2,056,000 | |||
| THE TAPESTRY | 2021 | $782,329 | $1,055,824 | $1,705,513 | $2,493,472 | $2,932,500 |
| THE TROPICA | 2000 | $1,065,000 | $1,555,750 | $2,031,000 | ||
| TREASURE AT TAMPINES | 2023 | $798,181 | $1,092,078 | $1,626,930 | $2,195,441 | $2,785,000 |
| WATERVIEW | 2014 | $1,188,455 | $1,682,583 | $1,954,722 | ||
| PARKTOWN RESIDENCE** | Est 2030 | $1,064,900 | $1,361,600 | $2,129,800 | $3,070,500 | $3,861,700 |
**Here, we’ve assumed an average of $2,300 PSF as we multiplied it by the size that excludes the AC ledge. Therefore, we cannot apply our pre-harmonisation assumption in this case.
From the prices in the area, Parktown Residence will not only set a $PSF precedent but also influence overall pricing trends. Currently, 1-bedroom units in Tampines are priced below $1 million. For example, an 8th-floor, 463 sq ft 1-bedroom at Treasure at Tampines recently sold for just $790k. This pattern extends across other unit types as well. While it’s not unusual in the new launch market to see 3-bedroom units priced above $2 million, it’s important to recognise that HDB upgraders in the vicinity have alternative options.
These alternatives may not offer the same level of convenience as Parktown Residence, but the key question remains: are upgraders willing to pay the premium for this added convenience?
To better understand the potential market response, let's take a look at three other HDB estates that have seen integrated developments in recent years and analyse how they’ve performed.
Next, we’ll examine the pricing of more recent Integrated Developments in 2024.
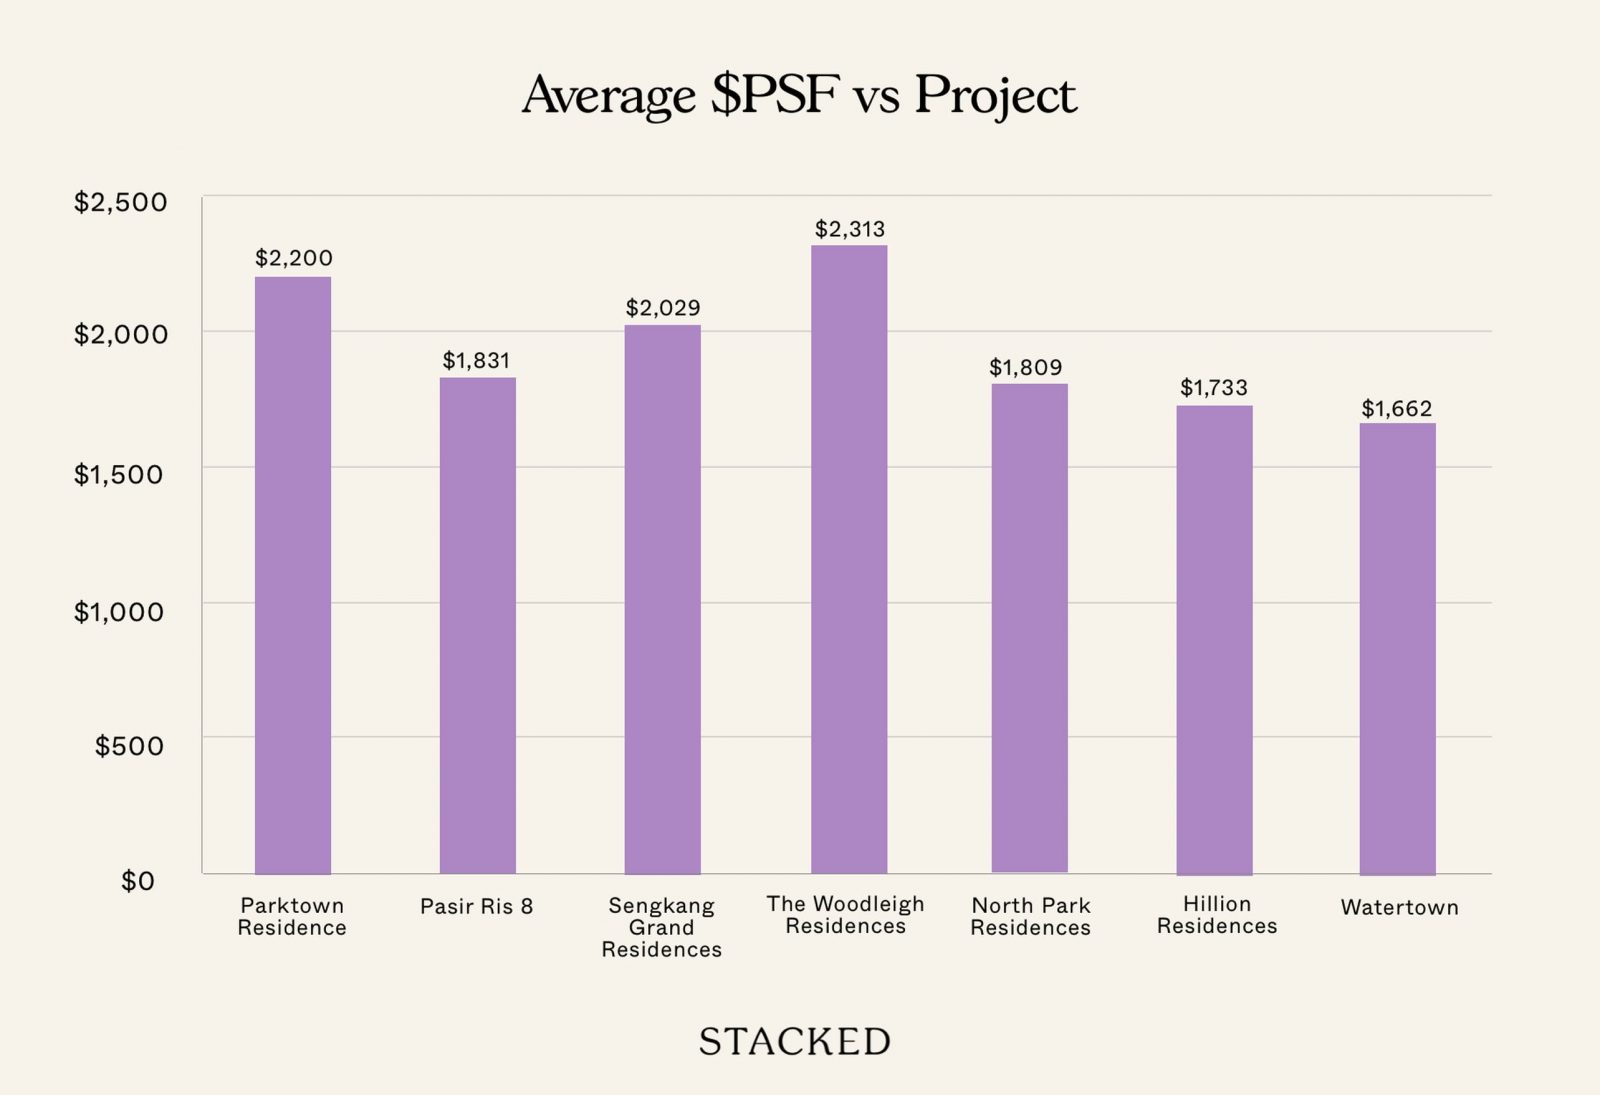
*Estimated $PSF only (pre-harmonisation)
At an estimated average of $2,200 PSF (pre-harmonisation), Parktown Residence would be approximately 20% more expensive than the Integrated Development in the adjacent estate, which isn’t significantly older either. Some buyers may view this as too steep a premium, while others who are set on staying in Tampines might consider it acceptable. Ultimately, it boils down to personal preference.
To assess if such a premium can be justified, we could examine the growth over the past year to gauge how these newer Integrated Developments have performed over time. A significant price growth could indicate that the development was initially priced below market value and could have continued momentum. On the other hand, if performance was average or lacklustre, it would be harder to justify why prices should accelerate unless driven by other external factors.
Before diving into that analysis, let’s first take a look at how the broader non-landed market has moved since 2019:
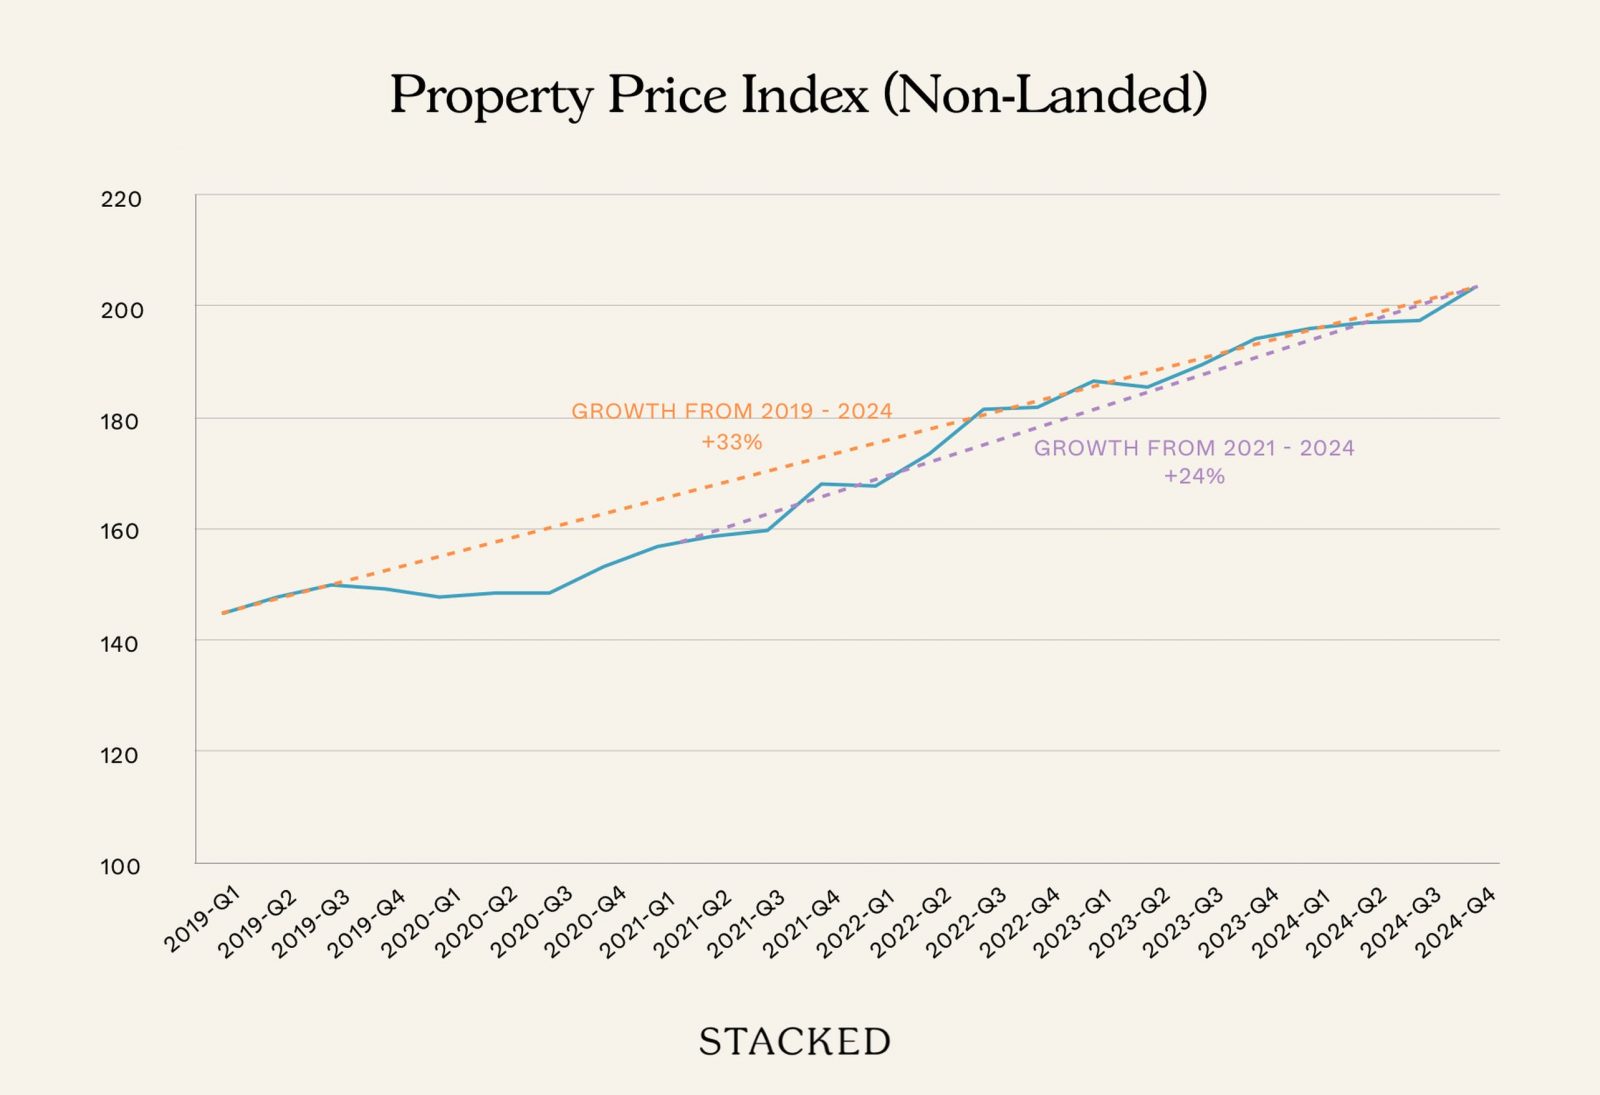
Between 2019 and 2024, non-landed property prices increased by 33%. From 2021 to 2024, the rise was 24%. This Property Price Index (PPI) gives a snapshot of the broader market's movement, indicating how much property prices have changed within the non-landed sector.
While this isn't a direct measure of an integrated development’s performance, potential buyers looking to purchase in the broader market should be mindful of these trends, as they could offer context when considering individual projects.
Here's how Pasir Ris 8 has performed to date
| Year | 1BR | 2BR | 3BR | 4BR |
| 2021 | $1,712 | $1,641 | $1,503 | $1,597 |
| 2022 | $2,061 | $1,754 | $1,727 | |
| 2023 | $2,077 | $1,794 | $1,763 | |
| 2024 | $1,893 | $1,974 | $1,800 | $1,754 |
| Change | 10.6% | 20.3% | 19.8% | 9.8% |
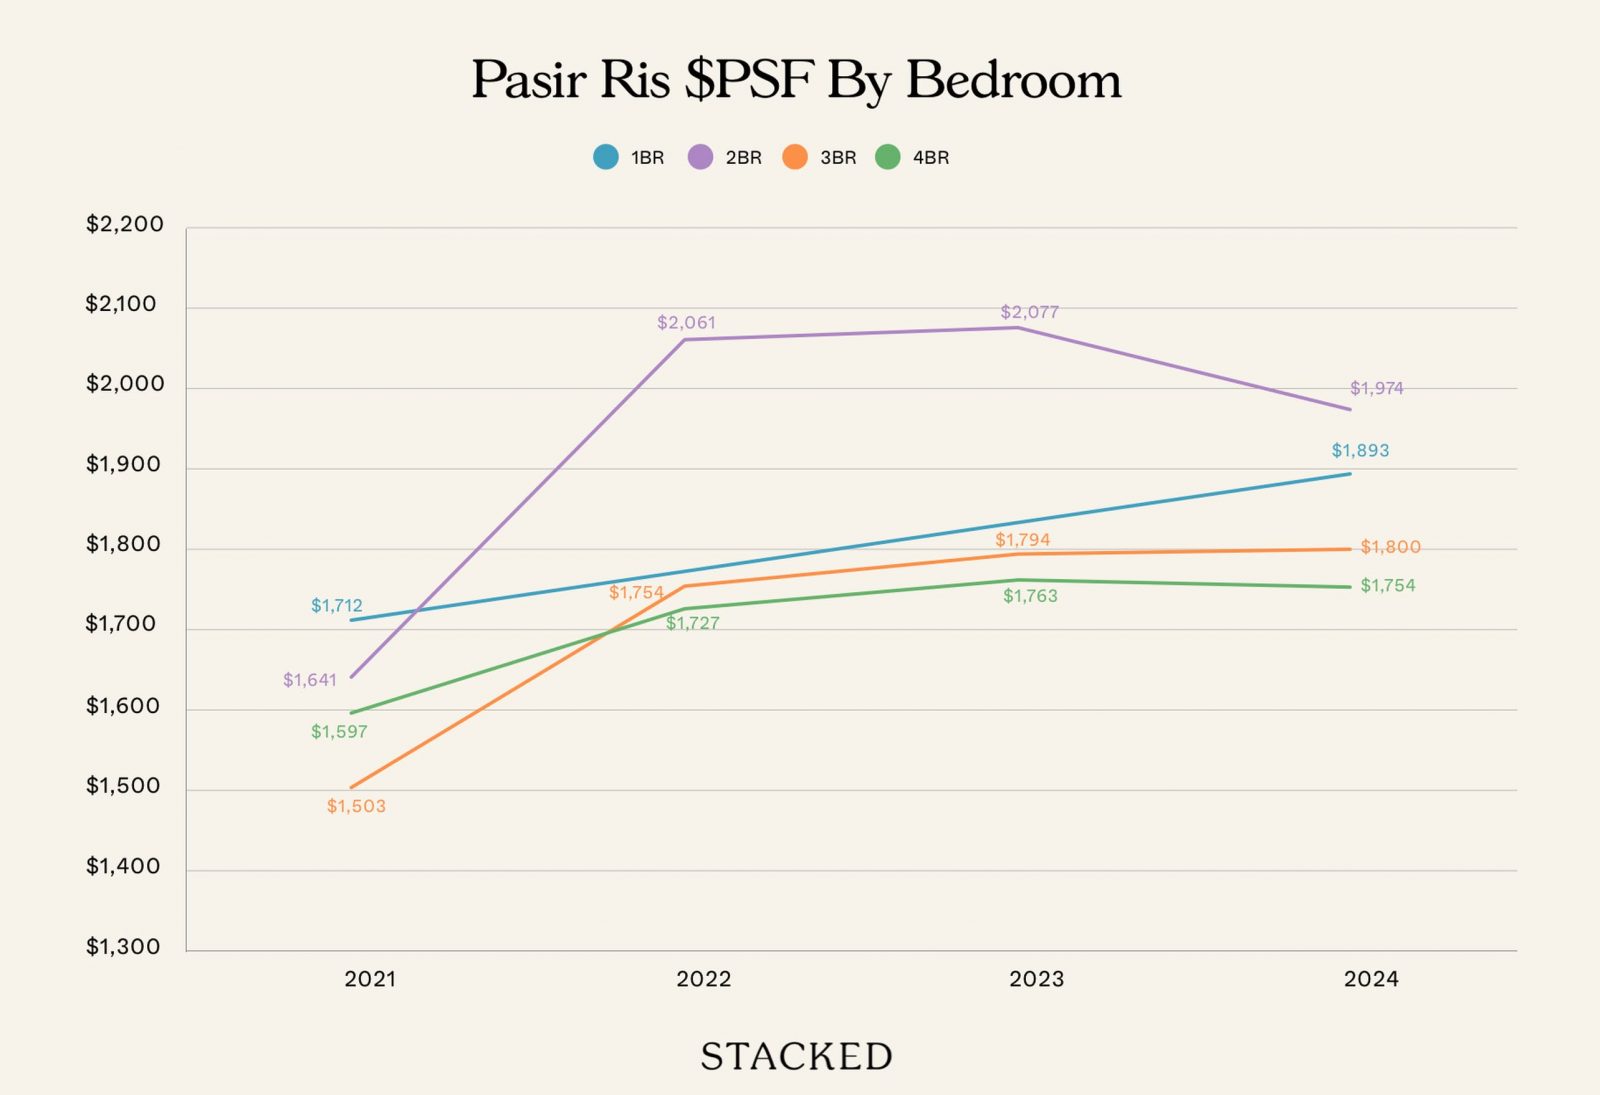
An important point to note is that Pasir Ris 8 only started selling in 2021. To date, there are just 2 sub sale transactions which both took place in 2024:
| Soldon | Address | Unit area(sqft) | Sale price(S$ psf) | Boughton | Purchase price(S$ psf) | Profit(S$) | Holding period(days) | Annualised(%) |
| 20 Nov 2024 | 12 Pasir Ris Drive 8 #06-27 | 775 | 1,974 | 24 Jul 2021 | 1,584 | 302,000 | 1,215 | 6.8 |
| 11 Oct 2024 | 10 Pasir Ris Drive 8 #06-12 | 517 | 1,893 | 24 Jul 2021 | 1,697 | 101,000 | 1,175 | 3.4 |
The first transaction saw an 11.5% gain over three years, falling below the market average of 24%. In contrast, the second transaction recorded a 25% gain, aligning with the market average.
While two transactions provide limited insight, it is notable that the 775 sq ft, 2-bedroom unit has appreciated in line with market expectations. In any case, it’s still too early to tell about Pasir Ris 8’s overall performance - so we will save our conclusion for later.
Here's how Sengkang Grand Residences performed to date
| Year | 1BR | 2BR | 3BR | 4BR |
| 2019 | $1,774 | $1,740 | $1,695 | $1,690 |
| 2020 | $1,788 | $1,717 | $1,679 | $1,676 |
| 2021 | $1,786 | $1,722 | $1,719 | $1,701 |
| 2022 | $1,841 | $1,808 | $1,840 | |
| 2023 | $1,987 | $2,032 | $1,946 | $1,927 |
| 2024 | $2,012 | $2,025 | $2,030 | $2,109 |
| Change | 13.4% | 16.4% | 19.8% | 24.8% |
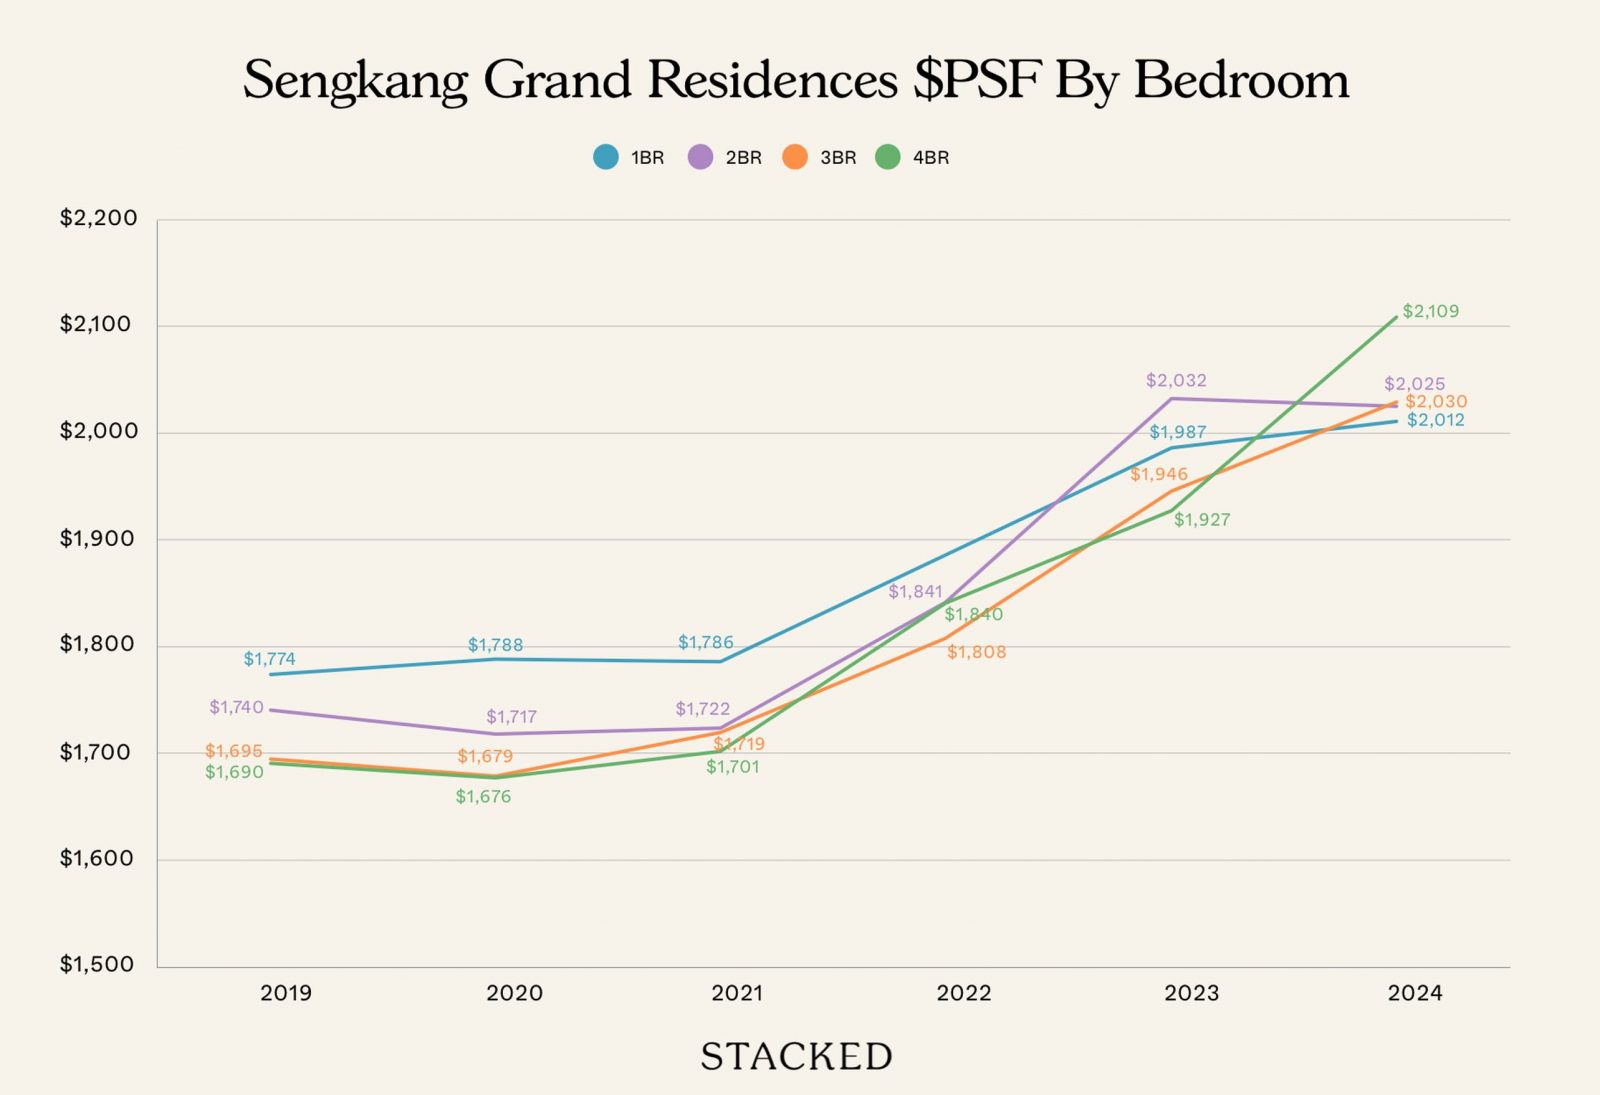
Overall, the performance is more in line with what we observed — larger bedroom types have made more in terms of returns. Considering the market movements, however, the performance of Sengkang Grand Residences is not particularly impressive. This longer span of time should typically offer more meaningful returns, but in this case, it hasn’t been the case.
Considering the overall market has averaged a 33% growth from 2019 to 2024, it's difficult to envision prices reaching the $2,200 psf mark anytime soon if Sengkang Grand Residences has struggled to meet the market average growth rate. While Parktown Residence would be a newer development, it's also located in a relatively new part of Tampines, unlike Sengkang Grand Residences or Pasir Ris 8, both of which are situated in the more established parts of their respective estates.
If Sengkang Grand Residences and Pasir Ris 8's performance has been relatively subdued, with both developments still about 10% or more away from $2,200 psf, it suggests that buyers entering at that price point (pre-harmonisation) might need more time for their investment to realise meaningful returns.
Another factor to consider is the price premium that Integrated Developments command over comparable resale condos in the area. By examining this premium, we can gain insight into how Parktown Residence might perform in relation to its competitors.
However, making a direct comparison for Parktown Residence is challenging. This is because it is located in the relatively new Tampines North area. The nearest condo in the vicinity is Tenet, but it's an Executive Condominium (EC), which belongs to a different property class and thus isn't directly comparable. Additionally, the nearby resale condos are generally older or are also ECs, further complicating the comparison.
The most recent condominium in the estate is Treasure at Tampines, but it's worth noting that this development is located on the south side of Tampines, away from the MRT. This could make it less relevant in terms of convenience compared to Parktown Residence. Still, for the sake of comparison, we can use Treasure at Tampines as a reference point, while being mindful of the significant difference in terms of accessibility and convenience.
How Parktown Residence compares to Treasure at Tampines
| Year | Treasure At Tampines $PSF |
| 2019 | 1,339 |
| 2020 | 1,369 |
| 2021 | 1,410 |
| 2022 | 1,540 |
| 2023 | 1,646 |
| 2024 | 1,698 |
| 2025 | 1,737 |
Above shows the average $PSF at Treasure at Tampines.
In 2025, 8 transactions have been recorded for Treasure at Tampines so far, averaging $1,737 psf. If we use a $2,200 psf (pre-harmonisation) estimate for Parktown Residence, this would place it at a 26% premium over the current market price at Treasure at Tampines.
At first glance, this might seem like a significant premium. However, it’s important to understand how this compares to other Integrated Developments in the area. By looking at the price premiums for other such developments, we can gauge whether Parktown Residence’s premium is in line with market trends or if it stands out as particularly high.
Pasir Ris 8, which is the closest Integrated Development, saw significant demand when it launched, managing to sell 85% of its units over the launch weekend.
| Project | Completion | 2021 | 2022 | 2023 | 2024 | 2021 Premium (%) | 2021 Premium ($) |
| COCO PALMS | 2018 | $1,251 | $1,359 | $1,497 | $1,634 | 29.5% | $368 |
| D'NEST | 2017 | $1,137 | $1,246 | $1,370 | $1,449 | 42.44% | $482 |
| PASIR RIS 8 | 2026 | $1,619 | $1,824 | $1,829 | $1,831 | ||
| THE PALETTE | 2015 | $1,102 | $1,231 | $1,324 | $1,419 | 46.93% | $517 |
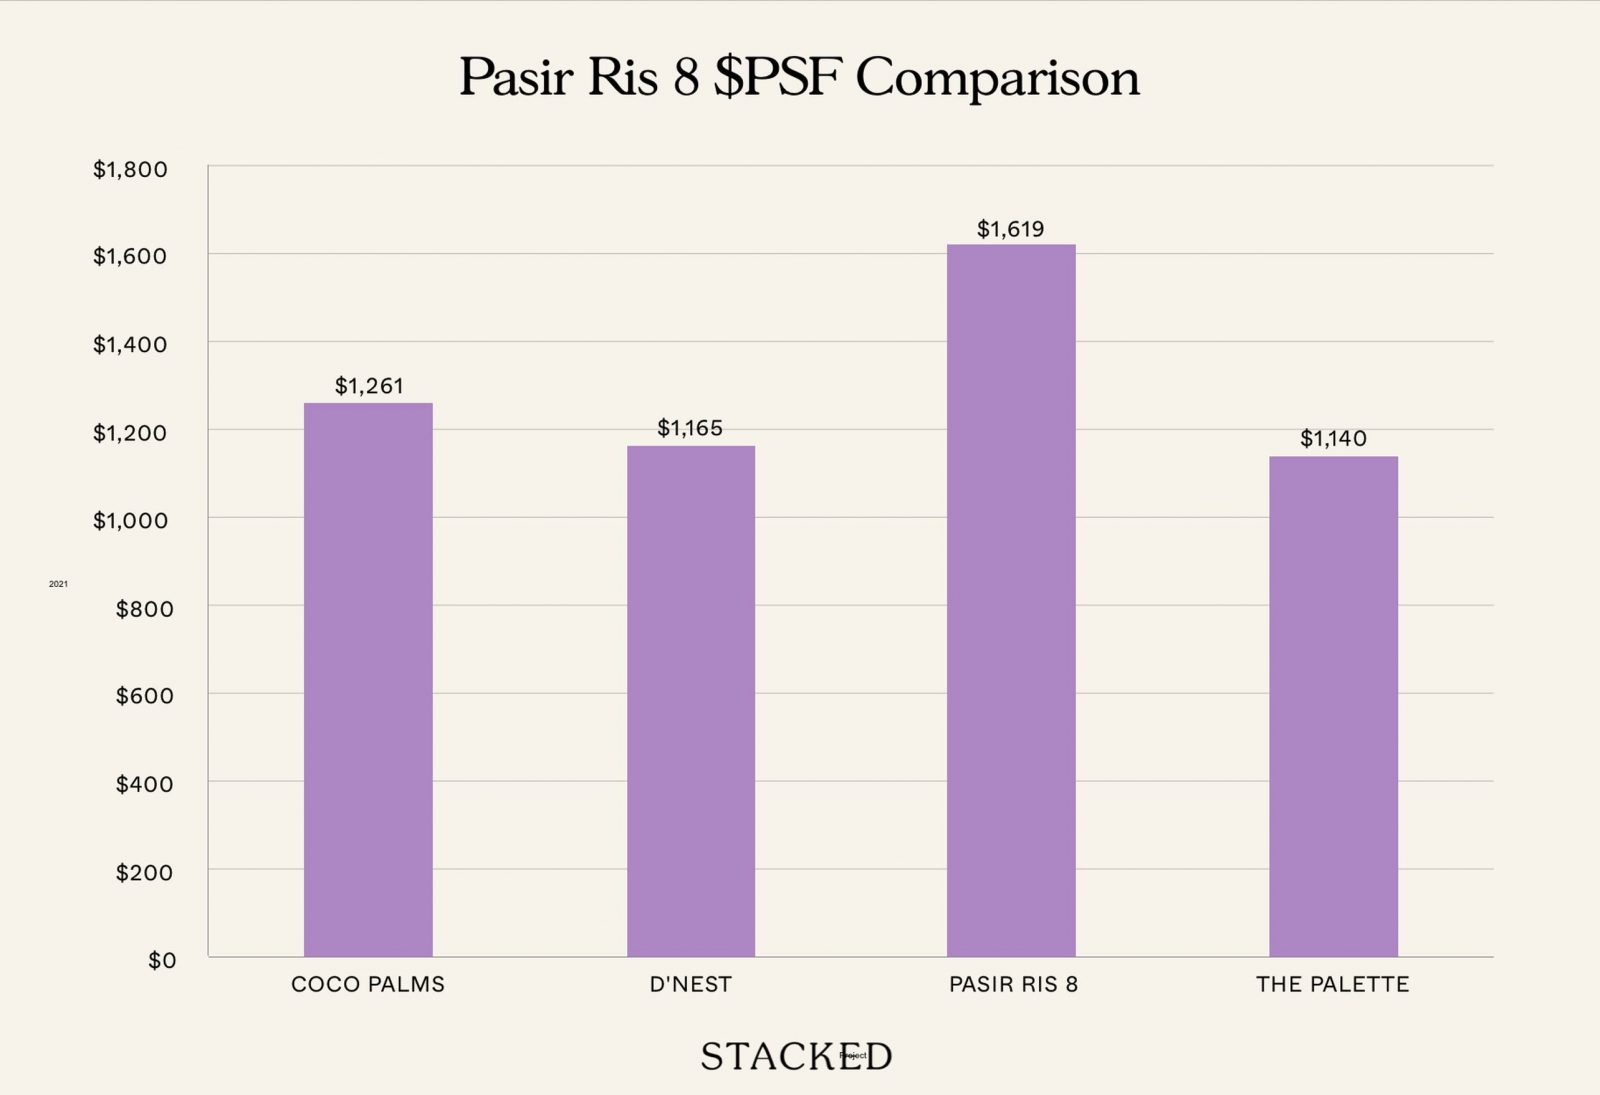
Pasir Ris 8's first sale in 2021 showed a premium of 29.5% over nearby resale condos, which ranged from $1,102 to $1,251 per square foot. Coco Palms, the most expensive and newest resale development at the time, was in close proximity to Pasir Ris 8 and within walking distance of Pasir Ris MRT. Given that Coco Palms was only 8 years older, the premium seems significant.
Comparing this to Parktown Residence’s 26% premium over Treasure at Tampines, the numbers are fairly similar. Though Treasure at Tampines, for example, is not as close to an MRT station, making Parktown Residence's premium look more justified.
Let's look at the case for Sengkang Grand Residences
| Project | Completion | 2019 | 2020 | 2021 | 2022 | 2023 | 2024 | 2019 Premium (%) | 2019 Premium ($) |
| SENGKANG GRAND RESIDENCES | 2023 | $1,747 | $1,732 | $1,719 | $1,812 | $2,001 | $2,031 | ||
| JEWEL @ BUANGKOK | 2016 | $1,302 | $1,314 | $1,347 | $1,447 | $1,625 | $1,667 | 34.18% | $445 |
| ESPARINA RESIDENCES | 2013 | $1,106 | $1,099 | $1,165 | $1,304 | $1,502 | $1,622 | 57.96% | $641 |
| THE QUARTZ | 2009 | $987 | $1,003 | $1,060 | $1,245 | $1,303 | $1,375 | 77.00% | $760 |
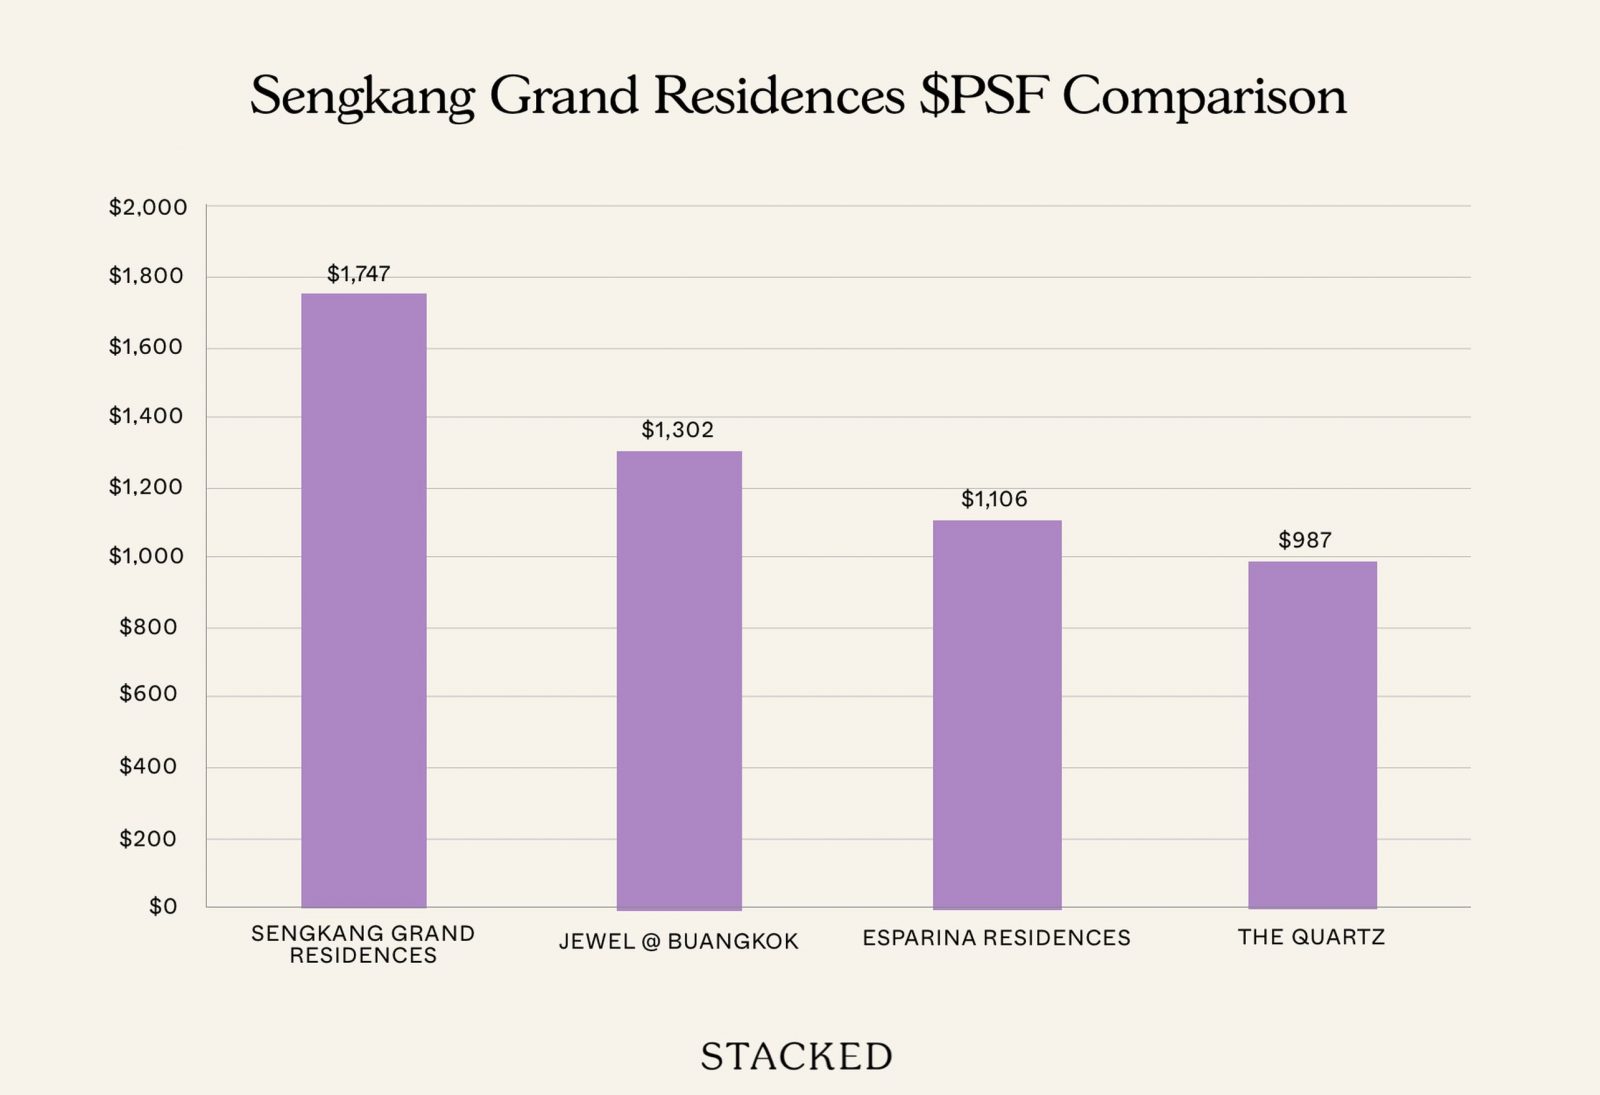
Sengkang Grand Residences made its first sale in 2019. The newest resale condo in the area at the time was Jewel @ Buangkok, which had a 7-year gap with Sengkang Grand Residences. Jewel @ Buangkok carried a 34% premium, or a $445 psf difference, which is higher than the premium gap Parktown Residence is asking for.
Today, Sengkang Grand Residences has only seen profitable transactions. While many owners have made six-digit gains, its return on investment (ROI) is generally in line with or slightly below the overall market growth during the same period, as we’ve discussed earlier.
Finally, let’s look at North Park Residences. The only other comparable development in the area is The Wisteria.
| Year | NORTH PARK RESIDENCES | THE WISTERIA |
| 2015 | $1,359 | |
| 2016 | $1,310 | $1,095 |
| 2017 | $1,319 | $1,056 |
| 2018 | $1,317 | |
| 2019 | $1,572 | $1,222 |
| 2020 | $1,472 | $1,230 |
| 2021 | $1,563 | $1,214 |
| 2022 | $1,654 | $1,252 |
| 2023 | $1,766 | $1,362 |
| 2024 | $1,813 | $1,372 |
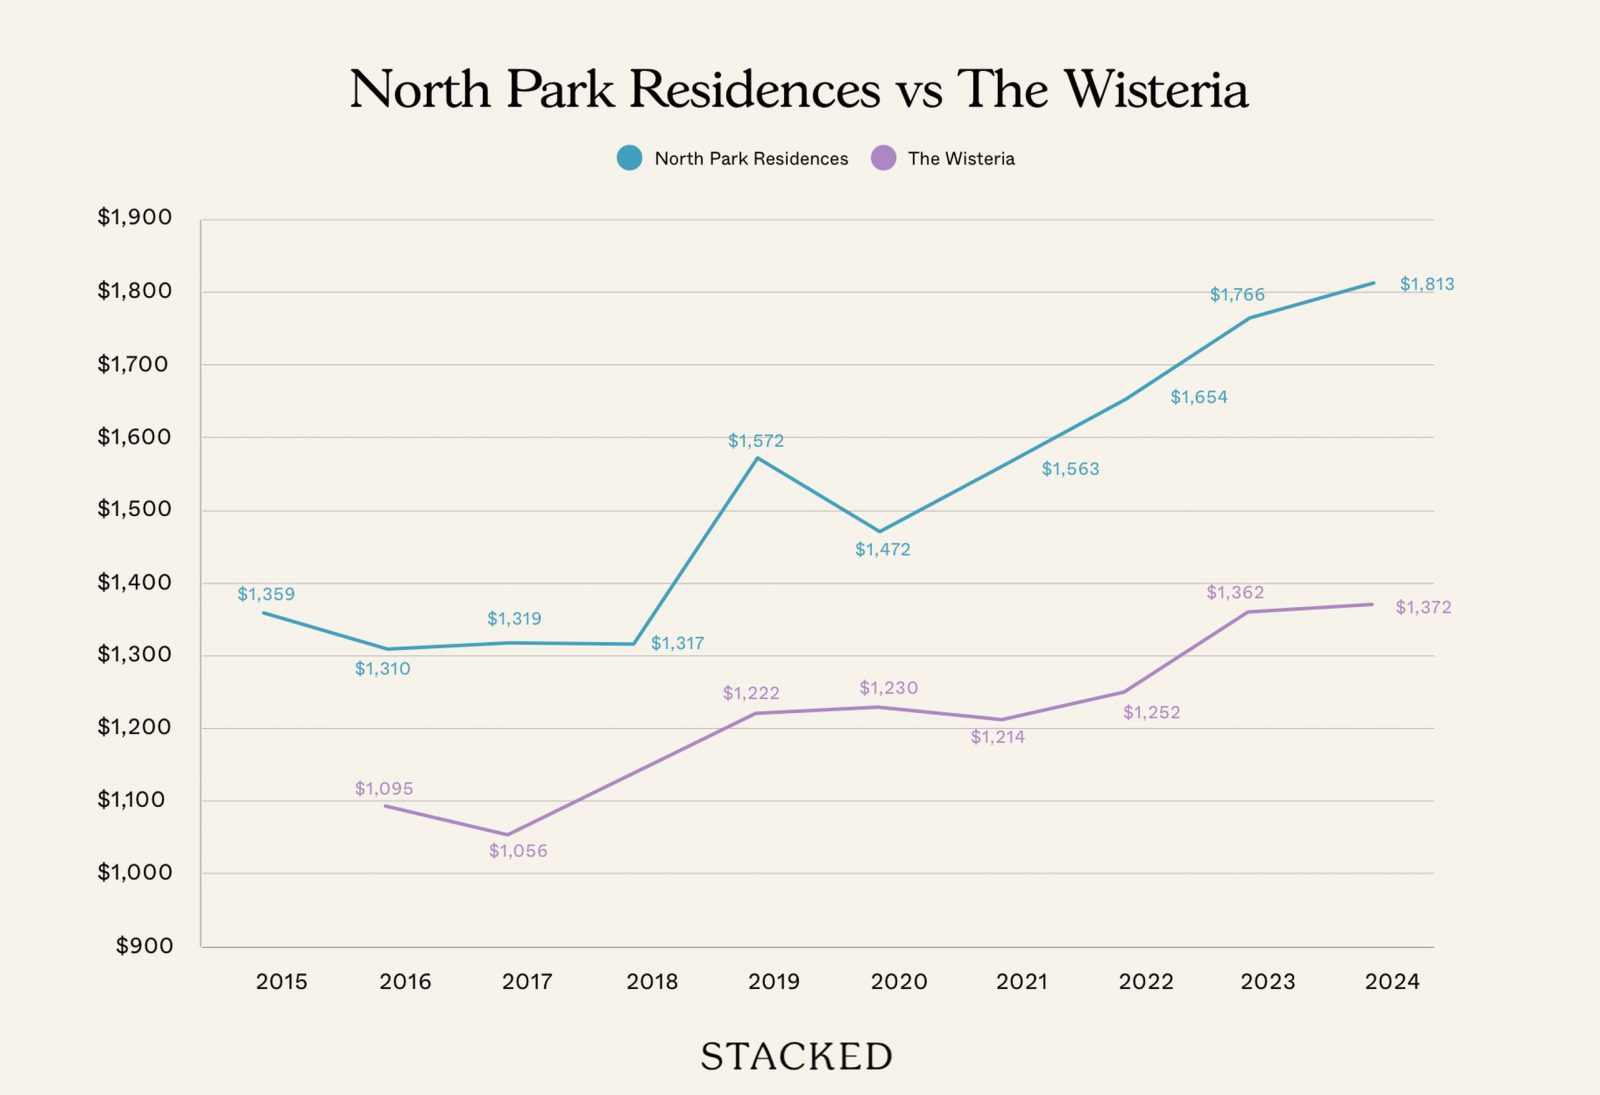
Both North Park Residences and The Wisteria obtained their TOP in 2018, and unlike the previous examples, North Park Residences launched a year earlier. When it launched, it held the record for the highest $PSF in the area, given its age and status as the only integrated development in Yishun.
When The Wisteria launched, North Park Residences was 19.6% more expensive. This premium was lower than what we saw in previous examples, but unlike the others, The Wisteria would have been a comparable age to North Park Residences.
Over time, however, the $PSF gap actually widened. Although both developments received their TOP in the same year and share a 99-year leasehold from 2015, the premium gap increased from around 20% at launch to over 30% in 2024.
While both developments have seen profits for their owners, they have lagged behind the market, especially considering they launched at the market's bottom. The premium gap might look significant, but The Wisteria has only experienced a 12% growth in the past six years. In comparison, North Park Residences grew from an average of $1,572 to $1,813 per square foot in six years — a mere 15% gain when the overall market saw much larger increases during this period.
Given these figures, it seems that the growth potential for North Park Residences is more limited. If newer estates like Sengkang only recently saw prices of $2,000 per square foot, it will likely take some time before older developments like North Park Residences can reach that mark.
Looking at past Integrated Developments offers valuable insights into how Parktown Residence might perform in terms of pricing and capital appreciation. The premium gap that Parktown Residence is currently asking for seems reasonable when compared to the premiums seen in the three Integrated Developments we examined.
However, what stands out from these past examples is that all three of these new launches performed either at or below average in terms of capital appreciation. This highlights an important takeaway: simply being an integrated development doesn't necessarily guarantee the best capital appreciation. While these developments are undoubtedly attractive for their convenience and lifestyle benefits - such as ease of finding tenants - the capital growth doesn't always align with the premium they command at launch.
In fact, looking at past performance suggests that such developments might be better viewed not as a "profit-making investment," but rather as a "lifestyle choice." The premium on these properties is a reflection of the added convenience and amenities, which make them appealing to certain buyers, but it does not necessarily translate into faster or greater appreciation in value than a regular condo. In the case of Parktown Residence, the indicative pricing is already setting a record for the estate, much like the other Integrated Developments we compared, suggesting that it might be following a similar pattern - attracting buyers who prioritise the lifestyle benefits over quick capital gains.
The exit strategy for Parktown Residence, then, appears to be a longer-term play. Given the premium pricing compared to existing properties in the area, it may take some time for HDB upgraders to adjust to the higher price point. As a result, buyers today could face a lower-than-average return, relative to the overall market, unless they are willing to hold onto the property for a longer period and wait for market conditions to align.
Drawing a parallel to Punggol
Punggol has been back in the spotlight with the recent opening of Punggol Coast MRT, marking yet another milestone in its transformation from an area once known for farming.
When Watertown—an integrated development with 992 units—was announced, Punggol was still in its early stages of development. By the time it was completed in 2016, the estate had yet to fully take shape. It wasn’t until 2018 that the Punggol Digital District was announced, further accelerating the area’s transformation. More recently, the Punggol Coast Hawker Centre, which opened in 2024, is another addition to its evolving landscape.
How does this relate to Tampines, an already well-established estate? While Tampines itself is mature, Tampines North has remained largely undeveloped until recent years, with a wave of new HDB projects shaping the landscape. In some ways, this mirrors the early days of Watertown, where new developments played a role in driving growth and transformation in the surrounding area.
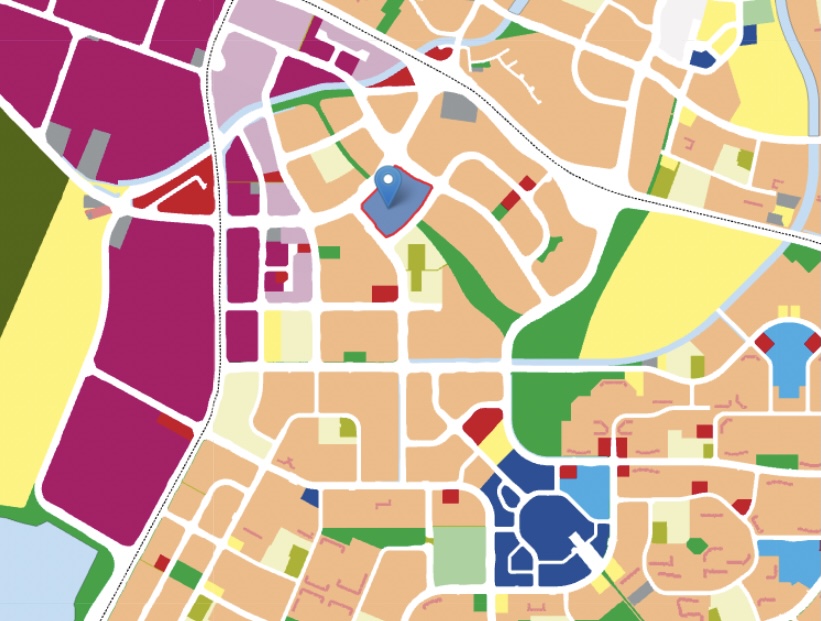
Tampines North still holds further growth potential. The reserved site (zoned in yellow) in the east, currently an eco park, presents opportunities for future redevelopment. Additionally, there are vacant industrial plots to the west that could see further development over time.
Given these similarities, it’s worth examining the premium Watertown commanded at its launch and how it has performed since.
First, let’s take a look at the transaction volume of Watertown compared to surrounding resale condos:
| Year | A TREASURE TROVE | FLO RESIDENCE | PARC CENTROS | RIVER ISLES | WATERTOWN |
| 2011 | 736 | ||||
| 2012 | 60 | 500 | 593 | 530 | 904 |
| 2013 | 31 | 9 | 2 | 52 | 16 |
| 2014 | 4 | 1 | 3 | 2 | |
| 2015 | 36 | 1 | 5 | 7 | |
| 2016 | 47 | 21 | 37 | 18 | 23 |
| 2017 | 48 | 36 | 35 | 41 | 37 |
| 2018 | 48 | 26 | 33 | 37 | 57 |
| 2019 | 20 | 15 | 16 | 21 | 47 |
| 2020 | 28 | 22 | 26 | 27 | 28 |
| 2021 | 73 | 48 | 44 | 54 | 72 |
| 2022 | 41 | 26 | 38 | 32 | 74 |
| 2023 | 25 | 24 | 19 | 20 | 44 |
| 2024 | 50 | 35 | 15 | 31 | 40 |
| Grand Total | 1247 | 763 | 859 | 871 | 1351 |
Aside from A Treasure Trove, all the highlighted condos were launched as new developments in 2012, while A Treasure Trove was the only one sold in 2011.
Notably, the majority of units in Watertown are 1-bedroom apartments. Relying solely on average $PSF may skew the data unfavorably, as 1-bedroom units tend to underperform compared to larger units.
This is particularly relevant when comparing Watertown to Parktown Residence, where the majority of units are 2- and 3-bedrooms. To provide a more meaningful comparison, here’s a look at the transaction volume for 2-bedroom units specifically:
| Year | A TREASURE TROVE | FLO RESIDENCE | PARC CENTROS | RIVER ISLES | WATERTOWN |
| 2011 | 266 | ||||
| 2012 | 4 | 88 | 114 | 58 | 179 |
| 2013 | 10 | 3 | |||
| 2014 | 1 | 1 | 1 | ||
| 2015 | 15 | 1 | 2 | ||
| 2016 | 20 | 4 | 4 | 4 | 1 |
| 2017 | 17 | 10 | 2 | 3 | |
| 2018 | 19 | 2 | 5 | 4 | 11 |
| 2019 | 6 | 5 | 2 | 1 | 7 |
| 2020 | 7 | 5 | 3 | 3 | 2 |
| 2021 | 28 | 8 | 9 | 4 | 13 |
| 2022 | 18 | 11 | 14 | 2 | 12 |
| 2023 | 11 | 9 | 3 | 3 | 11 |
| 2024 | 22 | 4 | 6 | 4 | 7 |
Transaction volumes were high in 2011 and 2012 during the launch period, but resale activity has been significantly lower in 2024, with fewer than 10 transactions recorded across all developments—except for A Treasure Trove.
Now, let’s examine their price gains over time:
| Year | A TREASURE TROVE | FLO RESIDENCE | PARC CENTROS | RIVER ISLES | WATERTOWN |
| 2011 | $936 | ||||
| 2012 | $947 | $891 | $1,011 | $912 | $1,252 |
| 2013 | $700 | $933 | |||
| 2014 | $1,121 | $1,009 | $1,239 | ||
| 2015 | $1,111 | $1,056 | $1,094 | ||
| 2016 | $1,064 | $1,033 | $1,176 | $992 | $1,161 |
| 2017 | $1,074 | $962 | $1,152 | $992 | |
| 2018 | $1,097 | $1,079 | $1,120 | $1,040 | $1,312 |
| 2019 | $1,074 | $985 | $1,208 | $1,104 | $1,327 |
| 2020 | $1,101 | $957 | $1,191 | $1,059 | $1,232 |
| 2021 | $1,156 | $992 | $1,199 | $1,107 | $1,383 |
| 2022 | $1,248 | $1,151 | $1,286 | $1,161 | $1,531 |
| 2023 | $1,386 | $1,261 | $1,404 | $1,286 | $1,625 |
| 2024 | $1,510 | $1,286 | $1,526 | $1,381 | $1,634 |
| ROI (2012 - 24) | 60% | 44% | 51% | 51% | 31% |
Here’s the volume of 3 bedders:
| Year | A TREASURE TROVE | FLO RESIDENCE | PARC CENTROS | RIVER ISLES | WATERTOWN |
| 2011 | 366 | ||||
| 2012 | 52 | 304 | 242 | 266 | 159 |
| 2013 | 6 | 4 | 46 | 10 | |
| 2014 | 1 | 1 | 1 | ||
| 2015 | 20 | 3 | 2 | ||
| 2016 | 22 | 7 | 16 | 4 | 5 |
| 2017 | 23 | 18 | 12 | 21 | 10 |
| 2018 | 19 | 21 | 12 | 18 | 9 |
| 2019 | 13 | 7 | 6 | 15 | 4 |
| 2020 | 11 | 13 | 12 | 13 | 8 |
| 2021 | 30 | 28 | 15 | 26 | 9 |
| 2022 | 19 | 12 | 11 | 21 | 8 |
| 2023 | 11 | 12 | 5 | 13 | 7 |
| 2024 | 25 | 19 | 6 | 12 | 5 |
Once again, we see a high volume of units sold at launch, but resale activity remains limited, except for A Treasure Trove.
Here’s a look at their performance over time:
| Year | A TREASURE TROVE | FLO RESIDENCE | PARC CENTROS | RIVER ISLES | WATERTOWN |
| 2011 | $911 | ||||
| 2012 | $938 | $836 | $910 | $831 | $1,166 |
| 2013 | $941 | $819 | $829 | $1,401 | |
| 2014 | $1,028 | $1,111 | $818 | ||
| 2015 | $1,077 | $957 | $1,099 | ||
| 2016 | $1,023 | $940 | $1,061 | $888 | $1,133 |
| 2017 | $1,009 | $886 | $1,054 | $912 | $1,272 |
| 2018 | $1,103 | $944 | $1,123 | $967 | $1,382 |
| 2019 | $1,118 | $940 | $1,140 | $979 | $1,394 |
| 2020 | $1,140 | $916 | $1,120 | $971 | $1,399 |
| 2021 | $1,179 | $979 | $1,197 | $1,033 | $1,437 |
| 2022 | $1,289 | $1,118 | $1,343 | $1,113 | $1,530 |
| 2023 | $1,419 | $1,238 | $1,385 | $1,218 | $1,691 |
| 2024 | $1,511 | $1,311 | $1,525 | $1,343 | $1,821 |
| ROI (2012-24) | 61% | 57% | 68% | 62% | 56% |
The 3-bedroom units performed better than the 2-bedders, though their gains were slightly below those of the other nearby condos—albeit not by a significant margin.
When comparing performance by unit type, Watertown’s 3-bedders were largely in line with the market, but its 2-bedders underperformed relative to similar resale condos.
While transaction volumes in 2024 remain low, they still provide some insight into how buyers who paid a premium at launch have fared over time. In this case, while Watertown has seen price appreciation, it has struggled to outperform nearby resale condos.
Nearby new Executive Condominiums - a potential challenge to the exit strategy
An important factor to consider in the area is the nearby Executive Condominiums (ECs) – Tenet and Aurelle. Both are situated to the east of Parktown Residence, not far from Parktown Mall and Tampines North MRT, making their location quite comparable. Together, these developments offer a total of 1,378 units.
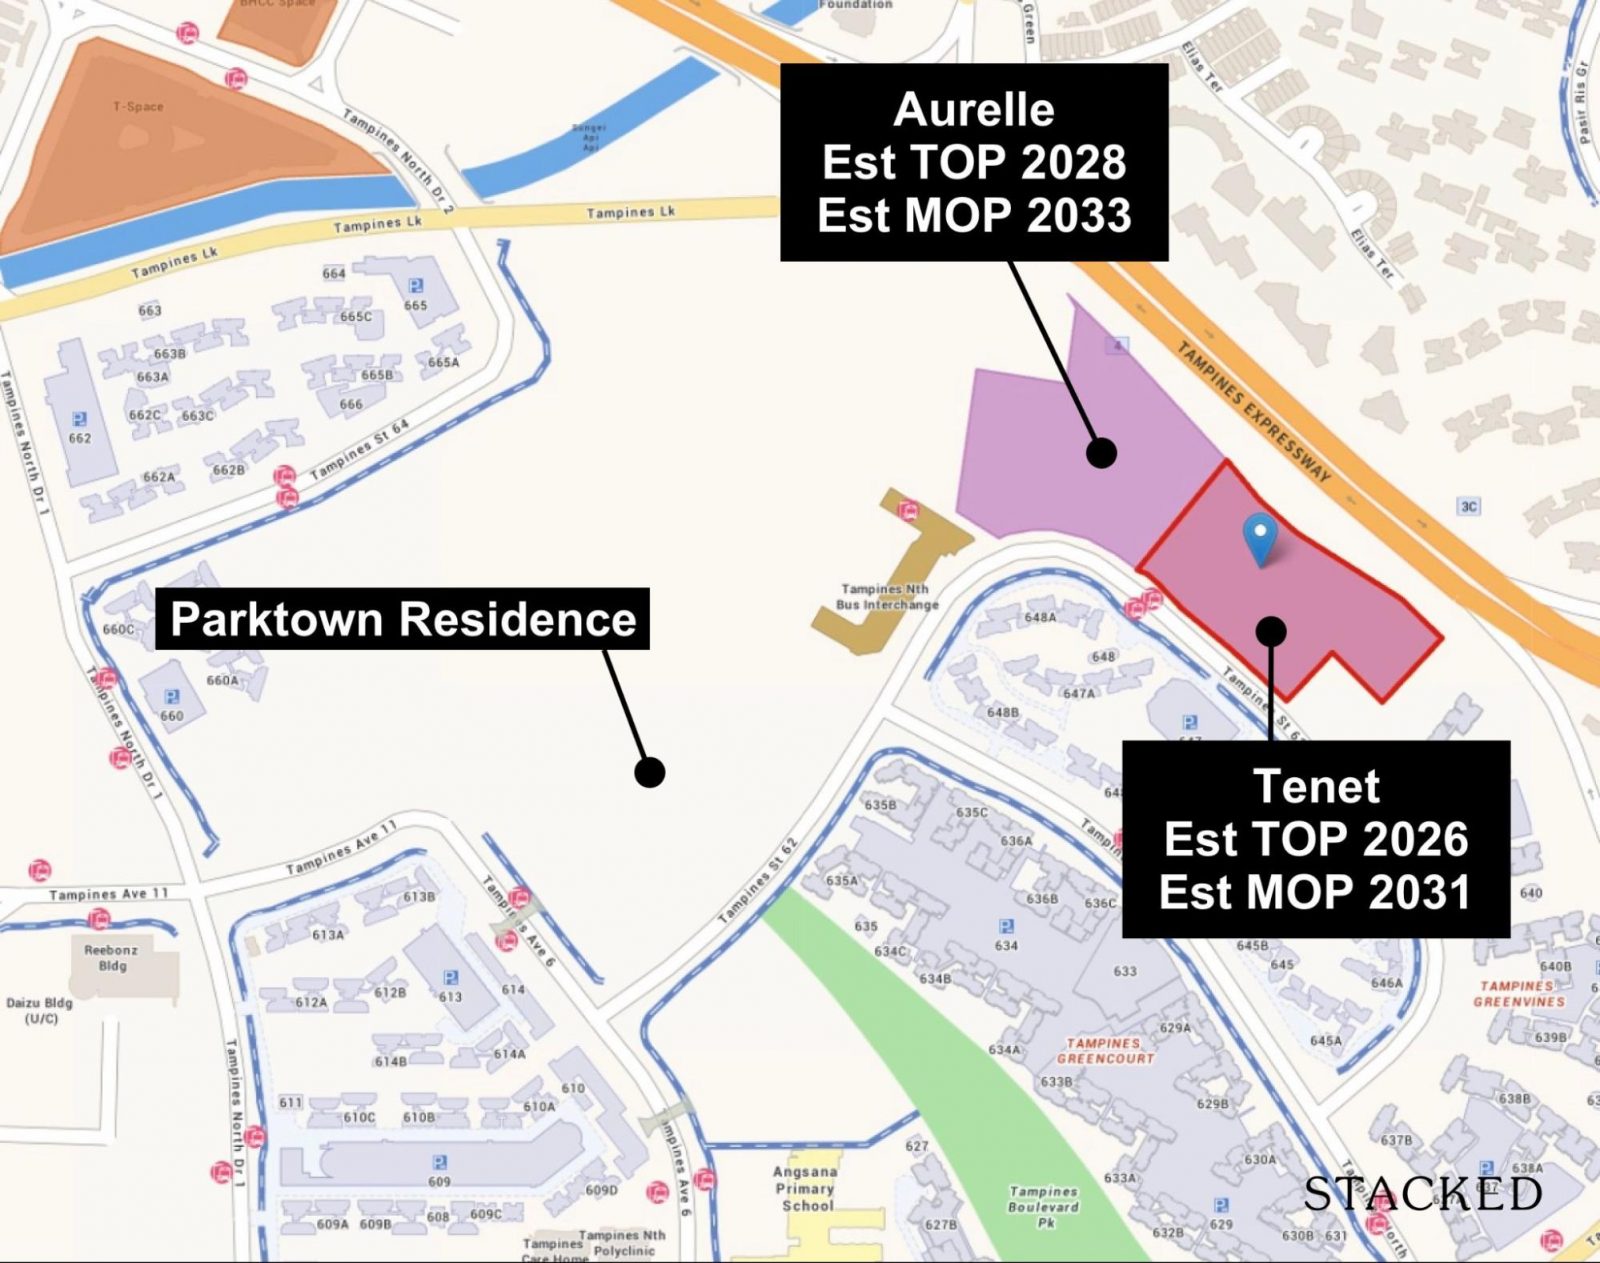
With Parktown Residence slated for completion in 2029, these ECs could pose a challenge as they enter the resale market, offering potential buyers – particularly HDB upgraders – more choices at a lower price point. The more affordable cost of these ECs gives them a competitive edge, as buyers may find them more attractive when looking for resale options in the future. This highlights once again that Parktown Residence represents a longer-term investment, with buyers needing to be patient for the market to fully absorb the higher price point before seeing significant returns.
While we’ve considered its pricing in the context of past examples and existing condos, buyers focused on strictly new launches today may be more interested in how it compares to current market offerings. Here's a quick look at the lowest prices of each development we have information on:
| Project | 1BR | 2BR | 3BR | 4BR | 5BR |
| North Gaia | $1,293,000 | $1,775,000 | |||
| Lumina Grand | $1,364,000 | $1,846,000 | $2,130,000 | ||
| The Shorefront | $1,471,000 | $1,739,000 | $2,797,000 | ||
| Kassia | $1,160,000 | $1,545,000 | $1,838,000 | $2,522,000 | |
| The Arden | $1,854,000 | $2,215,000 | |||
| Jansen House | $1,511,000 | $1,988,000 | $2,430,000 | ||
| Hillhaven | $1,616,560 | $2,032,146 | $2,730,234 | ||
| The Myst | $1,589,000 | $2,058,000 | $2,841,000 | $3,196,000 | |
| Parktown Residence | $1,070,000 | $1,330,000 | $2,070,000 | $2,850,000 | $3,780,000 |
| SORA | $1,544,000 | $2,094,000 | $3,225,000 | $3,542,000 | |
| Lentoria | $1,308,000 | $1,689,000 | $2,112,000 | $2,700,000 | |
| ELTA | $1,160,000 | $1,390,000 | $2,200,000 | $2,800,000 | $3,890,000 |
| The LakeGarden Residences | $1,470,000 | $1,568,100 | $2,240,400 | $2,755,500 | $3,289,600 |
| Hill House | $1,380,000 | $1,838,000 | $2,250,000 | ||
| Terra Hill | $1,884,000 | $2,361,000 | $3,469,000 | $5,511,000 | |
| Sceneca Residence | $2,378,000 | $3,148,000 | |||
| Koon Seng House | $1,807,000 | $2,387,000 | $2,780,000 | ||
| Hillock Green | $1,513,000 | $1,592,000 | $2,388,000 | $2,674,000 | |
| The Arcady at Boon Keng | $1,785,000 | $2,414,000 | $3,701,000 | ||
| Nava Grove | $1,901,000 | $2,432,700 | $3,180,200 | $4,329,100 | |
| Grand Dunman | $1,418,000 | $1,949,000 | $2,471,000 | $3,281,000 | $3,999,000 |
| Claydence | $1,473,600 | $1,886,400 | $2,528,600 | $5,410,000 | |
| The Hillshore | $1,768,000 | $2,588,000 | $3,880,000 | ||
| Chuan Park | $1,933,235 | $2,625,550 | $3,522,508 | ||
| The Botany at Dairy Farm | $2,665,000 | ||||
| Pinetree Hill | $2,006,000 | $2,671,000 | $3,214,000 | $4,364,000 | |
| Lentor Hills Residences | $1,406,000 | $2,733,000 | |||
| Atlassia | $3,059,028 | $2,804,578 | |||
| 8@BT | $1,565,000 | $1,881,000 | $2,813,000 | $3,613,000 | |
| The Continuum | $1,502,000 | $1,935,000 | $2,922,000 | $3,388,000 | $5,567,000 |
| J'den | $2,970,000 | $3,312,000 | |||
| Ikigai | $3,395,974 | ||||
| Enchante | $3,398,700 | $3,748,300 | |||
| 10 Evelyn | $1,431,500 | $3,416,000 | |||
| Midtown Bay | $1,588,000 | $2,308,000 | $4,714,000 | ||
| Watten House | $5,038,000 | $4,956,000 | $7,958,000 | ||
| Wallich Residence | $3,728,000 | $5,288,000 | |||
| The Giverny Residences | $5,497,000 | $9,566,000 | |||
| One Bernam | $5,765,000 | $14,132,000 | |||
| 32 Gilstead | $13,016,000 | ||||
| Altura | $2,210,000 | ||||
| Bartley Vue | $1,725,000 | ||||
| Blossoms By The Park | $3,336,000 | ||||
| Boulevard 88 | $4,811,100 | ||||
| Canninghill Piers | $1,712,000 | $8,904,000 | |||
| Cuscaden Reserve | $2,086,000 | ||||
| Grange 1866 | $1,694,000 | $2,285,000 | |||
| Irwell Hill Residences | $9,452,000 | $11,080,000 | |||
| Lentor Mansion | $2,717,000 | $3,243,000 | |||
| Norwood Grand | $2,590,000 | ||||
| Orchard Sophia | $1,646,888 | ||||
| Straits at Joo Chiat | $2,196,520 | $3,022,240 | |||
| Tembusu Grand | $1,409,000 | $3,743,000 | $4,028,000 | ||
| TMW Maxwell | $1,420,000 | $2,404,000 |
Parktown Residence is priced competitively, especially for those who value convenience. For buyers seeking a new launch in the east and looking for easy access to the Downtown Line, it offers a compelling option.
Kassia, another new launch in the east, has 3-bedroom units priced at over $1.8 million. While it is more affordable than Parktown Residence, Kassia is located in a less convenient area. We've previously discussed this enclave here, and given the abundance of condos in the vicinity, prices in the area may remain relatively subdued.
If you're considering 2-bedroom units, Parktown Residence stands out as one of the most competitive options. As more affordable bedroom types tend to sell out quickly, it offers a solid opportunity for buyers who may have missed out on other launches.
On the larger end, its 4-bedroom units are also well-positioned. Starting at over $2.8 million, the prices are quite comparable to Hillhaven, although Hillhaven isn't an integrated development like Parktown Residence.
Overall, the pricing of Parktown Residence seems to be well-aligned with the new launch market.
Conclusion
In conclusion, Parktown Residence’s pricing appears to be in line with market expectations for an integrated development.
While its premium over newer condos in the area like Treasure at Tampines might initially seem high, this is not uncommon when compared to other recent integrated developments like Pasir Ris 8 and Sengkang Grand Residences.
For those looking for smaller, lower-priced units, Parktown Residence presents an opportunity, especially considering its proximity to key amenities. Larger units, though priced similarly to other developments, offer added value through the integration of retail and civic features.
At Stacked, we like to look beyond the headlines and surface-level numbers, and focus on how things play out in the real world.
If you'd like to discuss how this applies to your own circumstances, you can reach out for a one-to-one consultation here.
And if you simply have a question or want to share a thought, feel free to write to us at stories@stackedhomes.com. We read every message.





0 Comments