

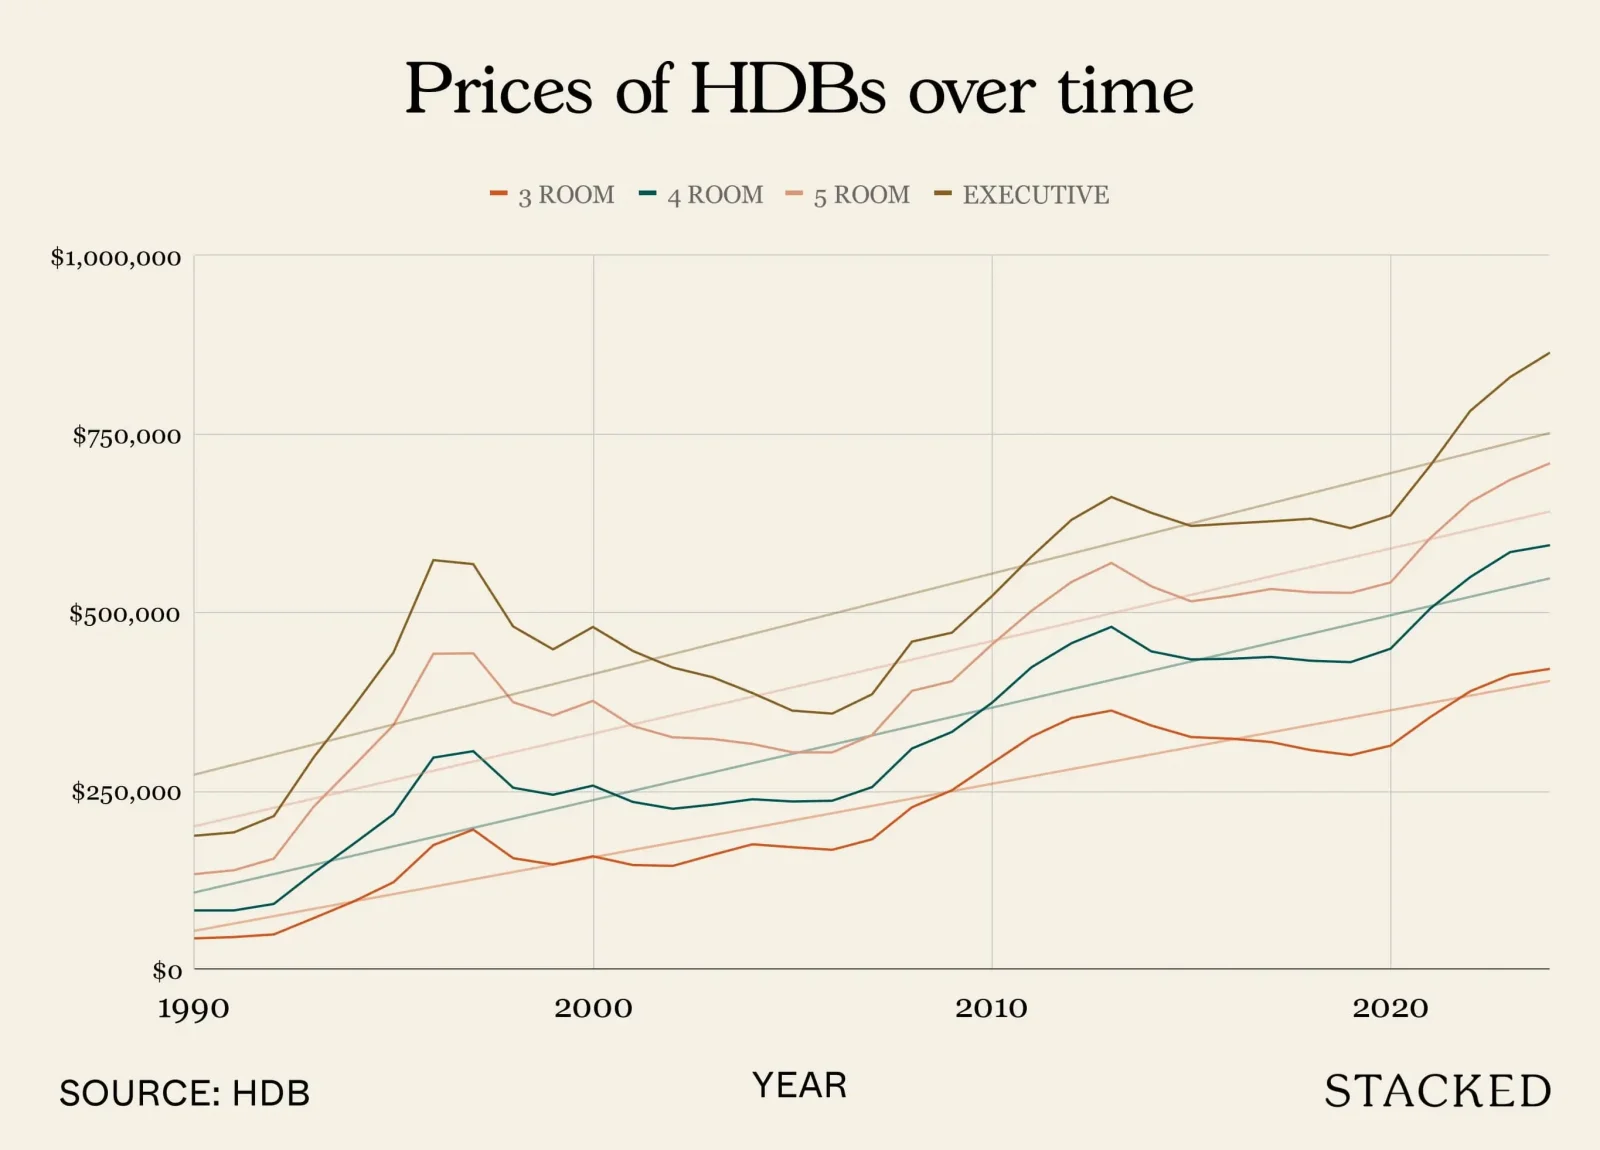
When it comes to the very biggest flats and whether it's worth paying their high prices today, it seems that everyone has divided opinions. Some will tell you these flats are already at peak prices and quite old, with little room for appreciation. Others will note that the number of million-dollar flats, and the scarcity of these large units, will keep their prices rising. Who’s right? We plumbed the depths of transaction records to try and find a pattern. Let's take a look at how the prices of the biggest HDB flats in Singapore have been moving as compared to everything else:
The challenge for many buyers today isn't access to information.
It's interpreting that information in a way that makes sense for their finances, goals, and stage of life.
Over time, that's also why we decided to work with agents who shared the same data-driven and advisory-led approach behind our editorial, consultants who could help readers think through decisions more objectively, rather than simply push transactions.
Today, the team has worked with more than 2,000 clients across over $5B in property transactions.
Price movements of the biggest flats versus others
| Year | 3 ROOM | 4 ROOM | 5 ROOM | EXECUTIVE |
| 1990 | $42,618 | $81,766 | $132,615 | $186,458 |
| 1991 | $44,480 | $81,800 | $138,103 | $191,167 |
| 1992 | $48,174 | $90,928 | $154,384 | $213,971 |
| 1993 | $71,019 | $134,511 | $227,253 | $296,455 |
| 1994 | $94,328 | $175,072 | $284,072 | $367,723 |
| 1995 | $121,298 | $216,663 | $341,553 | $443,288 |
| 1996 | $173,340 | $295,949 | $441,541 | $572,772 |
| 1997 | $195,115 | $304,972 | $442,182 | $567,156 |
| 1998 | $154,963 | $253,756 | $373,743 | $479,760 |
| 1999 | $146,099 | $243,891 | $355,042 | $447,643 |
| 2000 | $157,650 | $256,723 | $375,507 | $479,089 |
| 2001 | $145,396 | $233,900 | $340,184 | $445,524 |
| 2002 | $144,189 | $224,251 | $324,428 | $422,226 |
| 2003 | $159,651 | $230,132 | $322,054 | $408,603 |
| 2004 | $174,476 | $237,591 | $315,056 | $386,484 |
| 2005 | $170,400 | $234,486 | $303,456 | $361,812 |
| 2006 | $166,727 | $235,506 | $303,186 | $357,635 |
| 2007 | $181,502 | $254,604 | $327,557 | $384,763 |
| 2008 | $226,443 | $308,748 | $389,542 | $458,551 |
| 2009 | $250,124 | $331,898 | $403,023 | $471,082 |
| 2010 | $288,079 | $372,574 | $454,304 | $522,056 |
| 2011 | $325,340 | $422,735 | $501,826 | $577,826 |
| 2012 | $351,345 | $456,295 | $542,172 | $629,253 |
| 2013 | $361,936 | $479,261 | $568,800 | $661,300 |
| 2014 | $341,008 | $444,921 | $536,065 | $639,124 |
| 2015 | $324,761 | $433,627 | $515,018 | $620,677 |
| 2016 | $322,474 | $434,479 | $522,709 | $624,048 |
| 2017 | $317,834 | $437,120 | $532,277 | $627,211 |
| 2018 | $306,478 | $431,753 | $527,635 | $630,780 |
| 2019 | $299,457 | $429,749 | $526,812 | $617,561 |
| 2020 | $312,709 | $448,608 | $541,457 | $635,395 |
| 2021 | $352,961 | $505,095 | $603,990 | $705,559 |
| 2022 | $388,974 | $549,088 | $654,253 | $782,007 |
| 2023 | $411,880 | $584,035 | $685,338 | $829,310 |
| 2024 | $420,389 | $593,725 | $708,654 | $863,726 |
Between the period from 1990 to the present, the top performers are actually the smaller flats.
3-room flats appreciated by 886.4 per cent over this period, whilst the largest executive flats appreciated by just 336.22 per cent.
Indeed, one of the apparent patterns is that the larger the flat, the slower the appreciation over this 34-year period.
However, we shouldn’t just look at the overall quantum. We also took a look at the year-on-year appreciation across the different flat sizes:
| Year | 3 ROOM | 4 ROOM | 5 ROOM | EXECUTIVE |
| 1990 | - | - | - | - |
| 1991 | 4.4% | 0.0% | 4.1% | 2.5% |
| 1992 | 8.3% | 11.2% | 11.8% | 11.9% |
| 1993 | 47.4% | 47.9% | 47.2% | 38.5% |
| 1994 | 32.8% | 30.2% | 25.0% | 24.0% |
| 1995 | 28.6% | 23.8% | 20.2% | 20.5% |
| 1996 | 42.9% | 36.6% | 29.3% | 29.2% |
| 1997 | 12.6% | 3.0% | 0.1% | -1.0% |
| 1998 | -20.6% | -16.8% | -15.5% | -15.4% |
| 1999 | -5.7% | -3.9% | -5.0% | -6.7% |
| 2000 | 7.9% | 5.3% | 5.8% | 7.0% |
| 2001 | -7.8% | -8.9% | -9.4% | -7.0% |
| 2002 | -0.8% | -4.1% | -4.6% | -5.2% |
| 2003 | 10.7% | 2.6% | -0.7% | -3.2% |
| 2004 | 9.3% | 3.2% | -2.2% | -5.4% |
| 2005 | -2.3% | -1.3% | -3.7% | -6.4% |
| 2006 | -2.2% | 0.4% | -0.1% | -1.2% |
| 2007 | 8.9% | 8.1% | 8.0% | 7.6% |
| 2008 | 24.8% | 21.3% | 18.9% | 19.2% |
| 2009 | 10.5% | 7.5% | 3.5% | 2.7% |
| 2010 | 15.2% | 12.3% | 12.7% | 10.8% |
| 2011 | 12.9% | 13.5% | 10.5% | 10.7% |
| 2012 | 8.0% | 7.9% | 8.0% | 8.9% |
| 2013 | 3.0% | 5.0% | 4.9% | 5.1% |
| 2014 | -5.8% | -7.2% | -5.8% | -3.4% |
| 2015 | -4.8% | -2.5% | -3.9% | -2.9% |
| 2016 | -0.7% | 0.2% | 1.5% | 0.5% |
| 2017 | -1.4% | 0.6% | 1.8% | 0.5% |
| 2018 | -3.6% | -1.2% | -0.9% | 0.6% |
| 2019 | -2.3% | -0.5% | -0.2% | -2.1% |
| 2020 | 4.4% | 4.4% | 2.8% | 2.9% |
| 2021 | 12.9% | 12.6% | 11.5% | 11.0% |
| 2022 | 10.2% | 8.7% | 8.3% | 10.8% |
| 2023 | 5.9% | 6.4% | 4.8% | 6.0% |
| 2024 | 2.1% | 1.7% | 3.4% | 4.1% |
If we average out their appreciation rates over the years, here's what you'll see:
| Period | 3 ROOM | 4 ROOM | 5 ROOM | EXECUTIVE |
| 1990 - 2024 | 7.81% | 6.70% | 5.66% | 5.16% |
| 2014 - 2024 | 1.54% | 2.10% | 2.13% | 2.57% |
Notice how between 1990 - 2024, the average year on year returns for smaller flats are better?
But if we isolate the returns of just the past 10 years, the outcome is the complete opposite!
If we go by annualised returns, the larger flats in the past 10 years now outperform the smaller ones; though note that the margin between 5-room flats and executive flats is rather slim. In any case, the 10-year annualised returns for the executive flats beat the smaller flats, despite 3-rooms showing the biggest gains over the 34-year period.
To further illustrate this, let's consider the return of each flat type assuming you bought and sold within 10 years for each year since 2000.
What happens if you bought and sold a flat within 10 years?
This may be more pertinent to upgraders, who don’t typically hold a flat for 30+ years; quite often you’ll buy and sell the flat within a 10-year span. In this context, would a smaller or bigger flat serve you better?
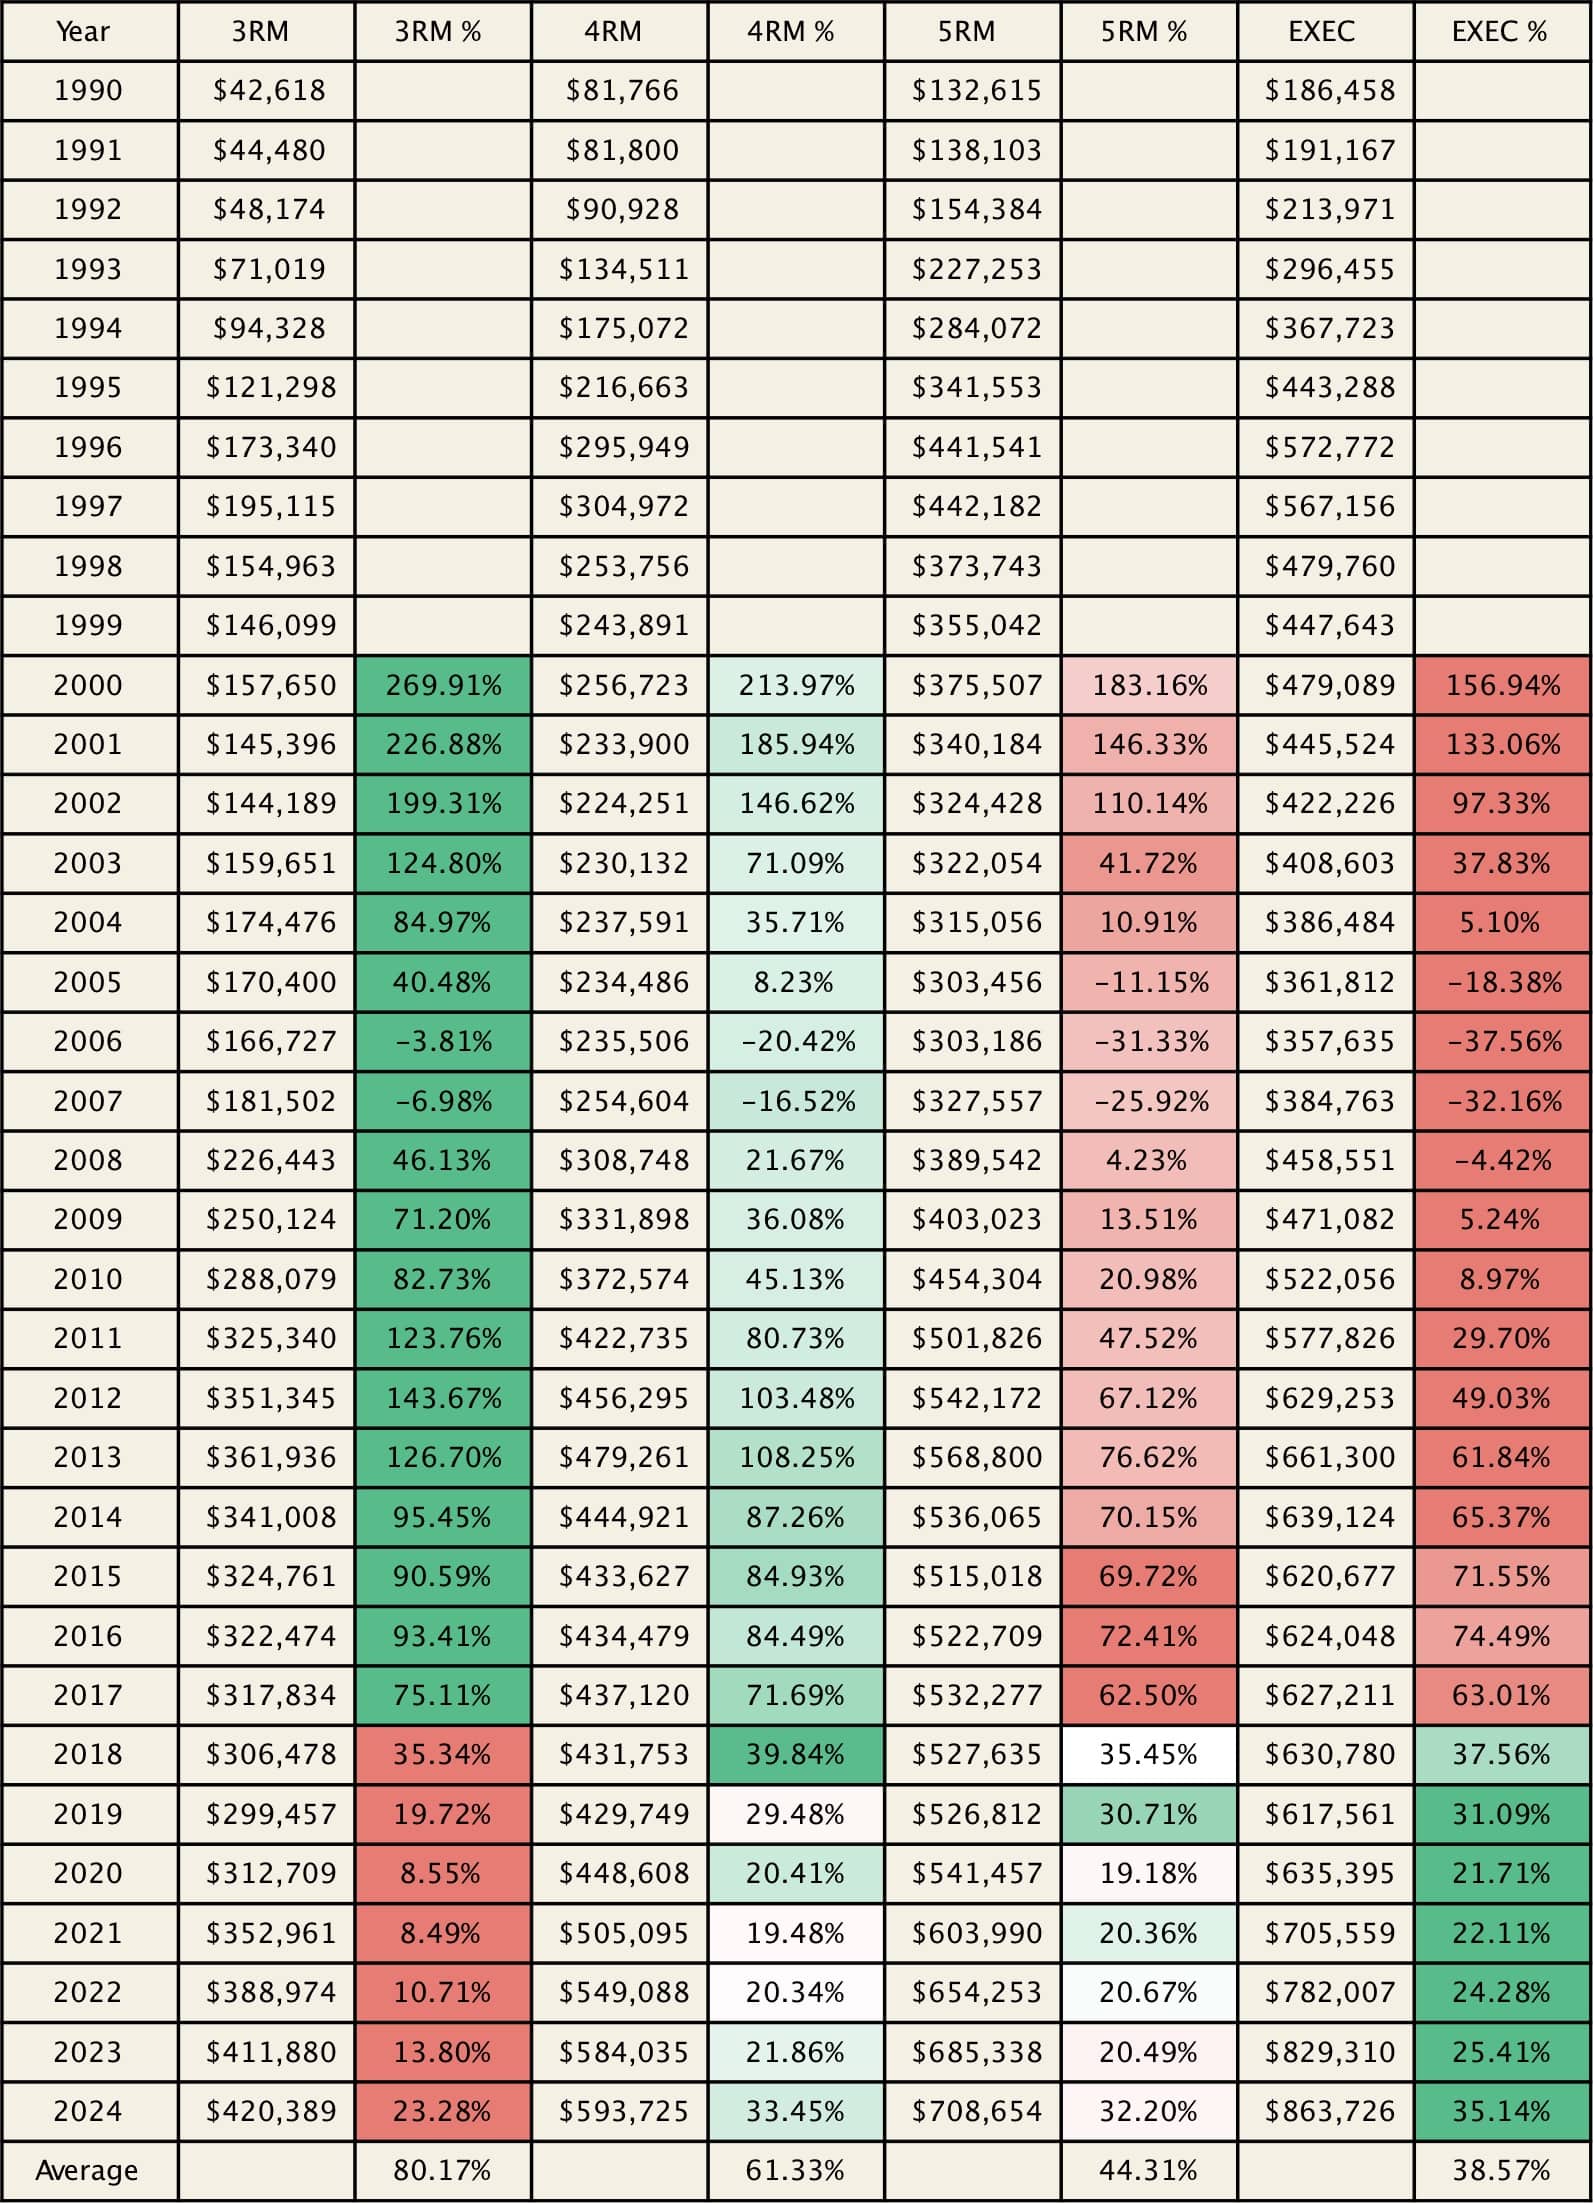
The table above shows the average prices of each flat type and the associated gains or losses if you bought and sold over a 10-year period.
For example, if you bought a 3-room flat in 1990 and sold it in 2000, you would've made 270%.
In this case, green refers to the biggest winner across all the flat types for that year and red represents the lowest performer.
Notice how 3-room flats are usually the winners from those who bought in 1990 and sold 10 years later, up until 2008? From there, it seems that the tables turned, where the bigger executive flats made more!
From 1990 to 2007, executive flats showed a rather lacklustre performance. Why? Here’s one possible explanation, which even led to the invention of the Built To Order (BTO) system:
“Almost every year, until 2006, Members of Parliament expressed their concerns in Parliament about the unsold stock (referring to HDB flats), and asked what steps HDB was taking to clear it. The Auditor-General’s Office, too, urged the Board to reduce its unsold stock, highlighting the high cost of holding vacant flats,” he said.” - CNA
The issue of vacancies had started to pile up as early as 1989 actually, particularly in towns like Woodlands. In any case, there was a huge supply of flats, jumbo flats (two flats joined into one) came into being, and flats from that particular era were already bigger than today’s. So perhaps big executive flats were less of a (pardon the pun) big deal back then.
But then in 1995, Executive Maisonettes were phased out; and in 2005, Executive Apartments also stopped being built.
Now these large flats started to take on scarcity value, as their numbers could only decrease going forward. So by around 2008, Executive flats started to see more significant demand and appreciation; and it’s likely that this will carry on until the point where lease decaytps://stackedhomes.com/jurong-east-hdb-lease-decay-prices-analysis/">lease decay kicks in.
While we don’t know when that is, we wouldn’t be too quick to guess that it’s anytime soon, for reasons we describe here.
A look at performance in terms of absolute gains/losses
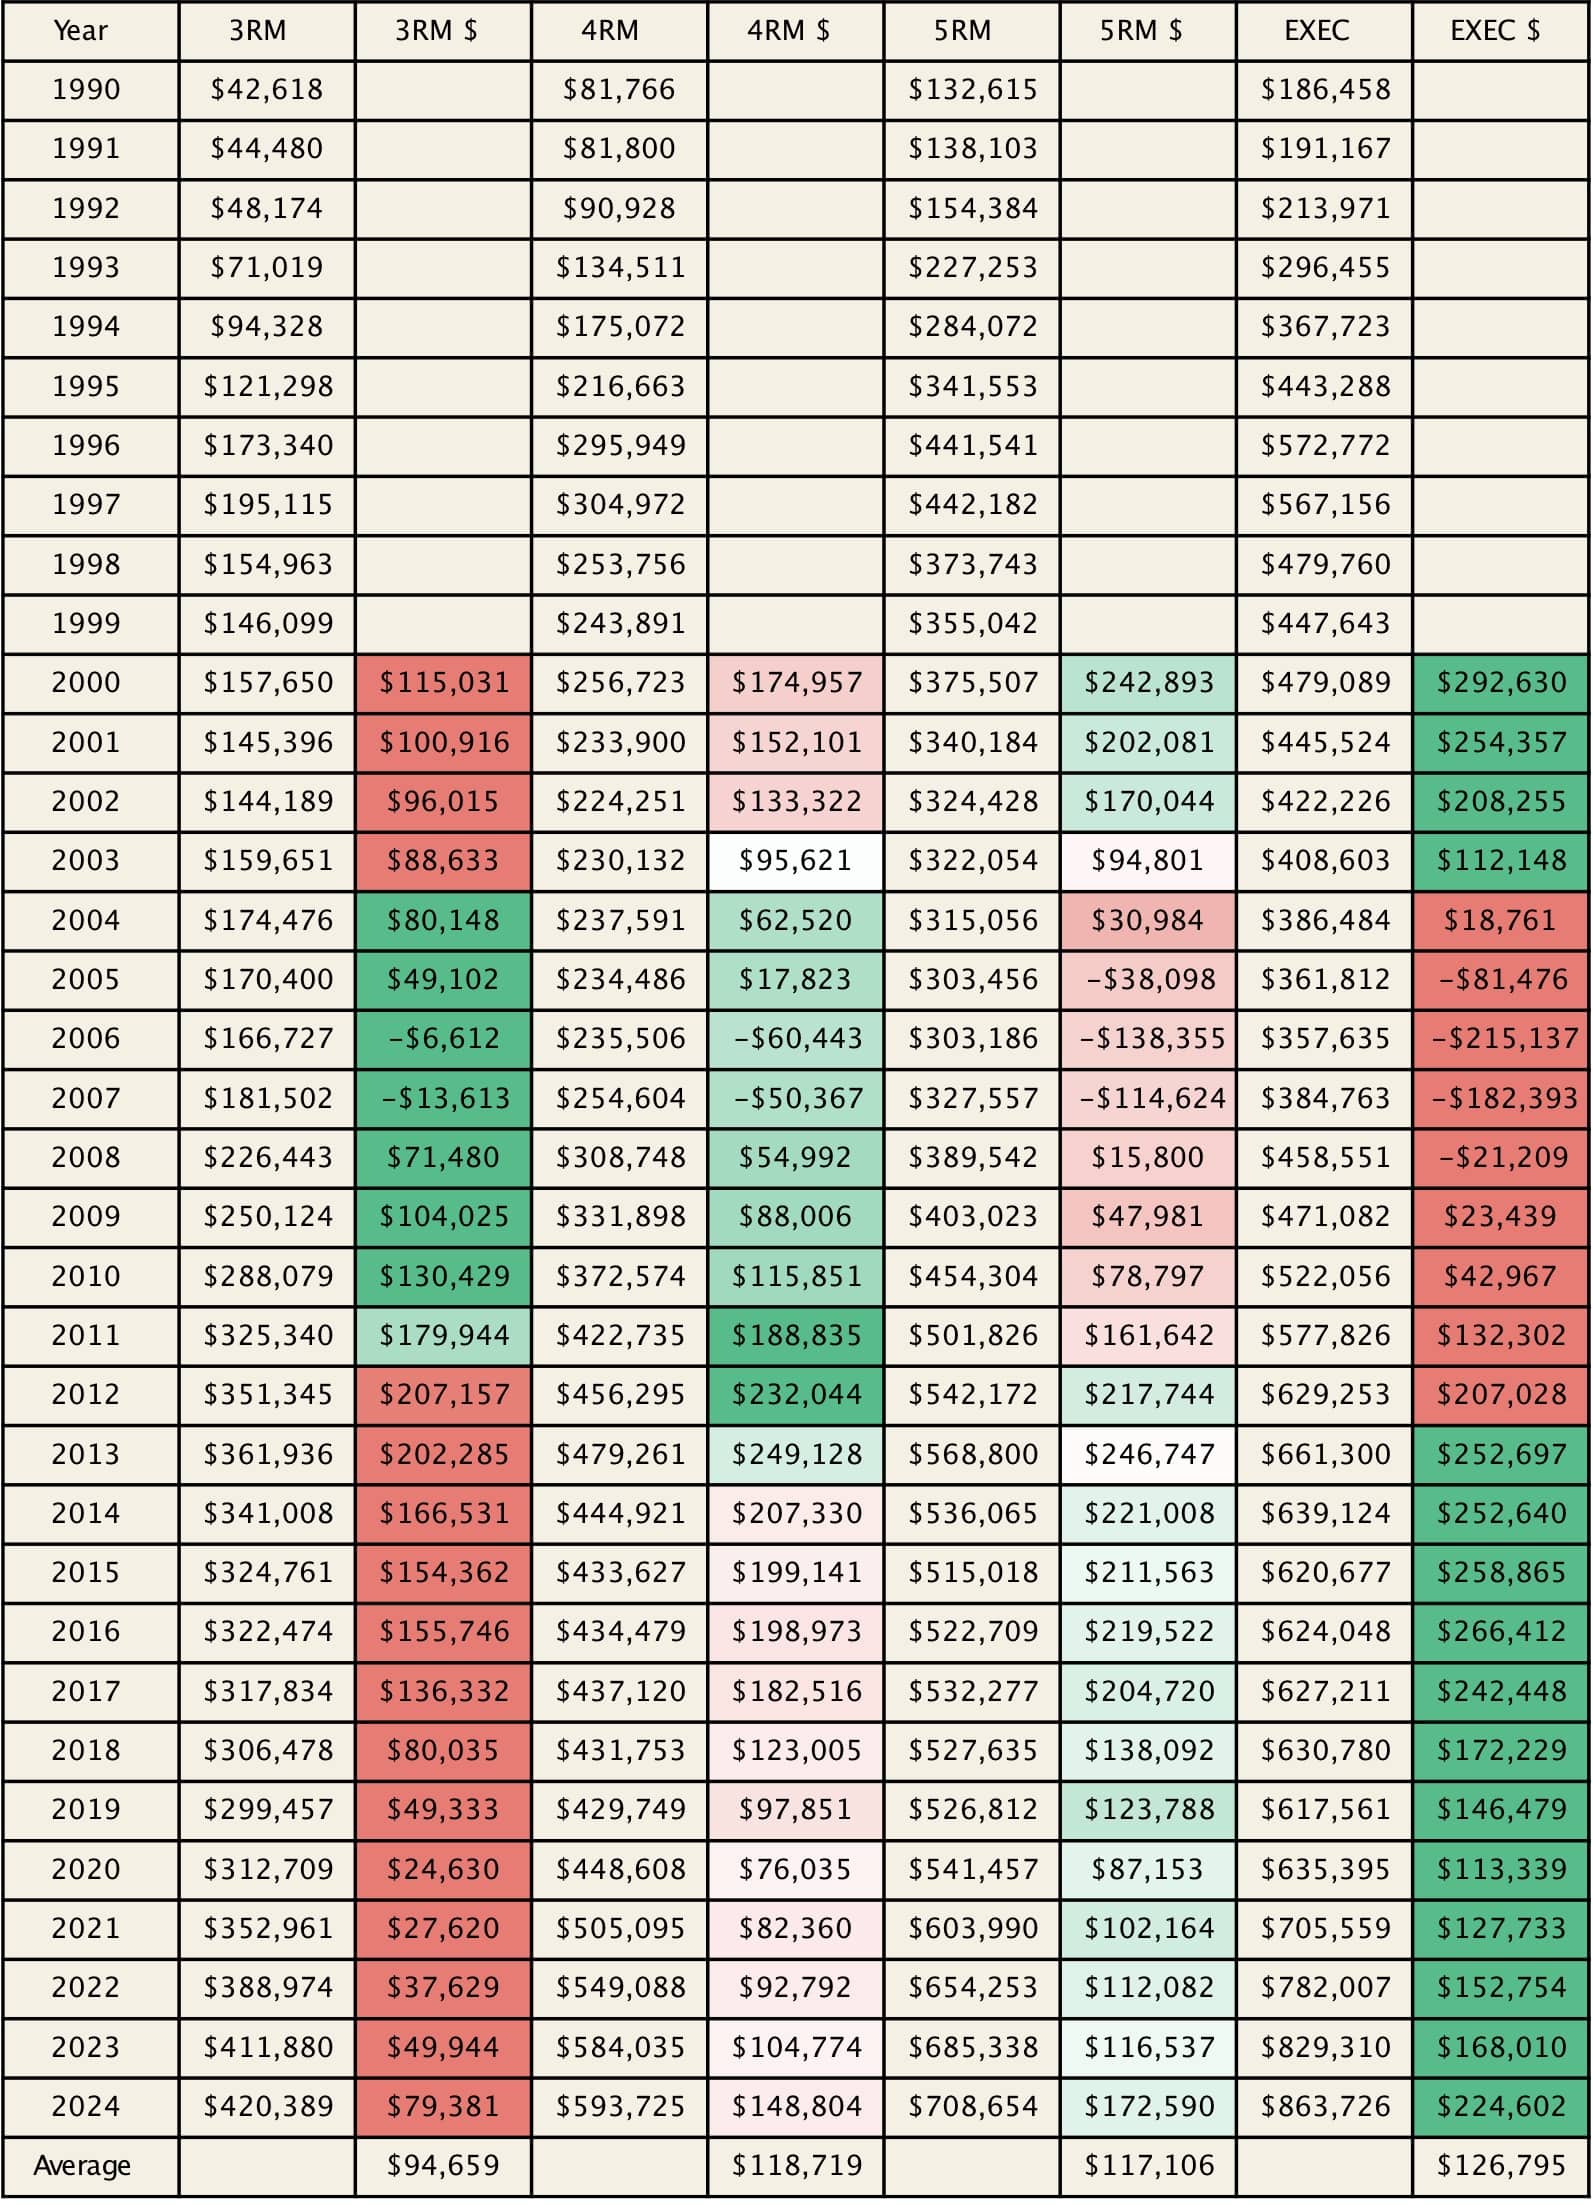
If we look at the absolute gains, there is a slight difference in pattern here. Executive flats bought between 1990 - 1993 made the most as indicated by the green. This is despite being the biggest lower in terms of return on investment.
However, those who bought between 1994 to 2002 and held it for 10 years saw the biggest loss in total returns.
Again, this is due to the weaker performance of executive flats in the 1990s, with transactions in ‘96 and ‘97 pulling down the average gains significantly.
From 2004 to 2014, those who bought and sold at the end of 10 years would have seen better absolute gains compared to those prior.
So to conclude this point: within the context of the past 10 years, executive flats have generally outperformed smaller counterparts; but not at all points in our real estate history.
Does the model of the executive flat matter?
There are different types of executive flats, so we looked at their prices:
| Year | Exec Adjoined flat | Exec Apartment | Exec Maisonette | Multi-Generation |
| 1990 | - | $182,802 | $187,528 | - |
| 1991 | - | $185,053 | $192,575 | $165,000 |
| 1992 | - | $214,830 | $213,743 | $226,586 |
| 1993 | - | $295,177 | $296,864 | $293,700 |
| 1994 | - | $370,294 | $366,935 | $398,703 |
| 1995 | - | $454,511 | $439,542 | $486,585 |
| 1996 | - | $577,859 | $570,710 | $606,696 |
| 1997 | - | $570,296 | $564,846 | $605,919 |
| 1998 | - | $481,456 | $477,269 | $516,930 |
| 1999 | - | $449,056 | $444,896 | $461,607 |
| 2000 | $377,133 | $482,402 | $476,517 | $500,050 |
| 2001 | $358,500 | $448,389 | $441,335 | $456,665 |
| 2002 | $355,743 | $427,631 | $415,334 | $433,186 |
| 2003 | $359,718 | $414,423 | $401,661 | $431,333 |
| 2004 | $345,394 | $388,211 | $384,866 | $431,833 |
| 2005 | $341,682 | $362,109 | $361,846 | $421,600 |
| 2006 | $372,841 | $355,358 | $361,094 | $400,385 |
| 2007 | $421,063 | $382,241 | $388,933 | $409,952 |
| 2008 | $528,233 | $454,632 | $463,937 | $480,200 |
| 2009 | $502,611 | $463,285 | $483,977 | $511,444 |
| 2010 | $595,449 | $514,070 | $534,913 | $617,241 |
| 2011 | $680,900 | $567,627 | $593,963 | $675,000 |
| 2012 | $750,333 | $616,142 | $652,329 | $798,167 |
| 2013 | $782,400 | $649,298 | $681,961 | $767,127 |
| 2014 | $761,600 | $614,571 | $677,573 | $702,000 |
| 2015 | $720,861 | $594,359 | $662,627 | $805,000 |
| 2016 | $810,299 | $590,919 | $678,280 | $722,750 |
| 2017 | $762,857 | $598,065 | $679,945 | $783,750 |
| 2018 | $790,160 | $600,946 | $677,569 | $801,393 |
| 2019 | $696,224 | $586,445 | $661,785 | $819,190 |
| 2020 | $759,800 | $608,669 | $674,645 | $773,125 |
| 2021 | $819,200 | $674,012 | $750,996 | $820,778 |
| 2022 | $877,306 | $747,853 | $832,859 | $874,949 |
| 2023 | $980,806 | $798,608 | $873,401 | $996,667 |
| 2024 | - | $812,021 | $915,431 | - |
| Returns | 160% | 66% | 83% | 99% |
Over roughly the past two decades, we’ve seen that adjoining flats tend to do the best; not a big surprise, as they’re bigger and rarer. The follow-up, interestingly enough, was 3Gen flats.
This one is a surprise, as 3Gen flats have much smaller prospective buyer pools. These flats are reserved strictly for extended family buyers; so perhaps there are more Singaporeans living with extended family over the past two decades.
Speculatively, we wonder if this relates to our ageing population. It’s easier to look after your older parents when they’re under the same roof, and perhaps 3Gen flats can get more popular still.
Year-on-year returns for the different Executive flat types
| Year | Exec Adjoined flat | Exec Apartment | Exec Maisonette | Multi-Generation |
| 2001 | -4.9% | -7.1% | -7.4% | -8.7% |
| 2002 | -0.8% | -4.6% | -5.9% | -5.1% |
| 2003 | 1.1% | -3.1% | -3.3% | -0.4% |
| 2004 | -4.0% | -6.3% | -4.2% | 0.1% |
| 2005 | -1.1% | -6.7% | -6.0% | -2.4% |
| 2006 | 9.1% | -1.9% | -0.2% | -5.0% |
| 2007 | 12.9% | 7.6% | 7.7% | 2.4% |
| 2008 | 25.5% | 18.9% | 19.3% | 17.1% |
| 2009 | -4.9% | 1.9% | 4.3% | 6.5% |
| 2010 | 18.5% | 11.0% | 10.5% | 20.7% |
| 2011 | 14.4% | 10.4% | 11.0% | 9.4% |
| 2012 | 10.2% | 8.5% | 9.8% | 18.2% |
| 2013 | 4.3% | 5.4% | 4.5% | -3.9% |
| 2014 | -2.7% | -5.3% | -0.6% | -8.5% |
| 2015 | -5.3% | -3.3% | -2.2% | 14.7% |
| 2016 | 12.4% | -0.6% | 2.4% | -10.2% |
| 2017 | -5.9% | 1.2% | 0.2% | 8.4% |
| 2018 | 3.6% | 0.5% | -0.3% | 2.3% |
| 2019 | -11.9% | -2.4% | -2.3% | 2.2% |
| 2020 | 9.1% | 3.8% | 1.9% | -5.6% |
| 2021 | 7.8% | 10.7% | 11.3% | 6.2% |
| 2022 | 7.1% | 11.0% | 10.9% | 6.6% |
| 2023 | 11.8% | 6.8% | 4.9% | 13.9% |
| Average from 2000 - 2023 | 4.6% | 2.5% | 2.9% | 3.4% |
| Average from 2013 - 2023 | 2.6% | 2.2% | 2.6% | 3.0% |
Adjoined flats still lead the pack on an annualised basis; and again, 3Gen flats followed just behind; so there’s no real difference in this context. However, in the past 10 years, we see that multi-generational flats are the ones that outperform, on average.
So to conclude from the following, the scarcity and size of larger flats can not only hold their prices, but possibly even outperform the smaller flats; they have room for appreciation still.
However, there’s still the inevitability of lease decay which, at some undetermined point in the future, will almost certainly cause this to change.
At Stacked, we like to look beyond the headlines and surface-level numbers, and focus on how things play out in the real world.
If you'd like to discuss how this applies to your own circumstances, you can reach out for a one-to-one consultation here.
And if you simply have a question or want to share a thought, feel free to write to us at stories@stackedhomes.com. We read every message.





1 Comments
what are exec adjoin flats? do you have an eg?