


New Launch Condo Reviews
River Modern Condo Review: A River-facing New Launch with Direct Access to Great World MRT Station
February 20, 2026 22 min read
| Project: | River Modern |
|---|---|
| District: | 9 |
| Address: | River Valley Green |
| Tenure: | 99-year Leasehold from Feb 2025 |
| No. of Units: | 455 Units |
| Site Area: | ~126,325 sq ft |
| Developer: | Guocoland Limited |
| TOP: | 2030 |
River Modern is GuocoLand’s newest project in the River Valley area, and the 99-year leasehold development was open for public preview on Feb 20. The luxury riverfront development sits along River Valley Green in prime District 9.
The project features a mix of two- to four-bedroom units ranging from 538 sq ft to 1,830 sq ft. Indicative selling prices will start from $2,877 psf, or about $1,548 million, for a 538 sq ft two-bedder. The project will preview for two weeks, with the sales booking expected on March 7.
River Modern is the fourth new project launch in the River Valley area in less than a year, after 2025 saw the launch of three new condominiums – River Green, Promenade Peak, and Zyon Grand.
The introduction of four new condos in this prime neighbourhood within a relatively short time might raise concerns about the potential for supply to get ahead of demand. Collectively, all four condos have injected 2,281 new private homes in this neighbourhood.
But the sales performance of the three previously launched projects suggests that demand for new private homes in this prime residential enclave remains robust.
For example, the 524-unit River Green moved 460 units (88%) and set an average selling price of $3,130 psf during its initial sales launch over the Aug 2-3 weekend last year. The development by Wing Tai Holdings has since sold 483 units (92%) at an average price of $3,133 psf.
Meanwhile, Promenade Peak, which launched the same weekend as River Green, sold 320 units (53%) of its 596 units at an average price of $2,894 psf. Developed by Allgreen Properties, the project has since sold 391 units (66%) at an average price of $2,971 psf.
Developer sales figures for Zyon Grand indicate that the 706-unit condo, which is developed by City Developments (CDL), has sold 617 units (87%) at an average price of $3,048 psf, inching up from its initial weekend sales performance last October when it moved 590 units at $3,050 psf.
All three previously launched projects have sold a significant number of their available units, with new sales still being clocked, according to caveats. This tells us that while new launches have been relatively more frequent in this part of the River Valley area, unsold inventory is gradually thinning out.
It’s a strong indication of the demand for new private homes in this particular pocket of the Central Region.
The latest transaction activity in the CCR is a continuation of the purchasing activity we saw in the market last year, when buyers capitalised on the narrowing price gap between some new launch projects in the Core Central Region (CCR) stacked against higher launch prices in many Rest of Central Region (RCR) developments.
But given the upcoming pipeline of new projects, the pendulum of buying activity will likely swing to the city-fringe and suburbs this year.
Although all four of the newest projects in River Valley sit within the same locale, the reality is that these condos aren’t fighting for the same set of buyers and homeowners. Our review of each project reveals that each of their unit layouts, selling prices, and overall product positioning varies enough to segment demand and the catchment of buyers.
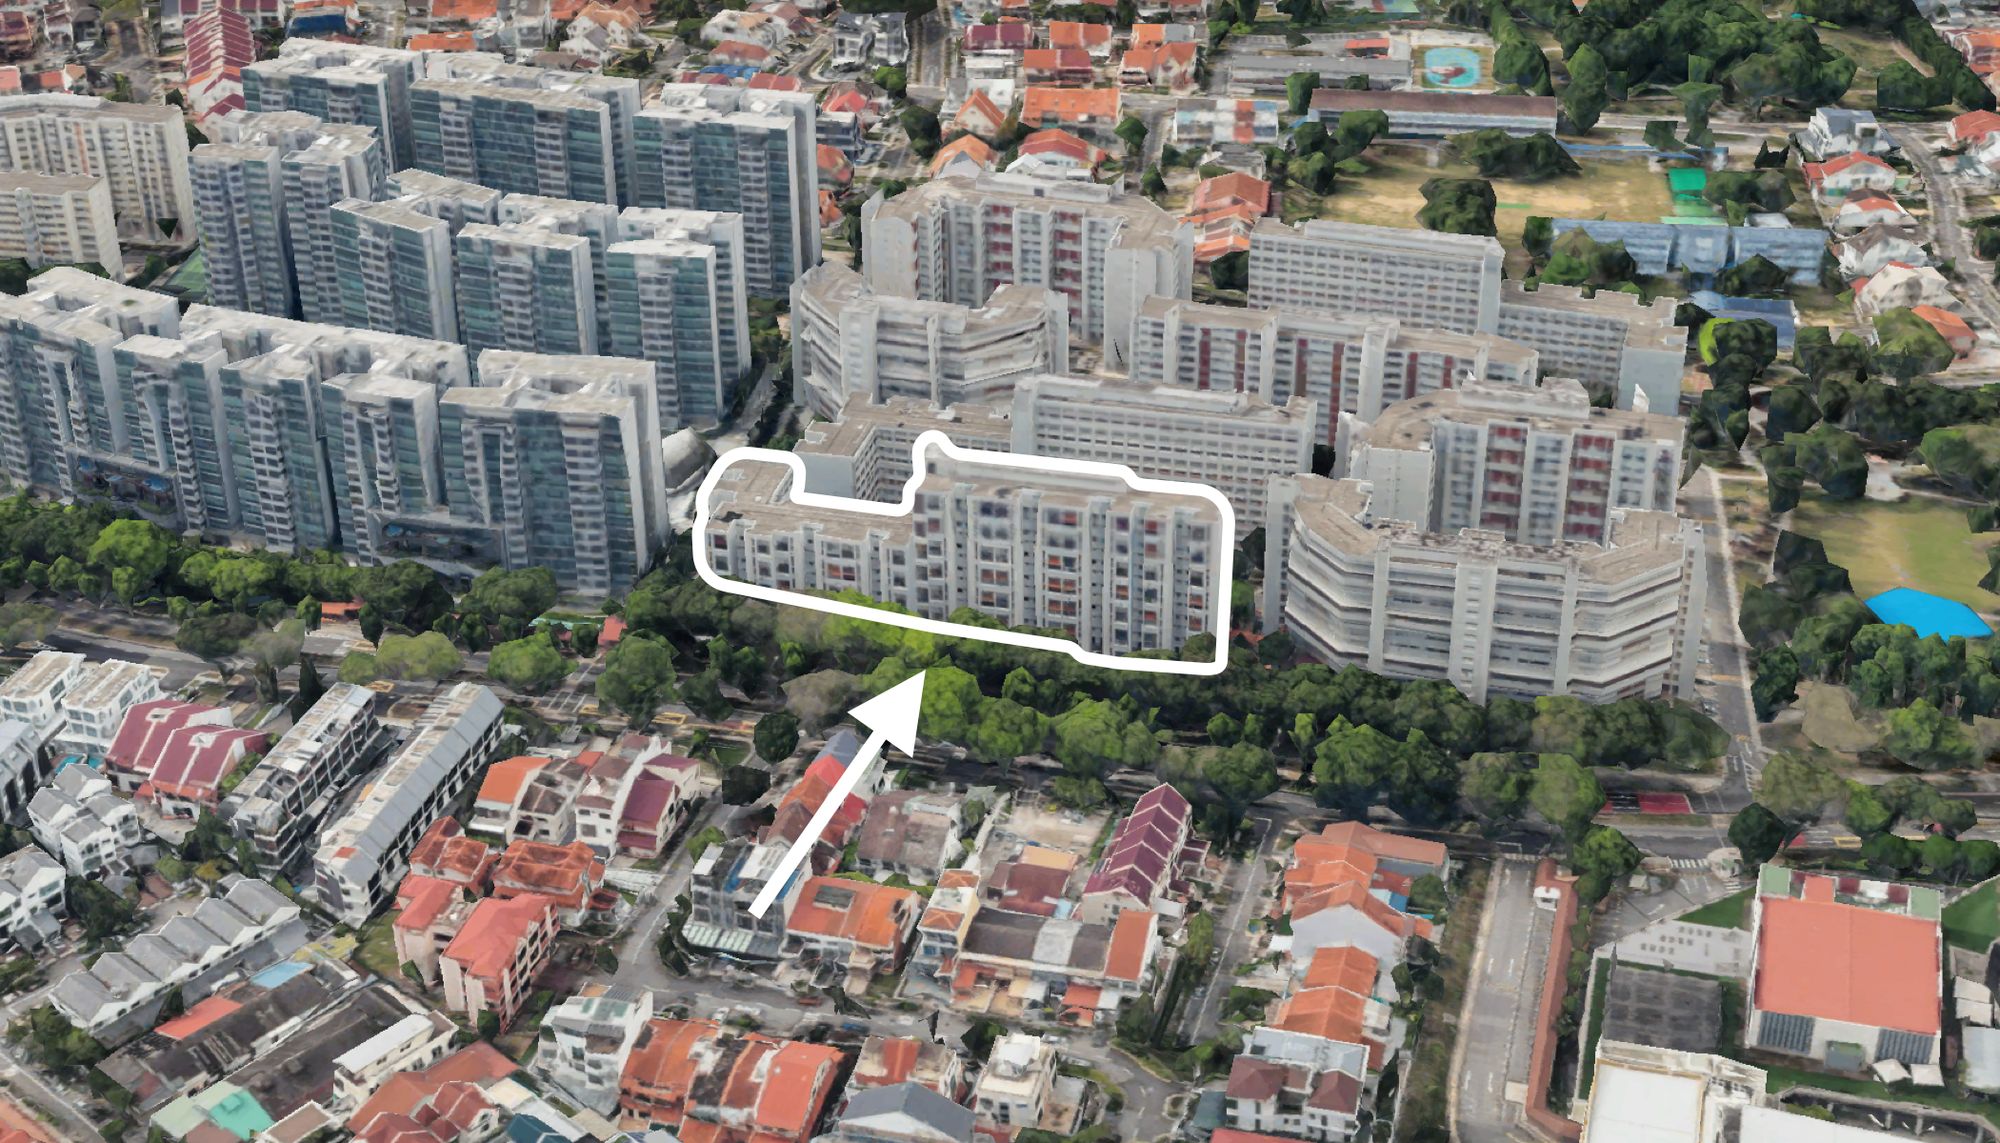
Based on our review, River Modern appears to prioritise functionality and liveability, which may resonate more with own-stay buyers than purely investment-led purchasers. The development’s location is one of its strongest cards. The project sits on one of the last remaining river-facing residential plots along this stretch of the Singapore River.
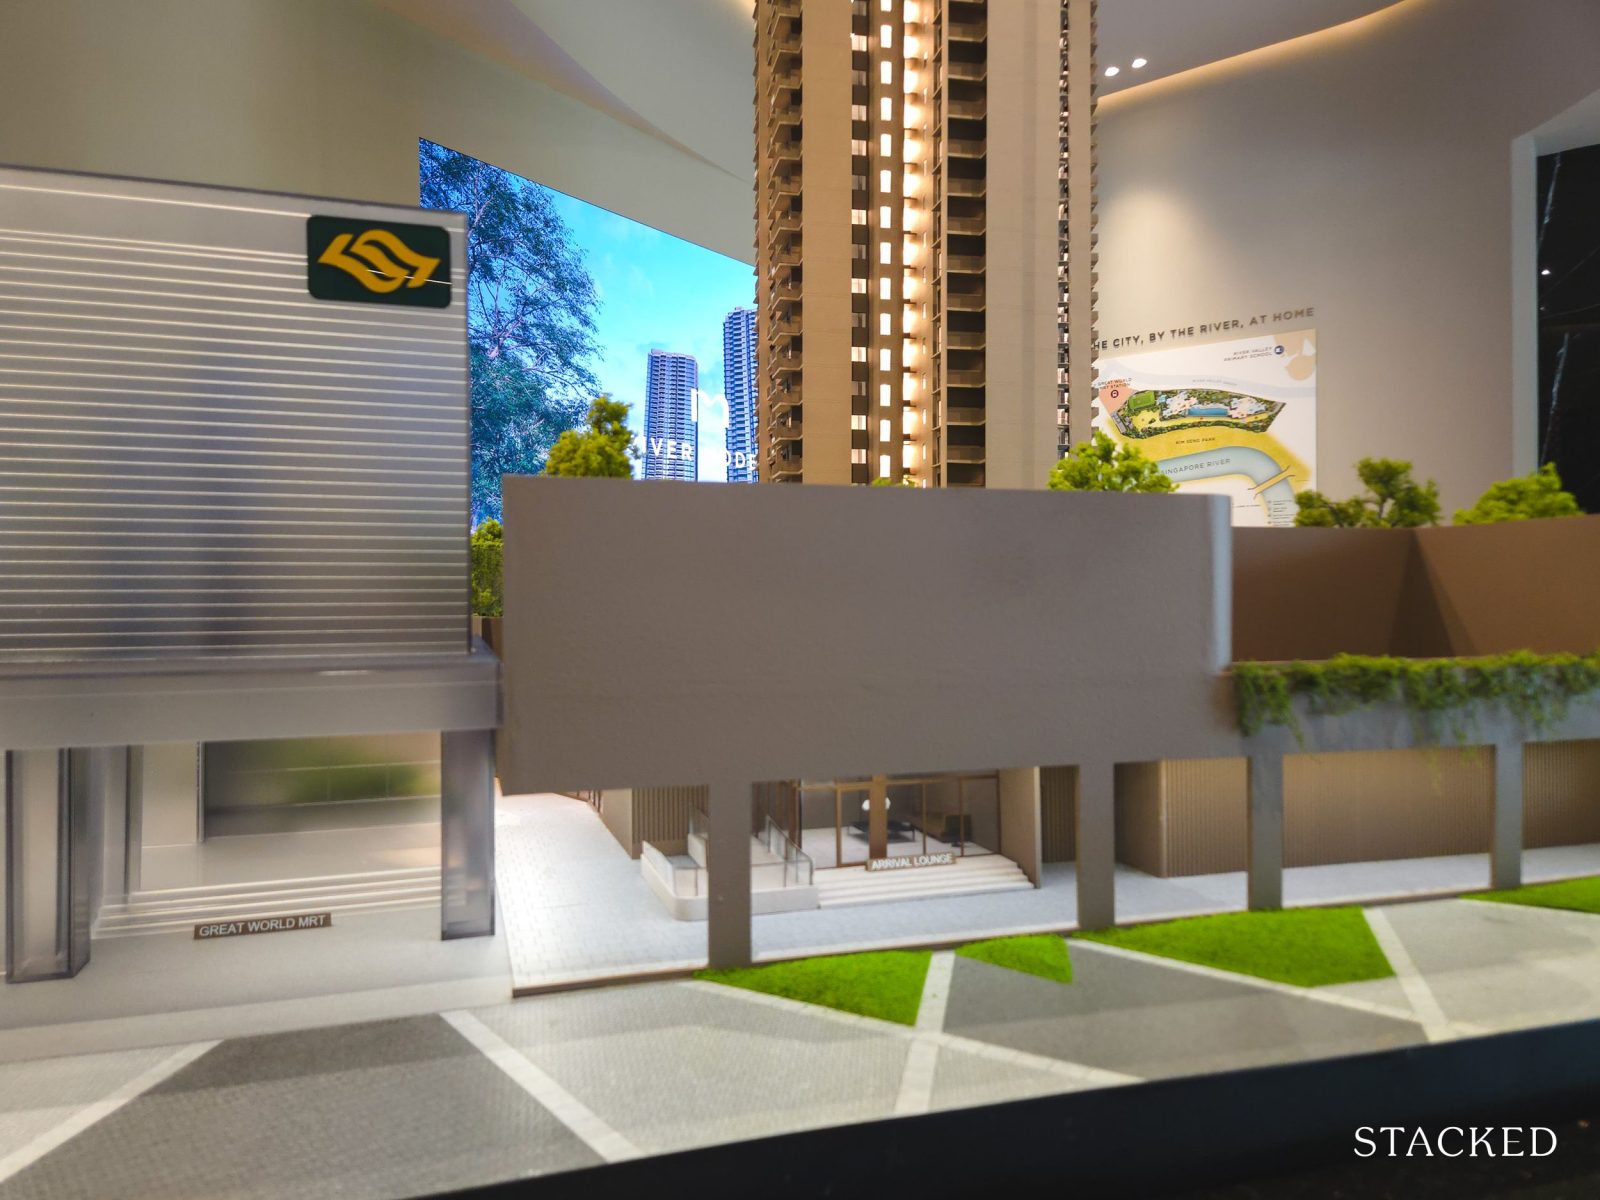
Beyond the views offered by this prime location (which will no doubt form a key selling point), the project benefits from direct access to Great World MRT Station, immediate connectivity to Great World City, and proximity to the established dining and lifestyle scene of Robertson Quay.
The condo is also across the road from River Valley Primary School. This meets a priority that many homeowners consider, namely three fundamental location criteria when choosing a new condo: MRT access, proximity to a reputable primary school, and nearby daily amenities.
River Modern is also the second project in the River Valley area developed by GuocoLand, after it launched the 450-unit Martin Modern nearly a decade ago. Both condos are part of its ‘Modern” series of homes, which also includes Midtown Modern in Bugis and Lentor Modern.
Observant buyers may also recognise a broader pattern where several of GuocoLand’s recent projects sit along the Thomson–East Coast Line (TEL), such as Springleaf Residences next to Springleaf station and Lentor Modern next to Lentor station.
GuocoLand has previously shared its conviction of the appeal of the sites near stations on the TEL, which fit many of the attributes that homeowners prioritise, as well as the overall growth trajectory of the neighbourhoods along this MRT line.
The appeal of the River Valley/Robertson Quay locale would be familiar to most local homeowners. The area’s central location, strong access to many amenities, and a distinct riverfront lifestyle continue to resonate among buyers who value the area’s convenience and character.
As a result, River Modern checks many of the right boxes that homeowners desire: a compelling location, practical unit layouts, thoughtful design, and the increasingly rare bonus of river-facing views.
This brings us to its selling price. For context, the 126,325 sq ft, 99-year leasehold site was acquired at approximately $1,420 psf per plot ratio (ppr), or $627.84 million, last February in a government land tender.
As a point of comparison, a Government Land Sale (GLS) site at Tanjong Rhu in the CCR was awarded to a CDL-Woh Hup joint venture, which submitted a winning bid of $1,455 psf ppr ($709.3 million) this month.
This indication of the direction land prices are moving towards may significantly shape how some buyers consider the relative value between new and upcoming projects in the CCR and RCR.
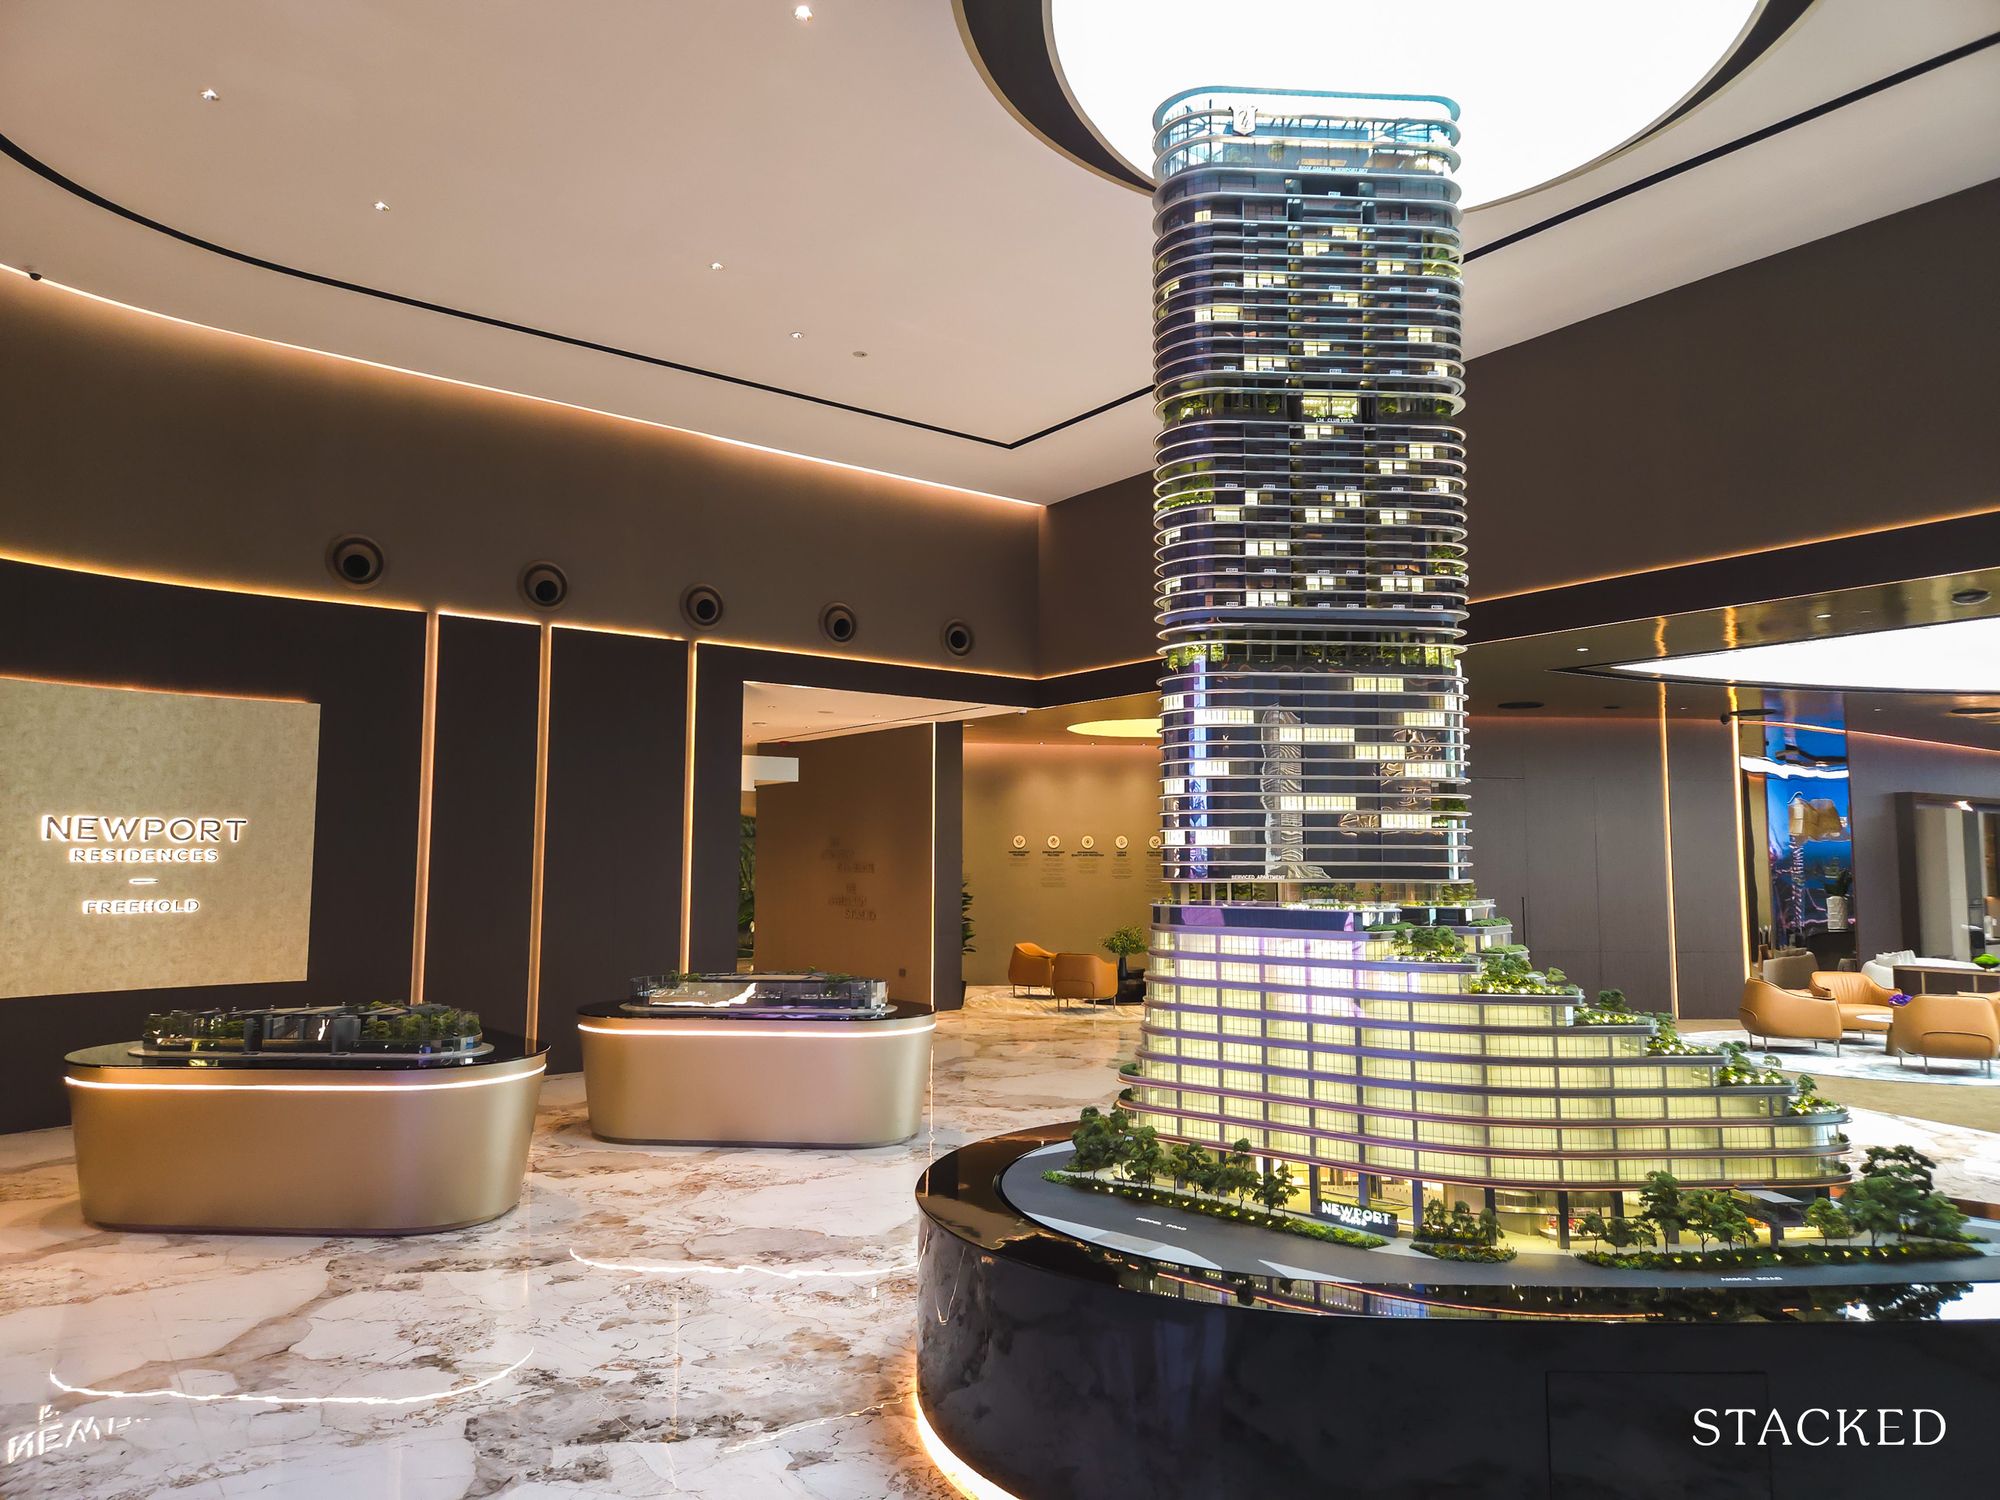
Recent market reports also suggest that buying demand in the CCR has not dissipated. The sales launch of Newport Residences, a luxury project on Anson Road and the first CCR launch this year, recorded a take-up rate of about 57% during its launch weekend at an average price of $3,370 psf.
Against this backdrop, River Modern’s indicative starting prices are:
- $1.548 million ($2,877 psf) for a 538 sq ft, two-bedroom unit
- $2.298 million ($2,883 psf) for a 797 sq ft, three-bedroom unit
- $4.588 million ( $3,134 psf) for a 1,464 sq ft, four-bedroom unit
With that in mind, let’s take a closer look at what River Modern brings to the (growing) slate of projects in this area, and how it stacks against its neighbours.
A Unique Lifestyle Pegged Along the River
This stretch of the Singapore River, where River Modern is situated, is at the tail end of the commerce that built Singapore’s economic foundation during its early colonial days.
Long before the cafés and riverfront residences that pepper the riverfront, prominent parts upriver, like Robertson Quay, Clarke Quay, and Boat Quay, were lined with warehouses and godowns, supporting the trading activity that once powered Singapore’s early economy.
Back then, owning property here wasn’t much about lifestyle or views, but rather it was about being close to commerce.
Over time, these precincts evolved, and warehouses gave way to homes and restaurants as the riverfront slowly transformed into the upscale residential and lifestyle corridor we recognise today.
For example, the Robertson Quay area is characterised by its selection of freehold condos and premium property prices. Over time, the area’s character has attracted a tight-knit expatriate community and shaped it into a fairly established lifestyle enclave.
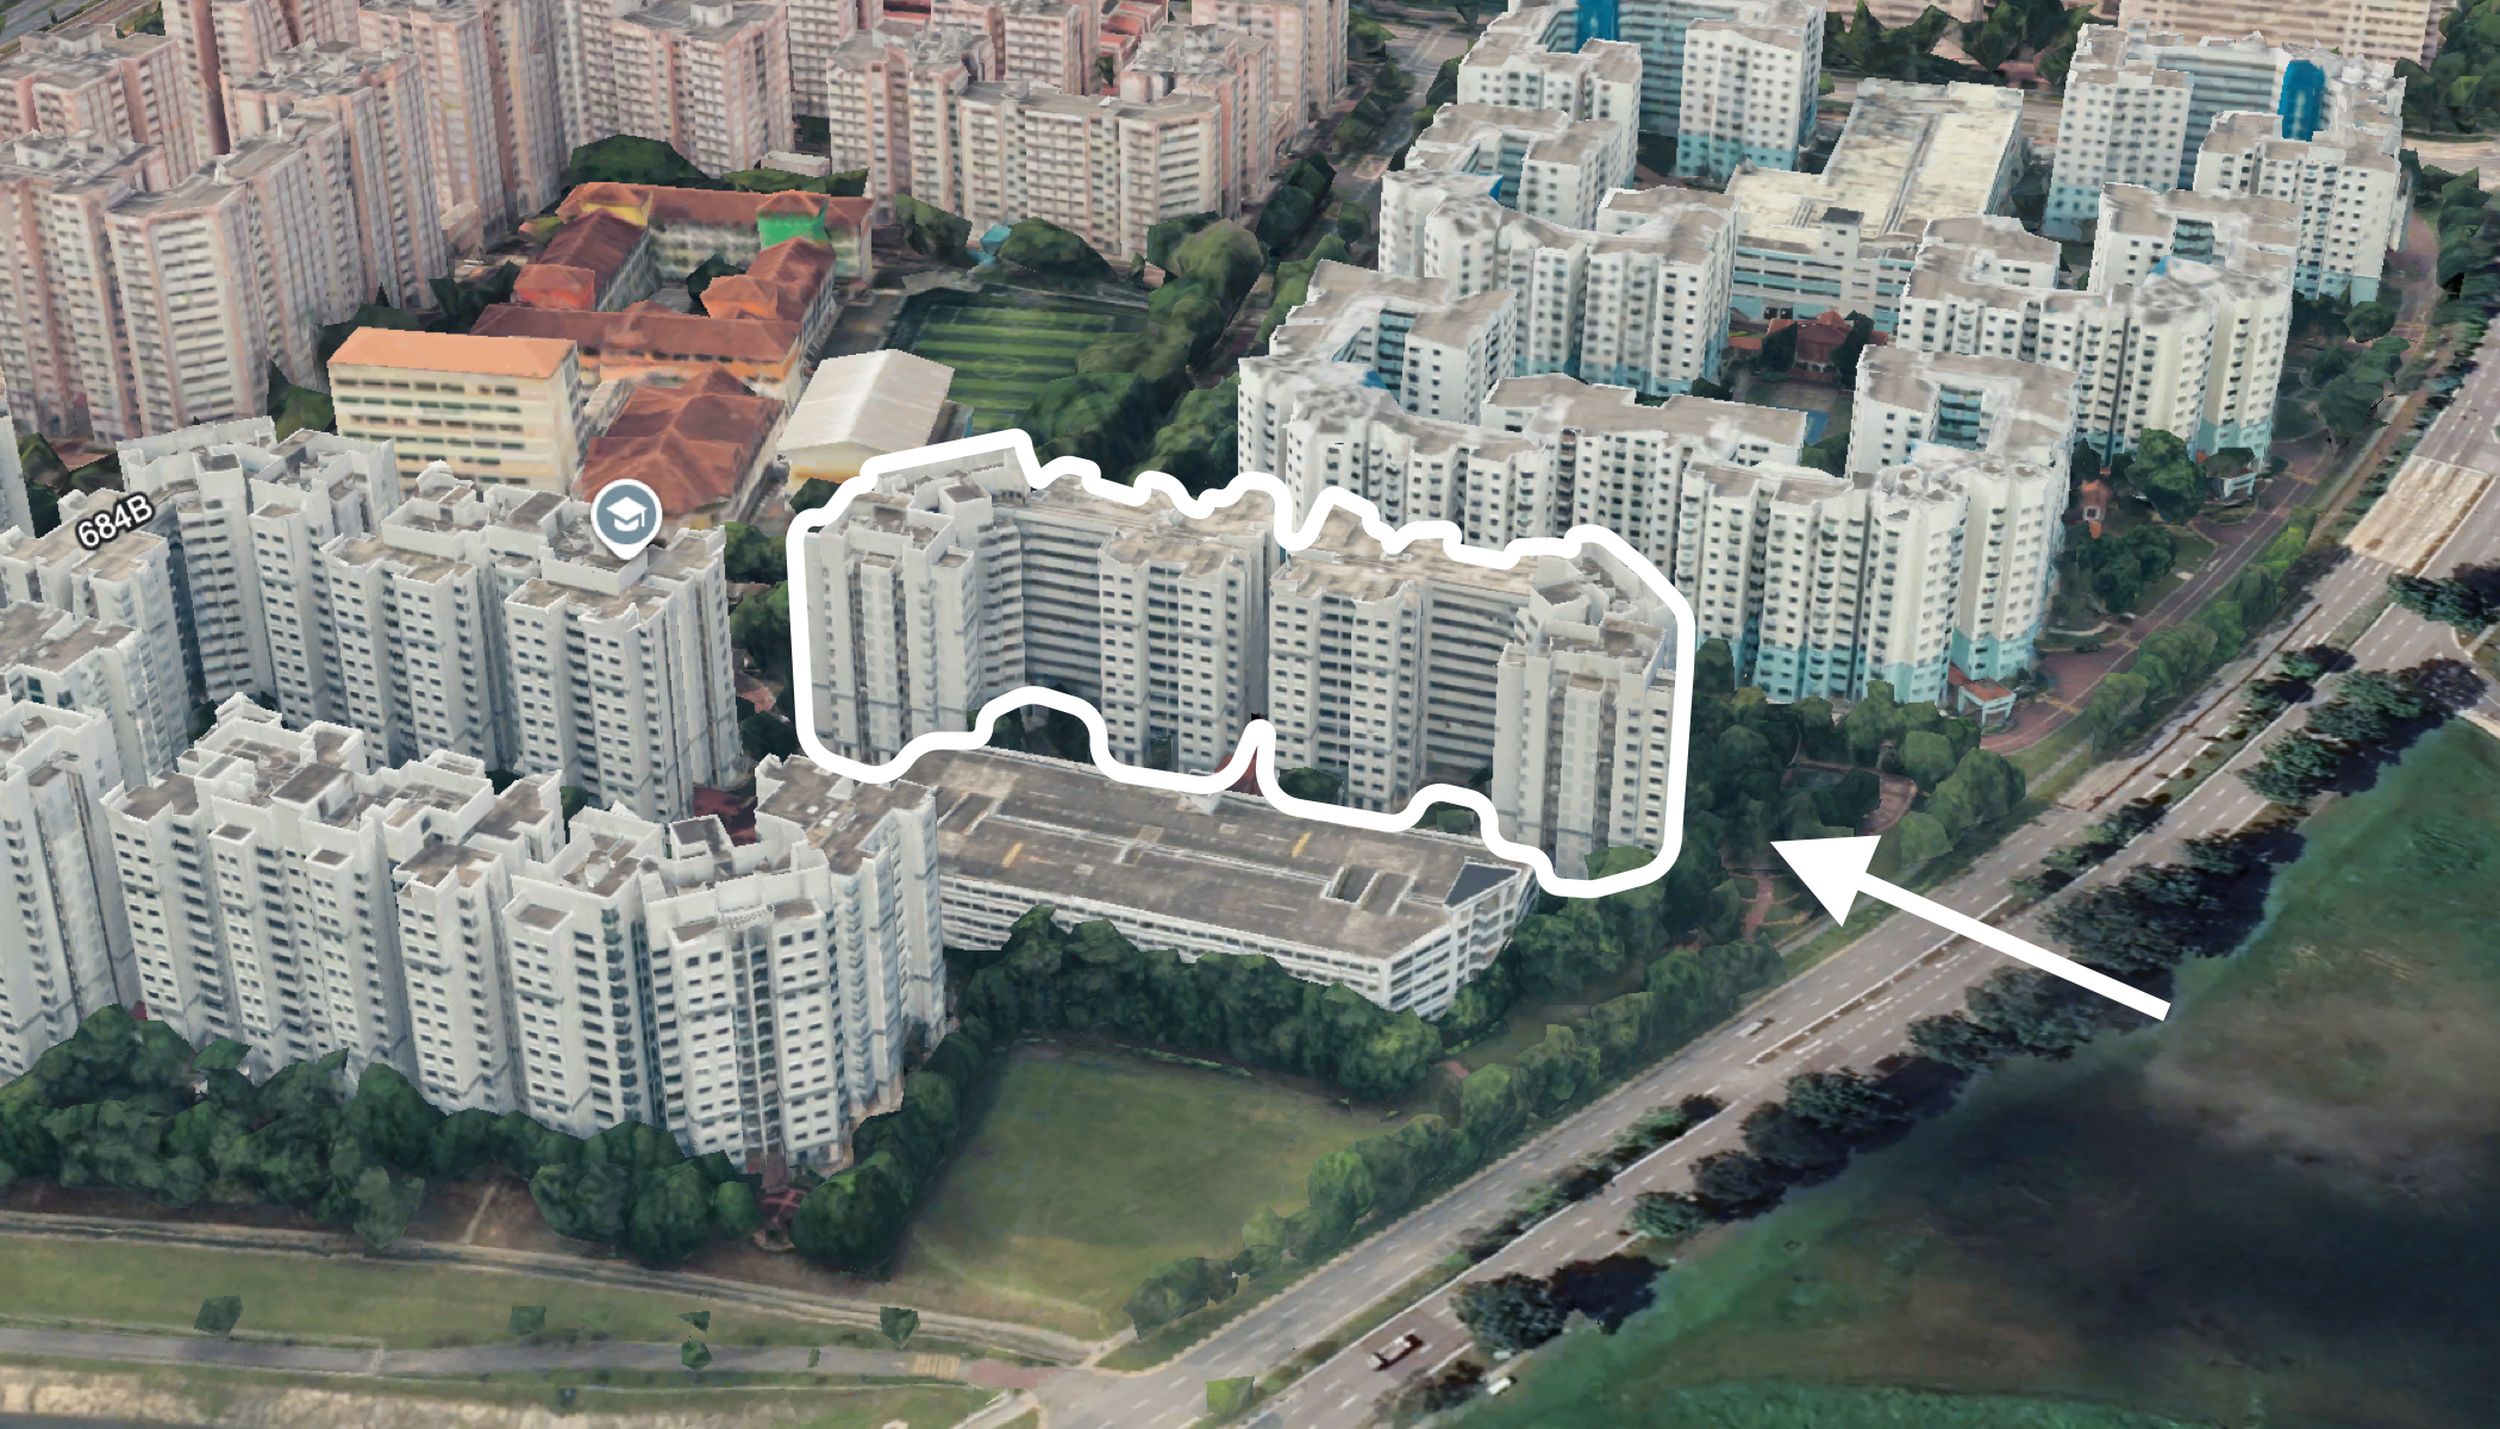
With most of the riverfront sites already developed, and the prospect of future enblocs much less realistic, River Modern sits on one of the last riverfront residential sites in the area. And that’s really the key point: there simply aren’t many of these left.
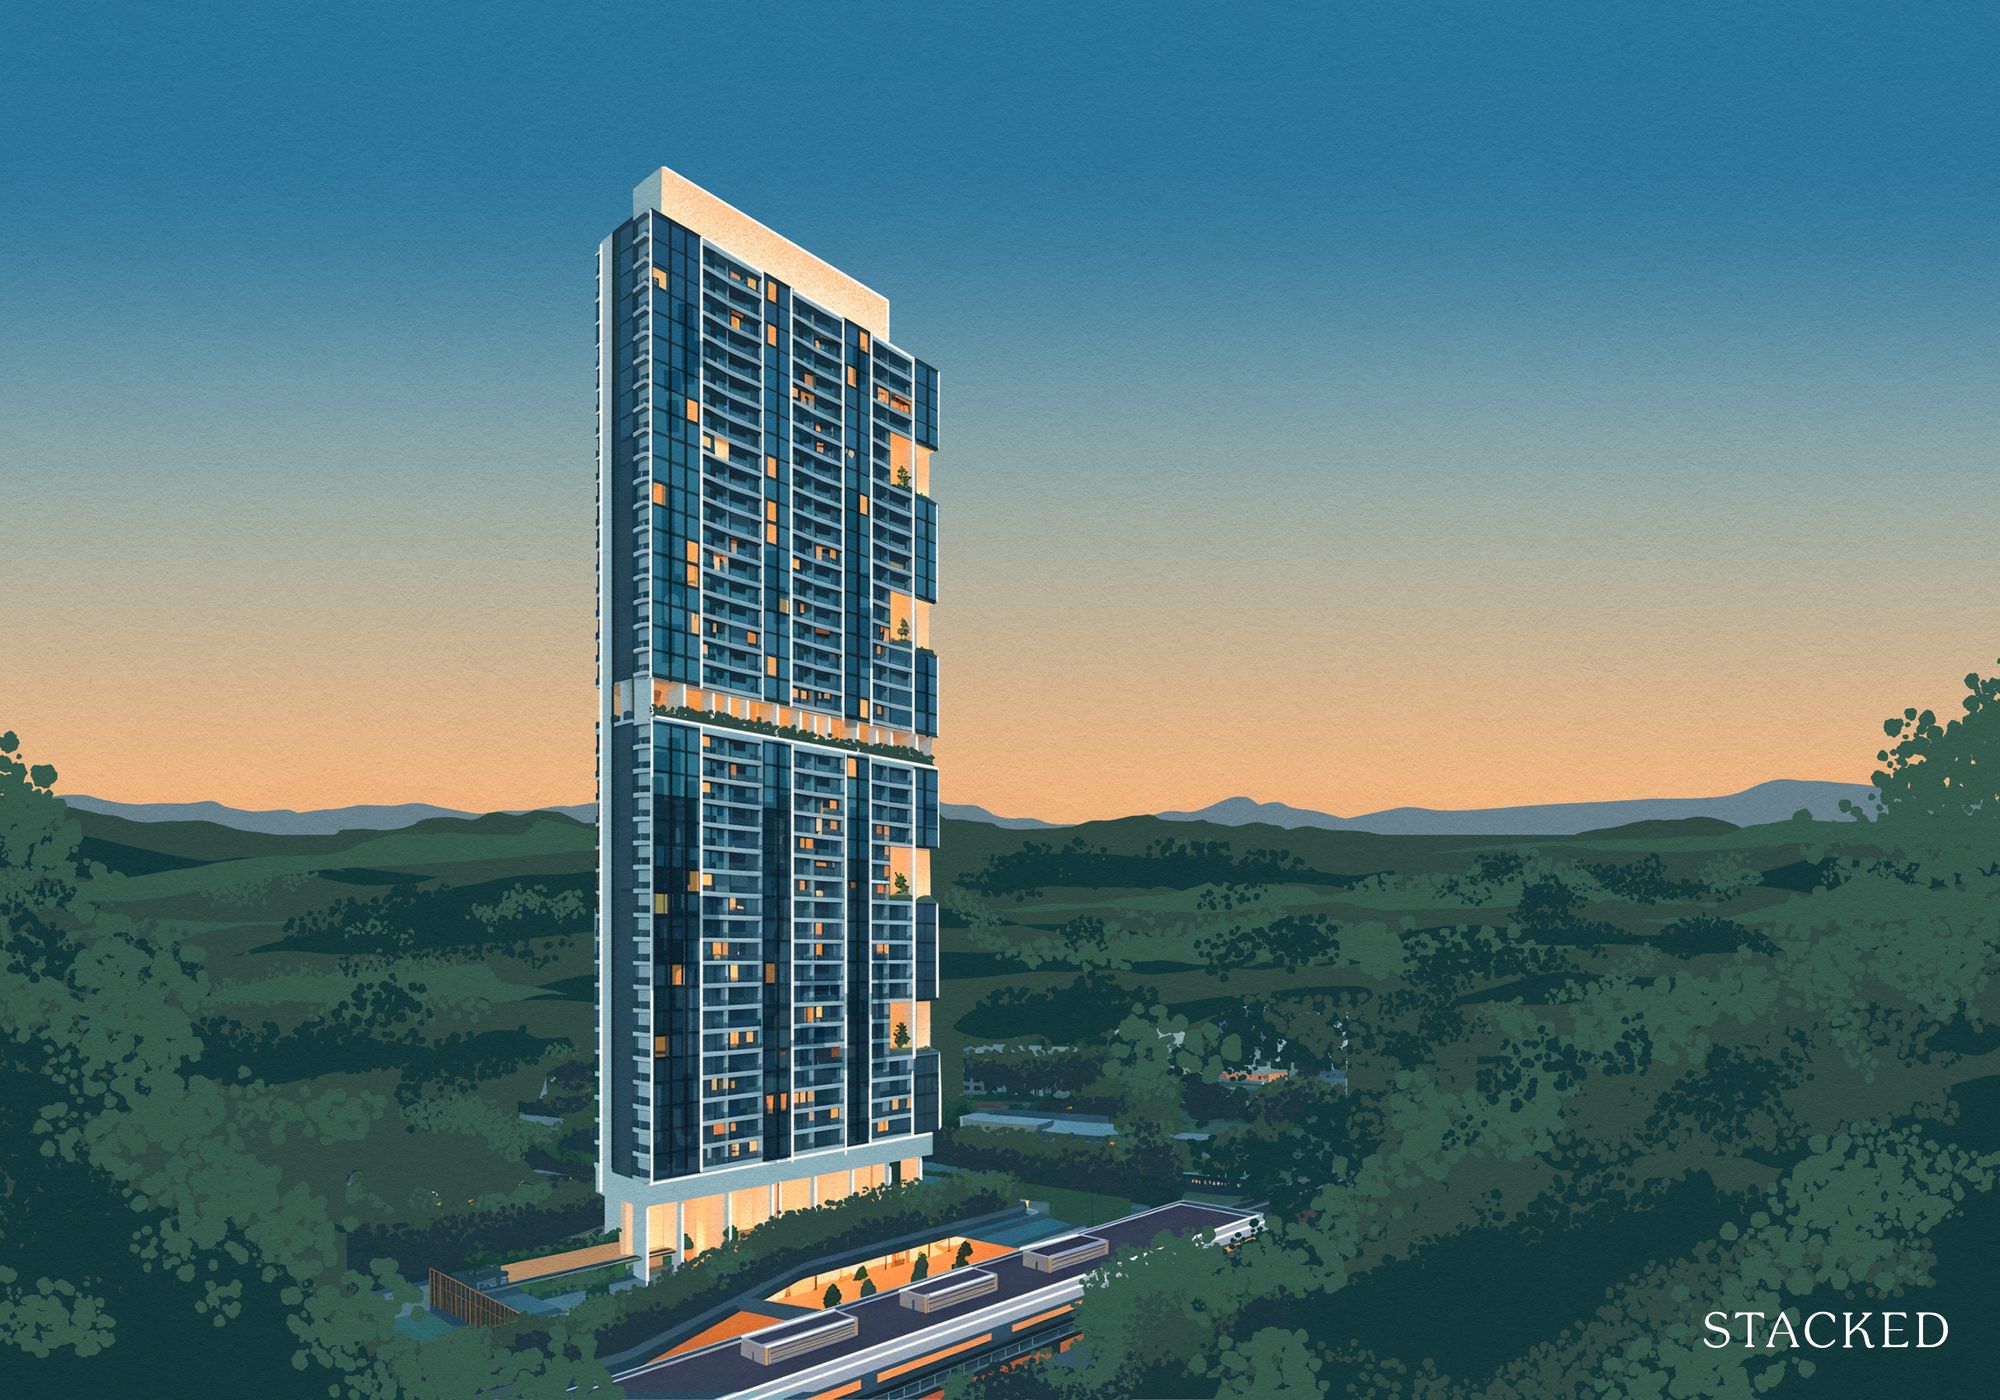
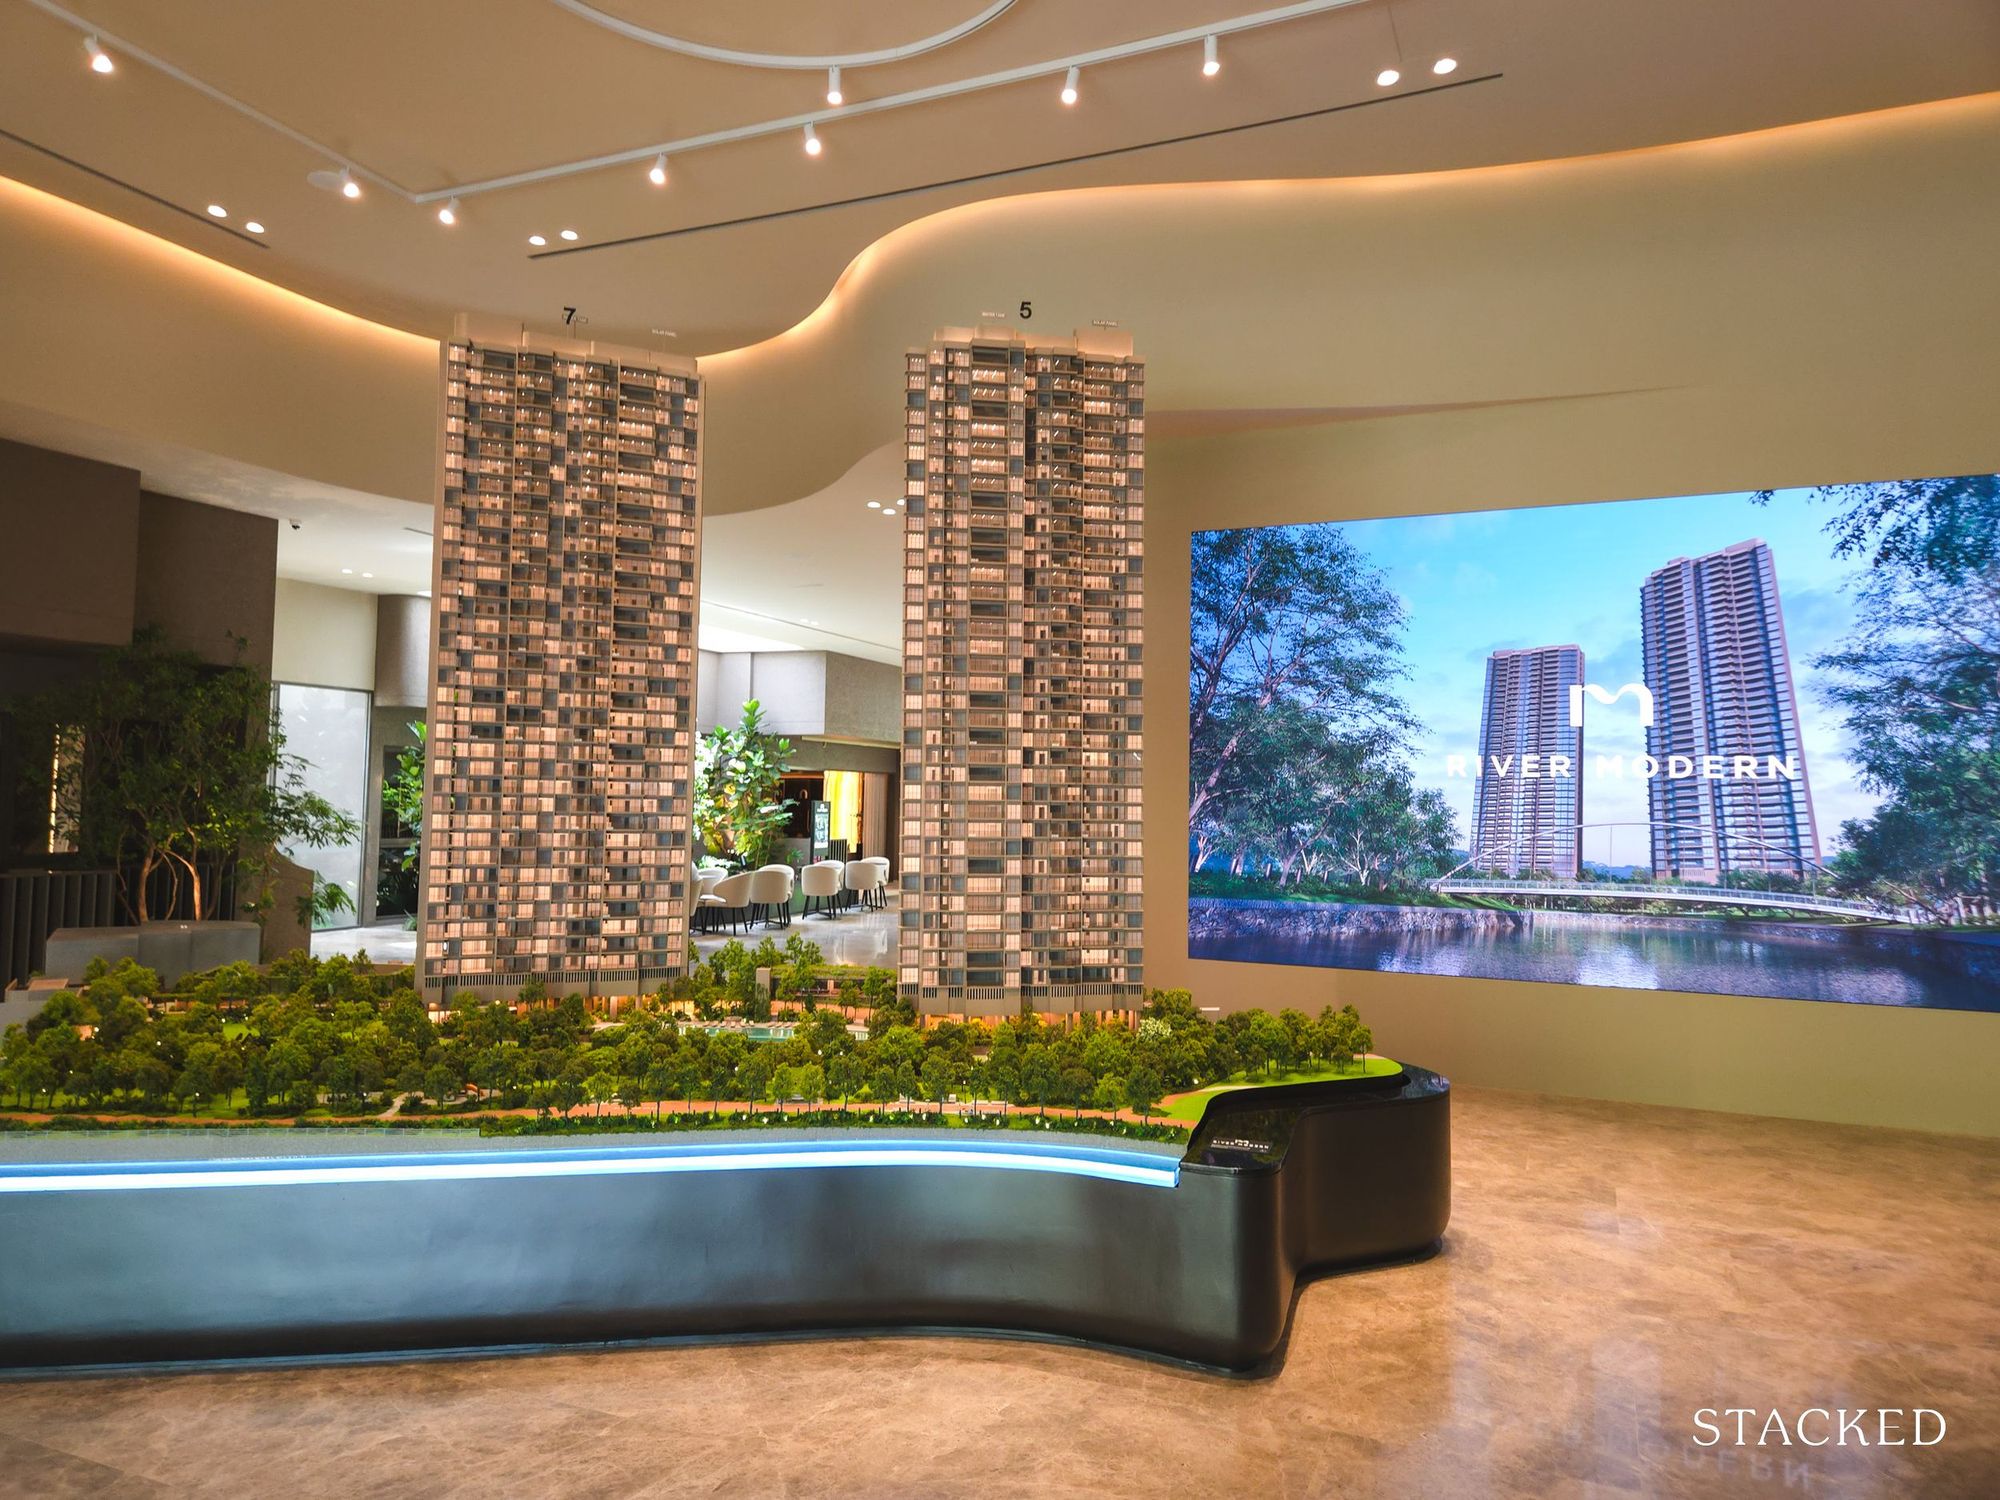
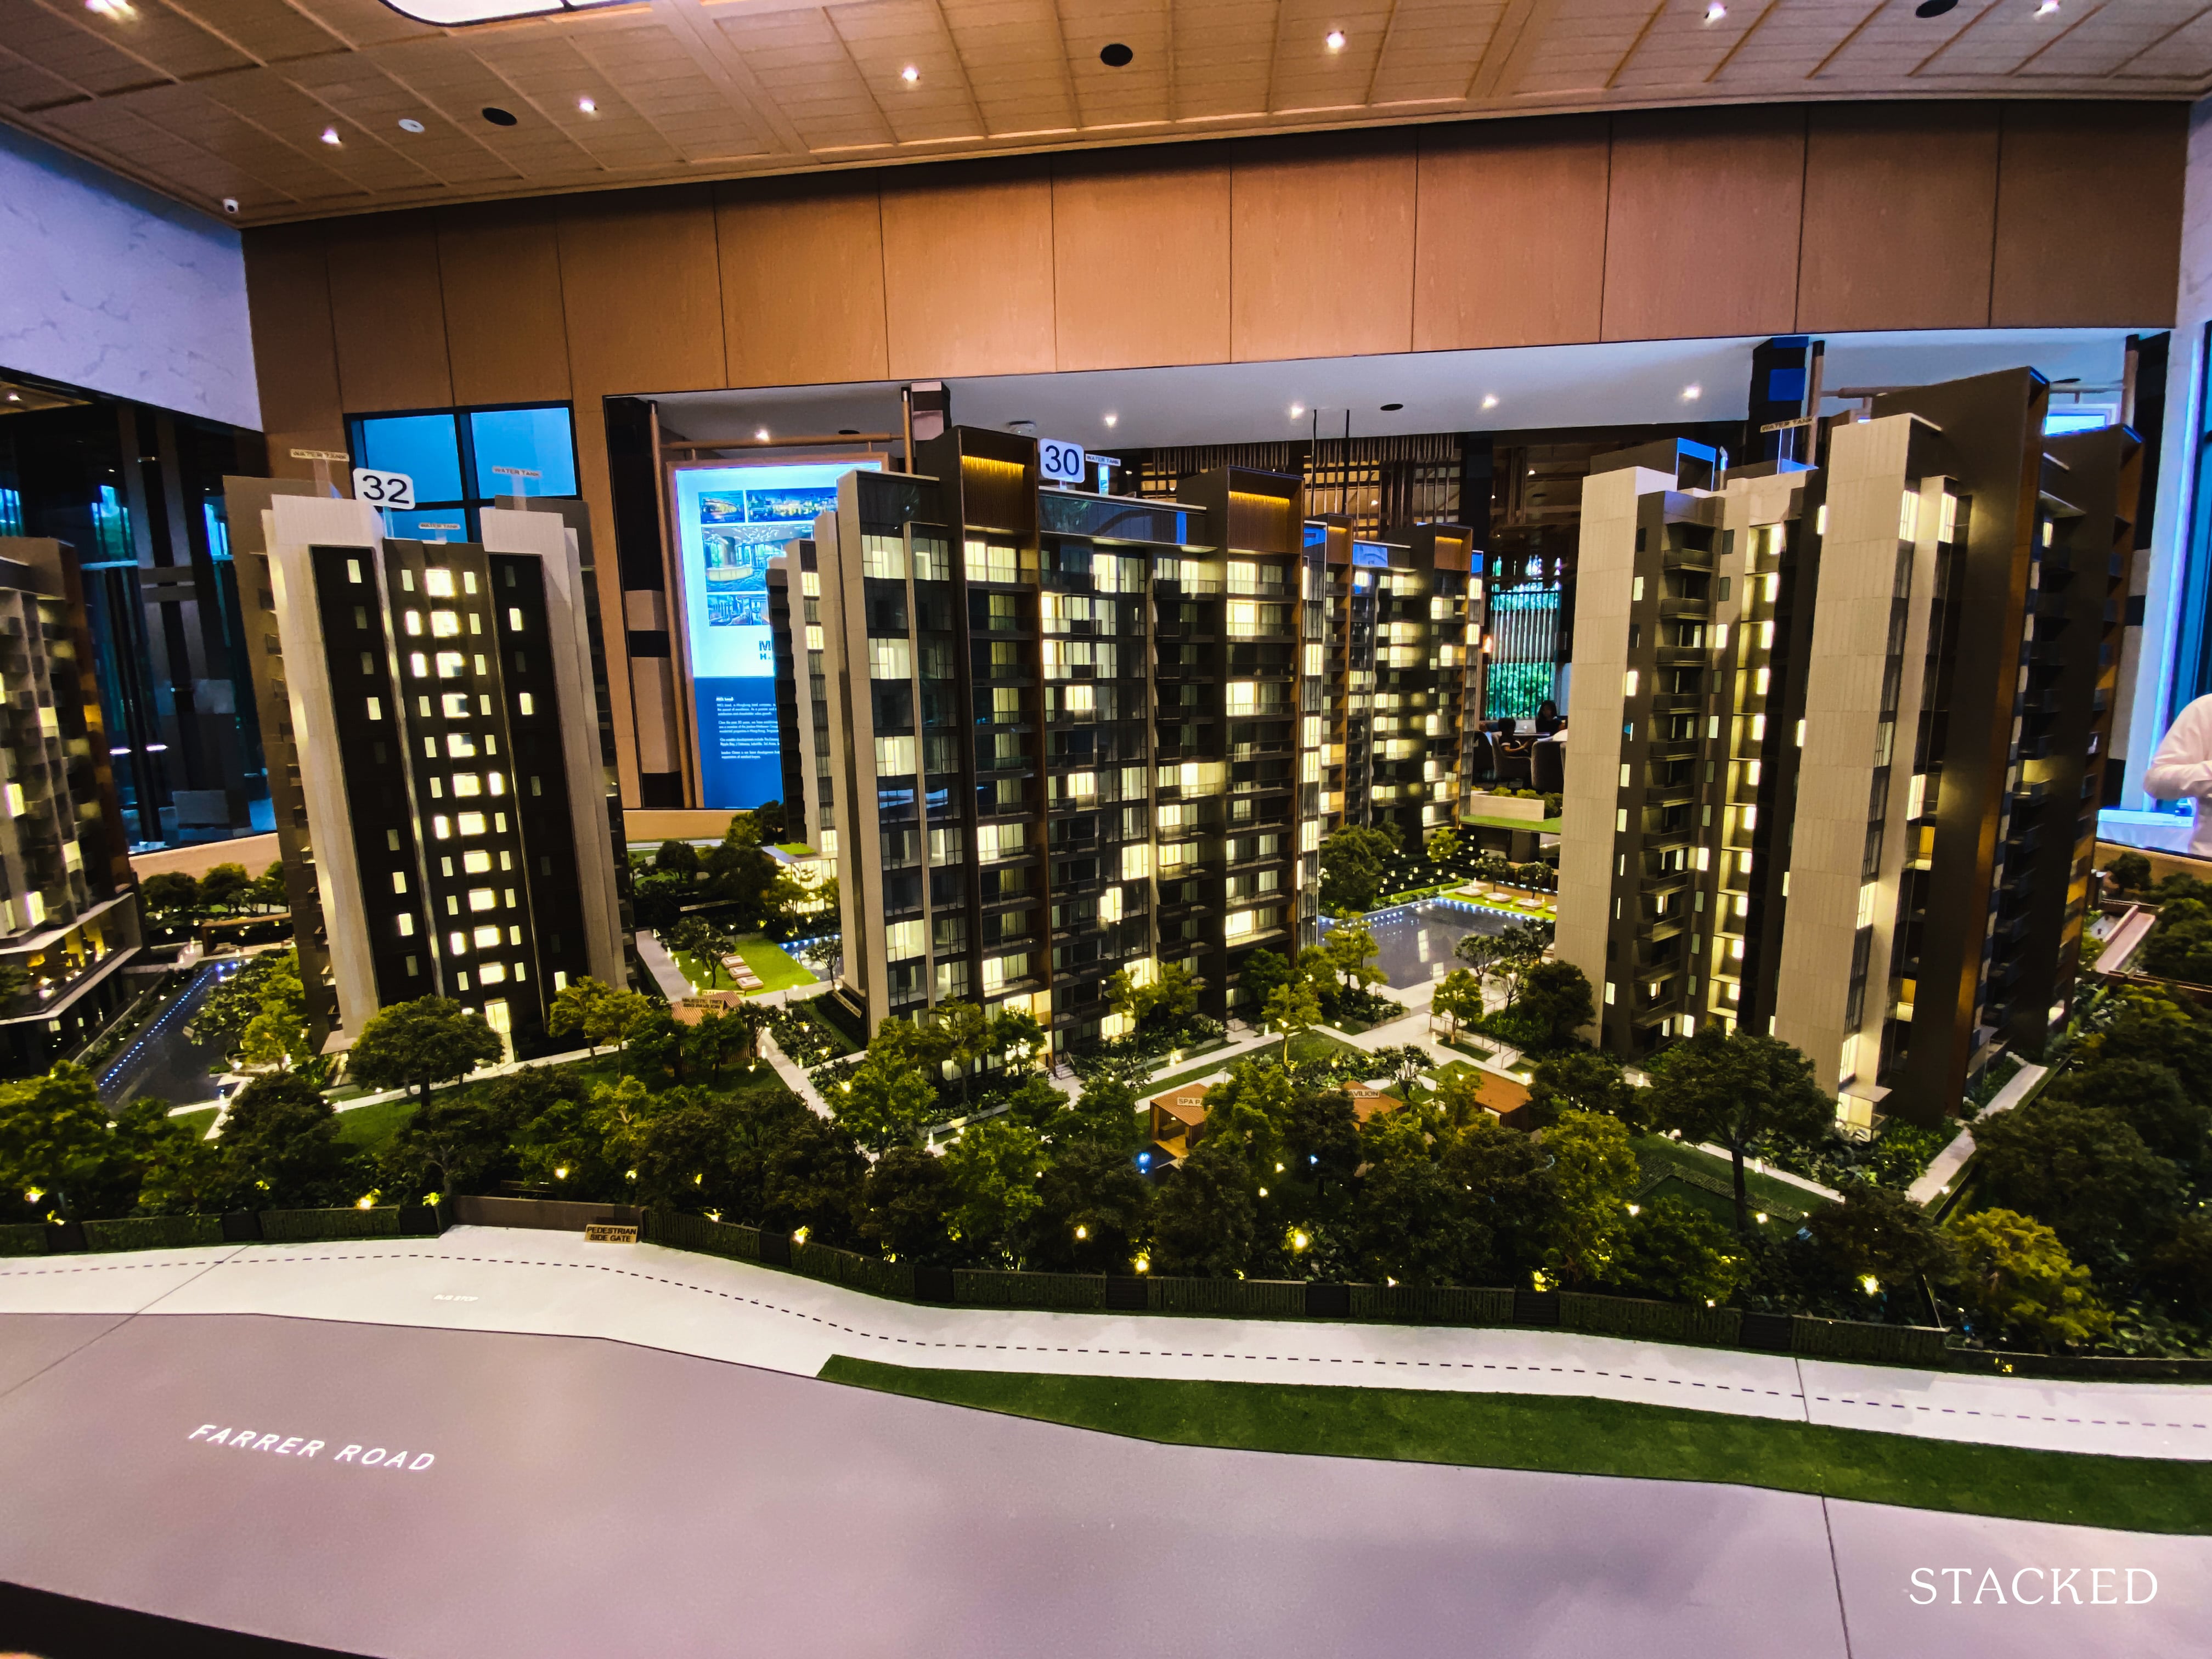
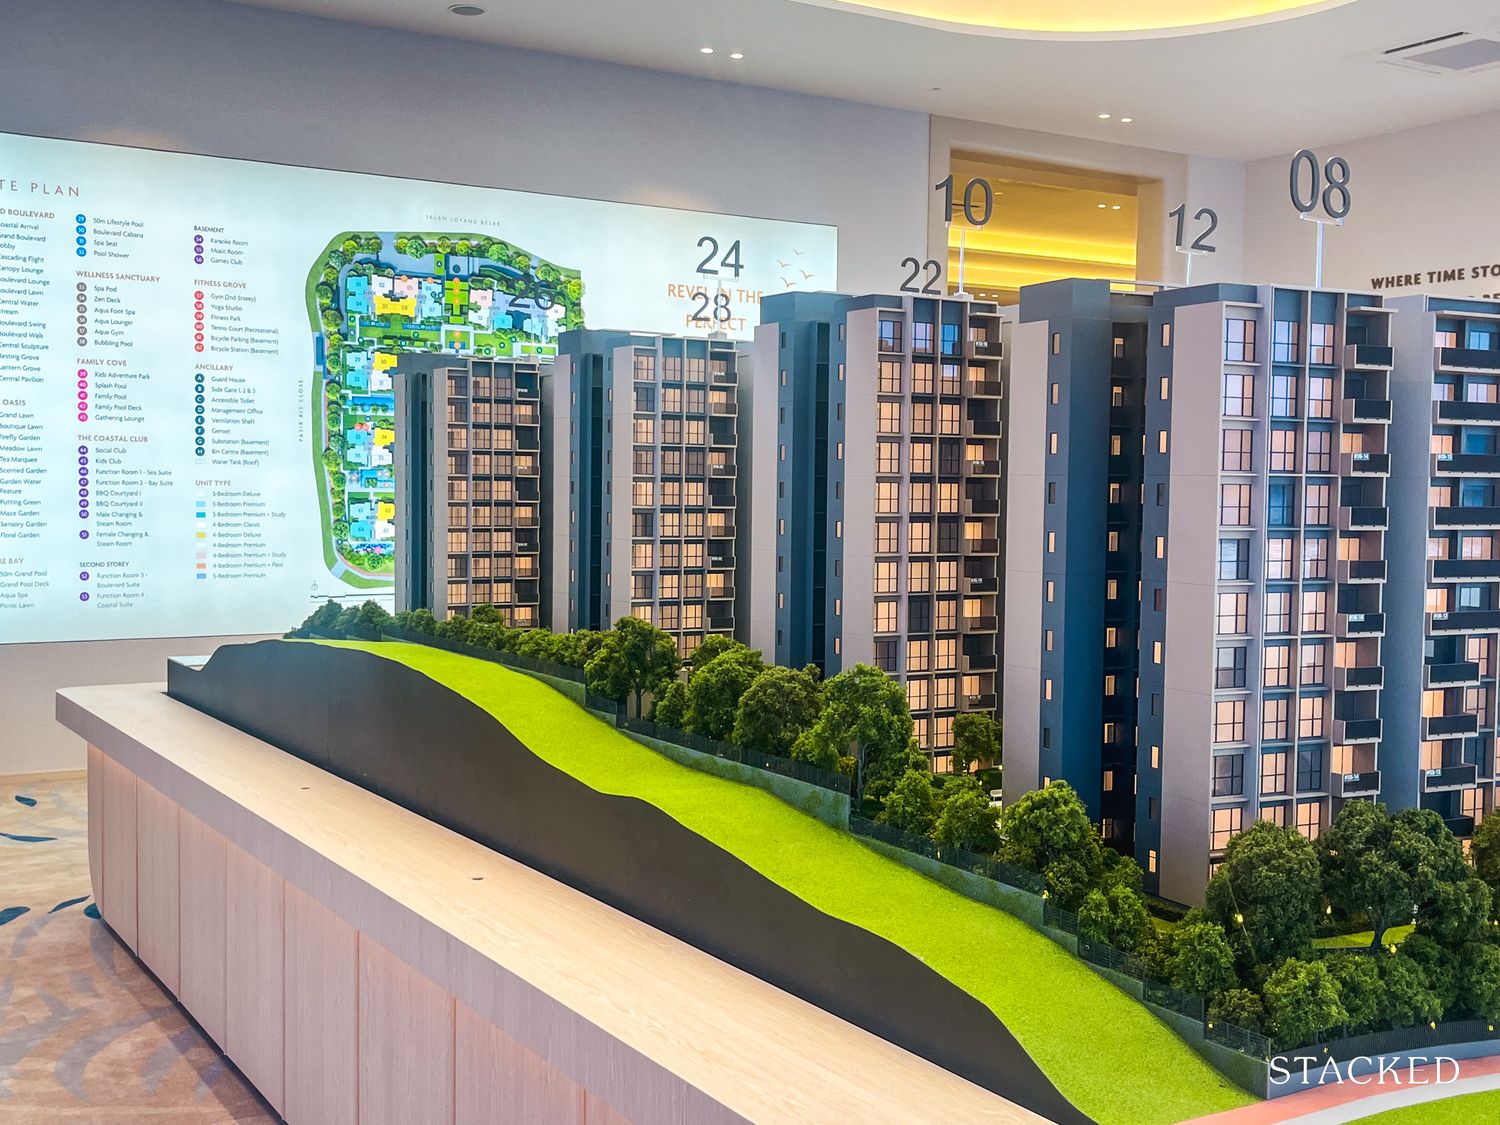
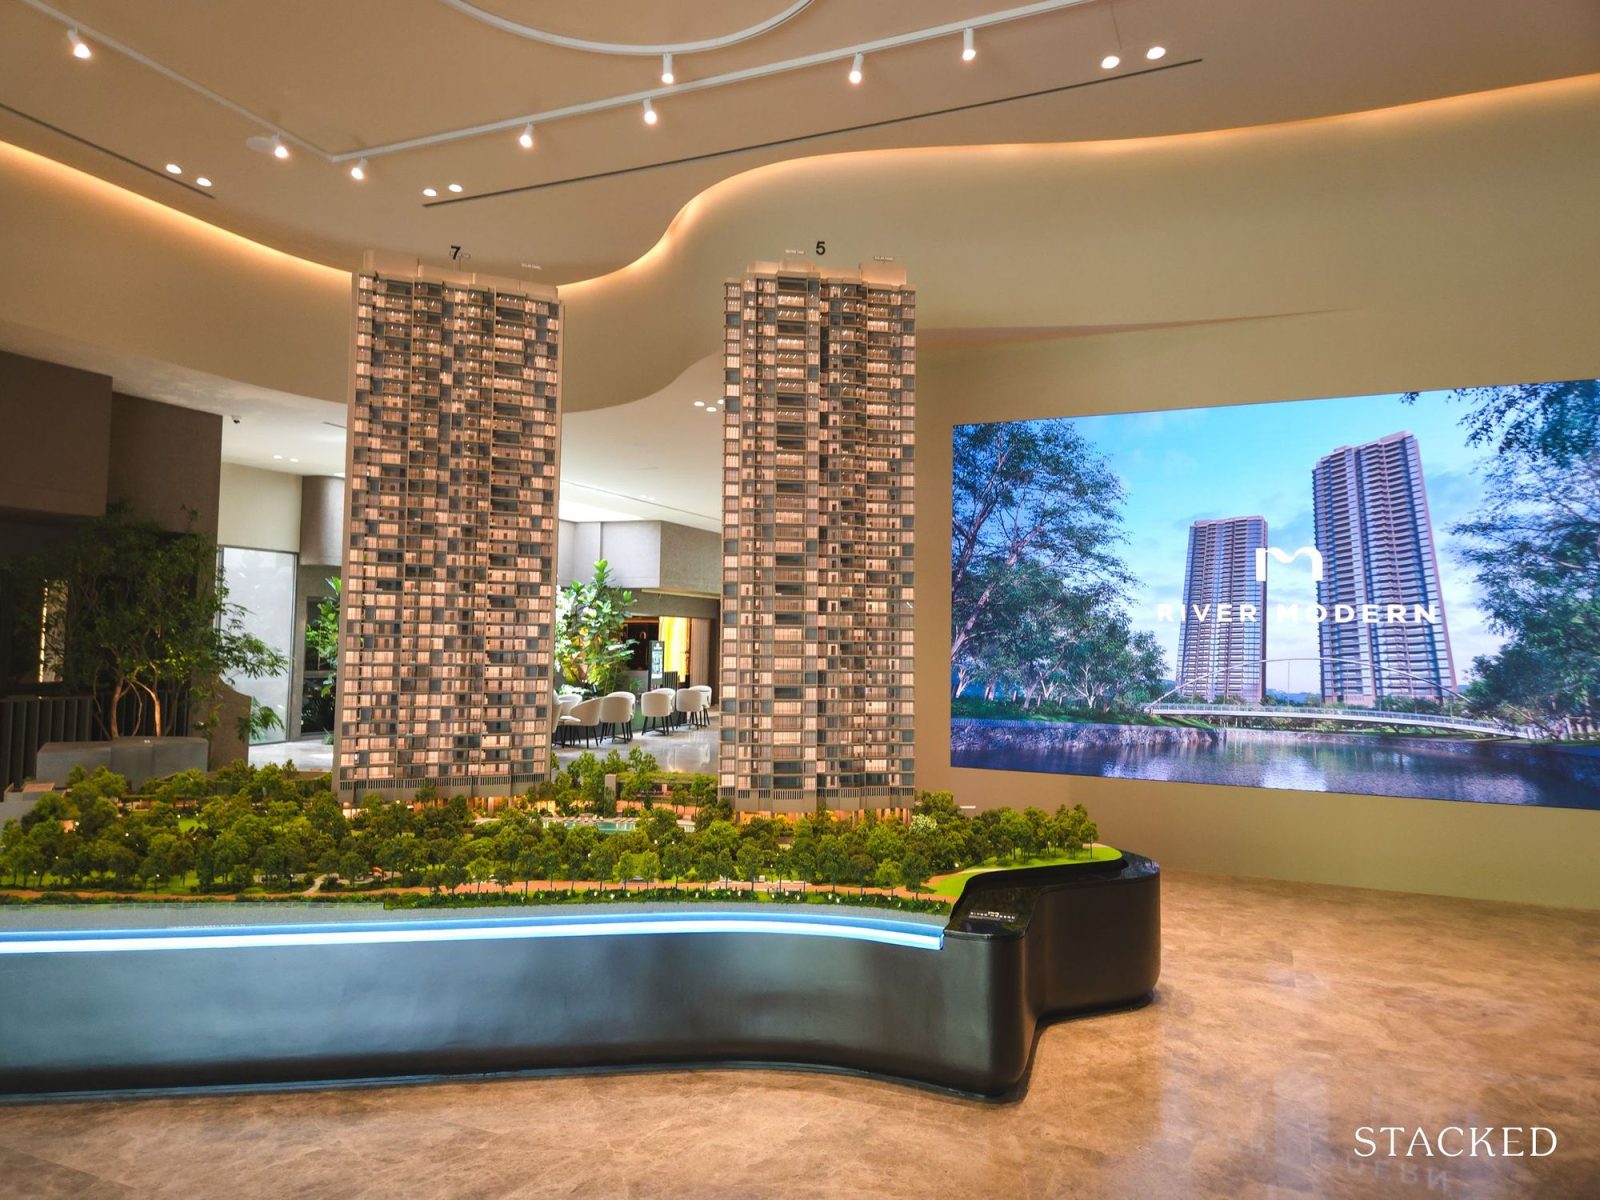
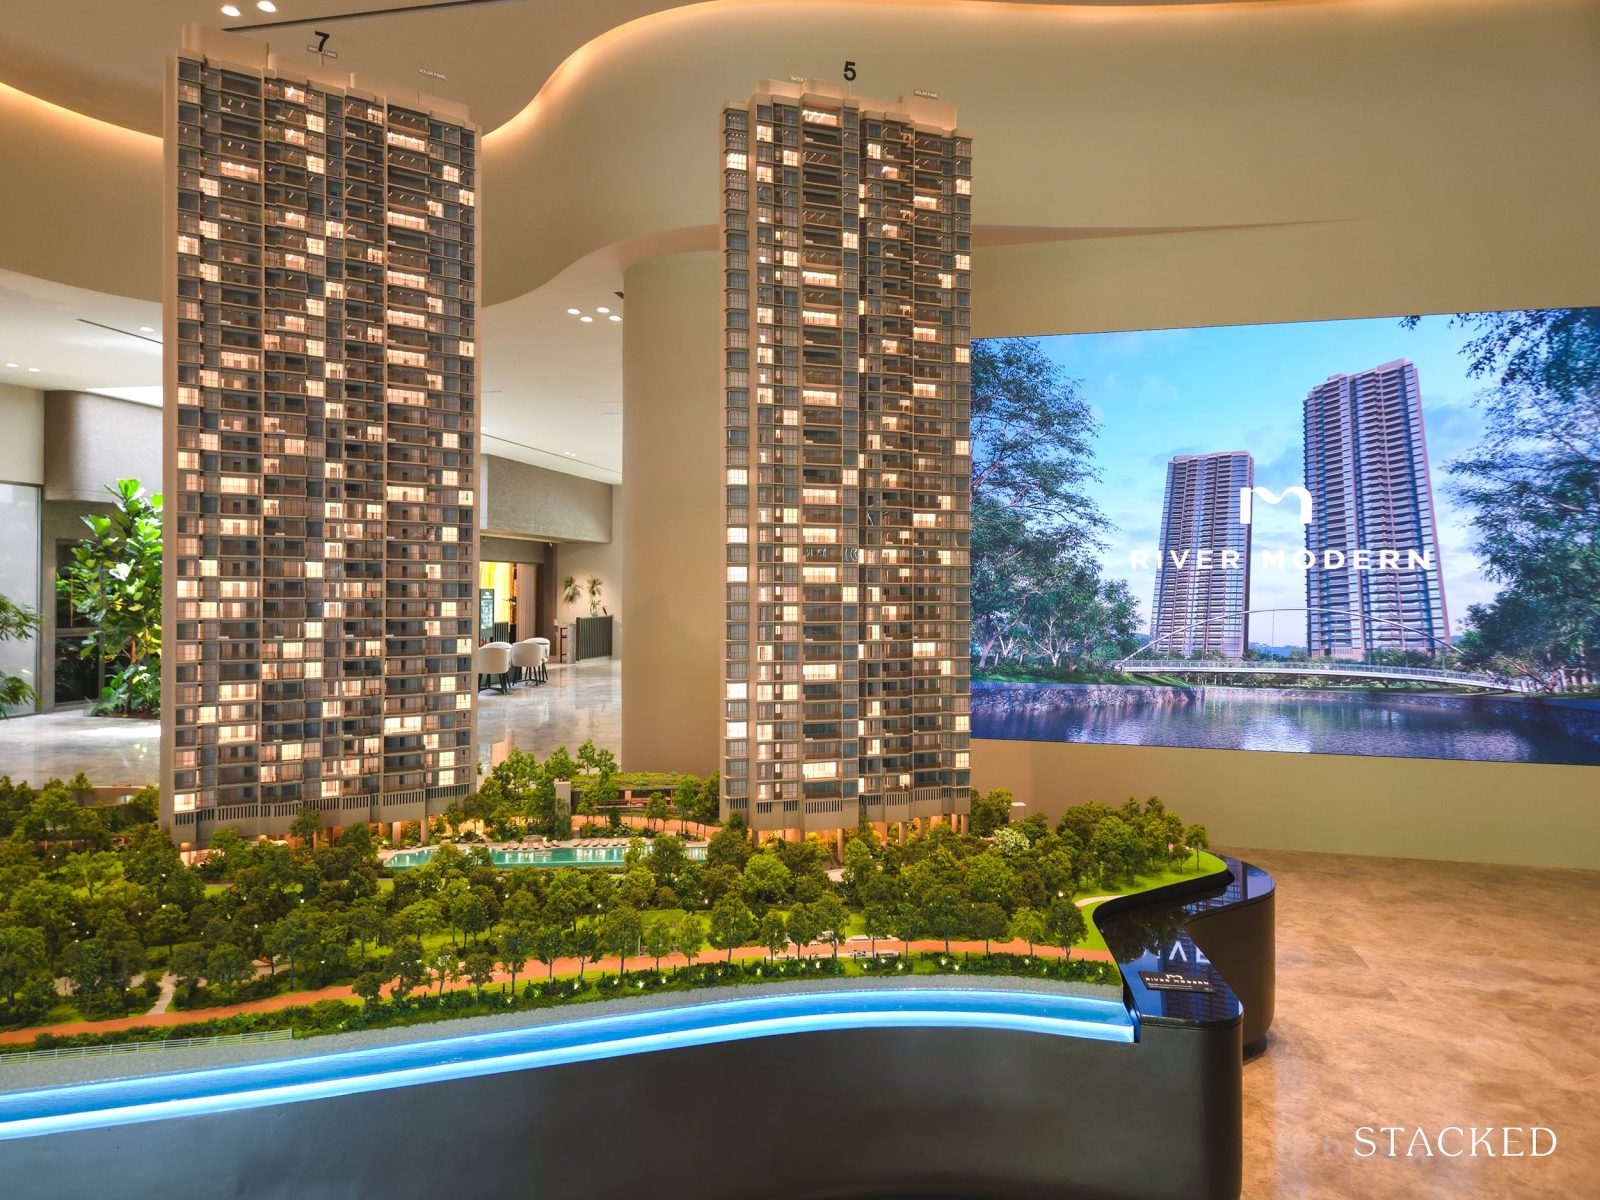
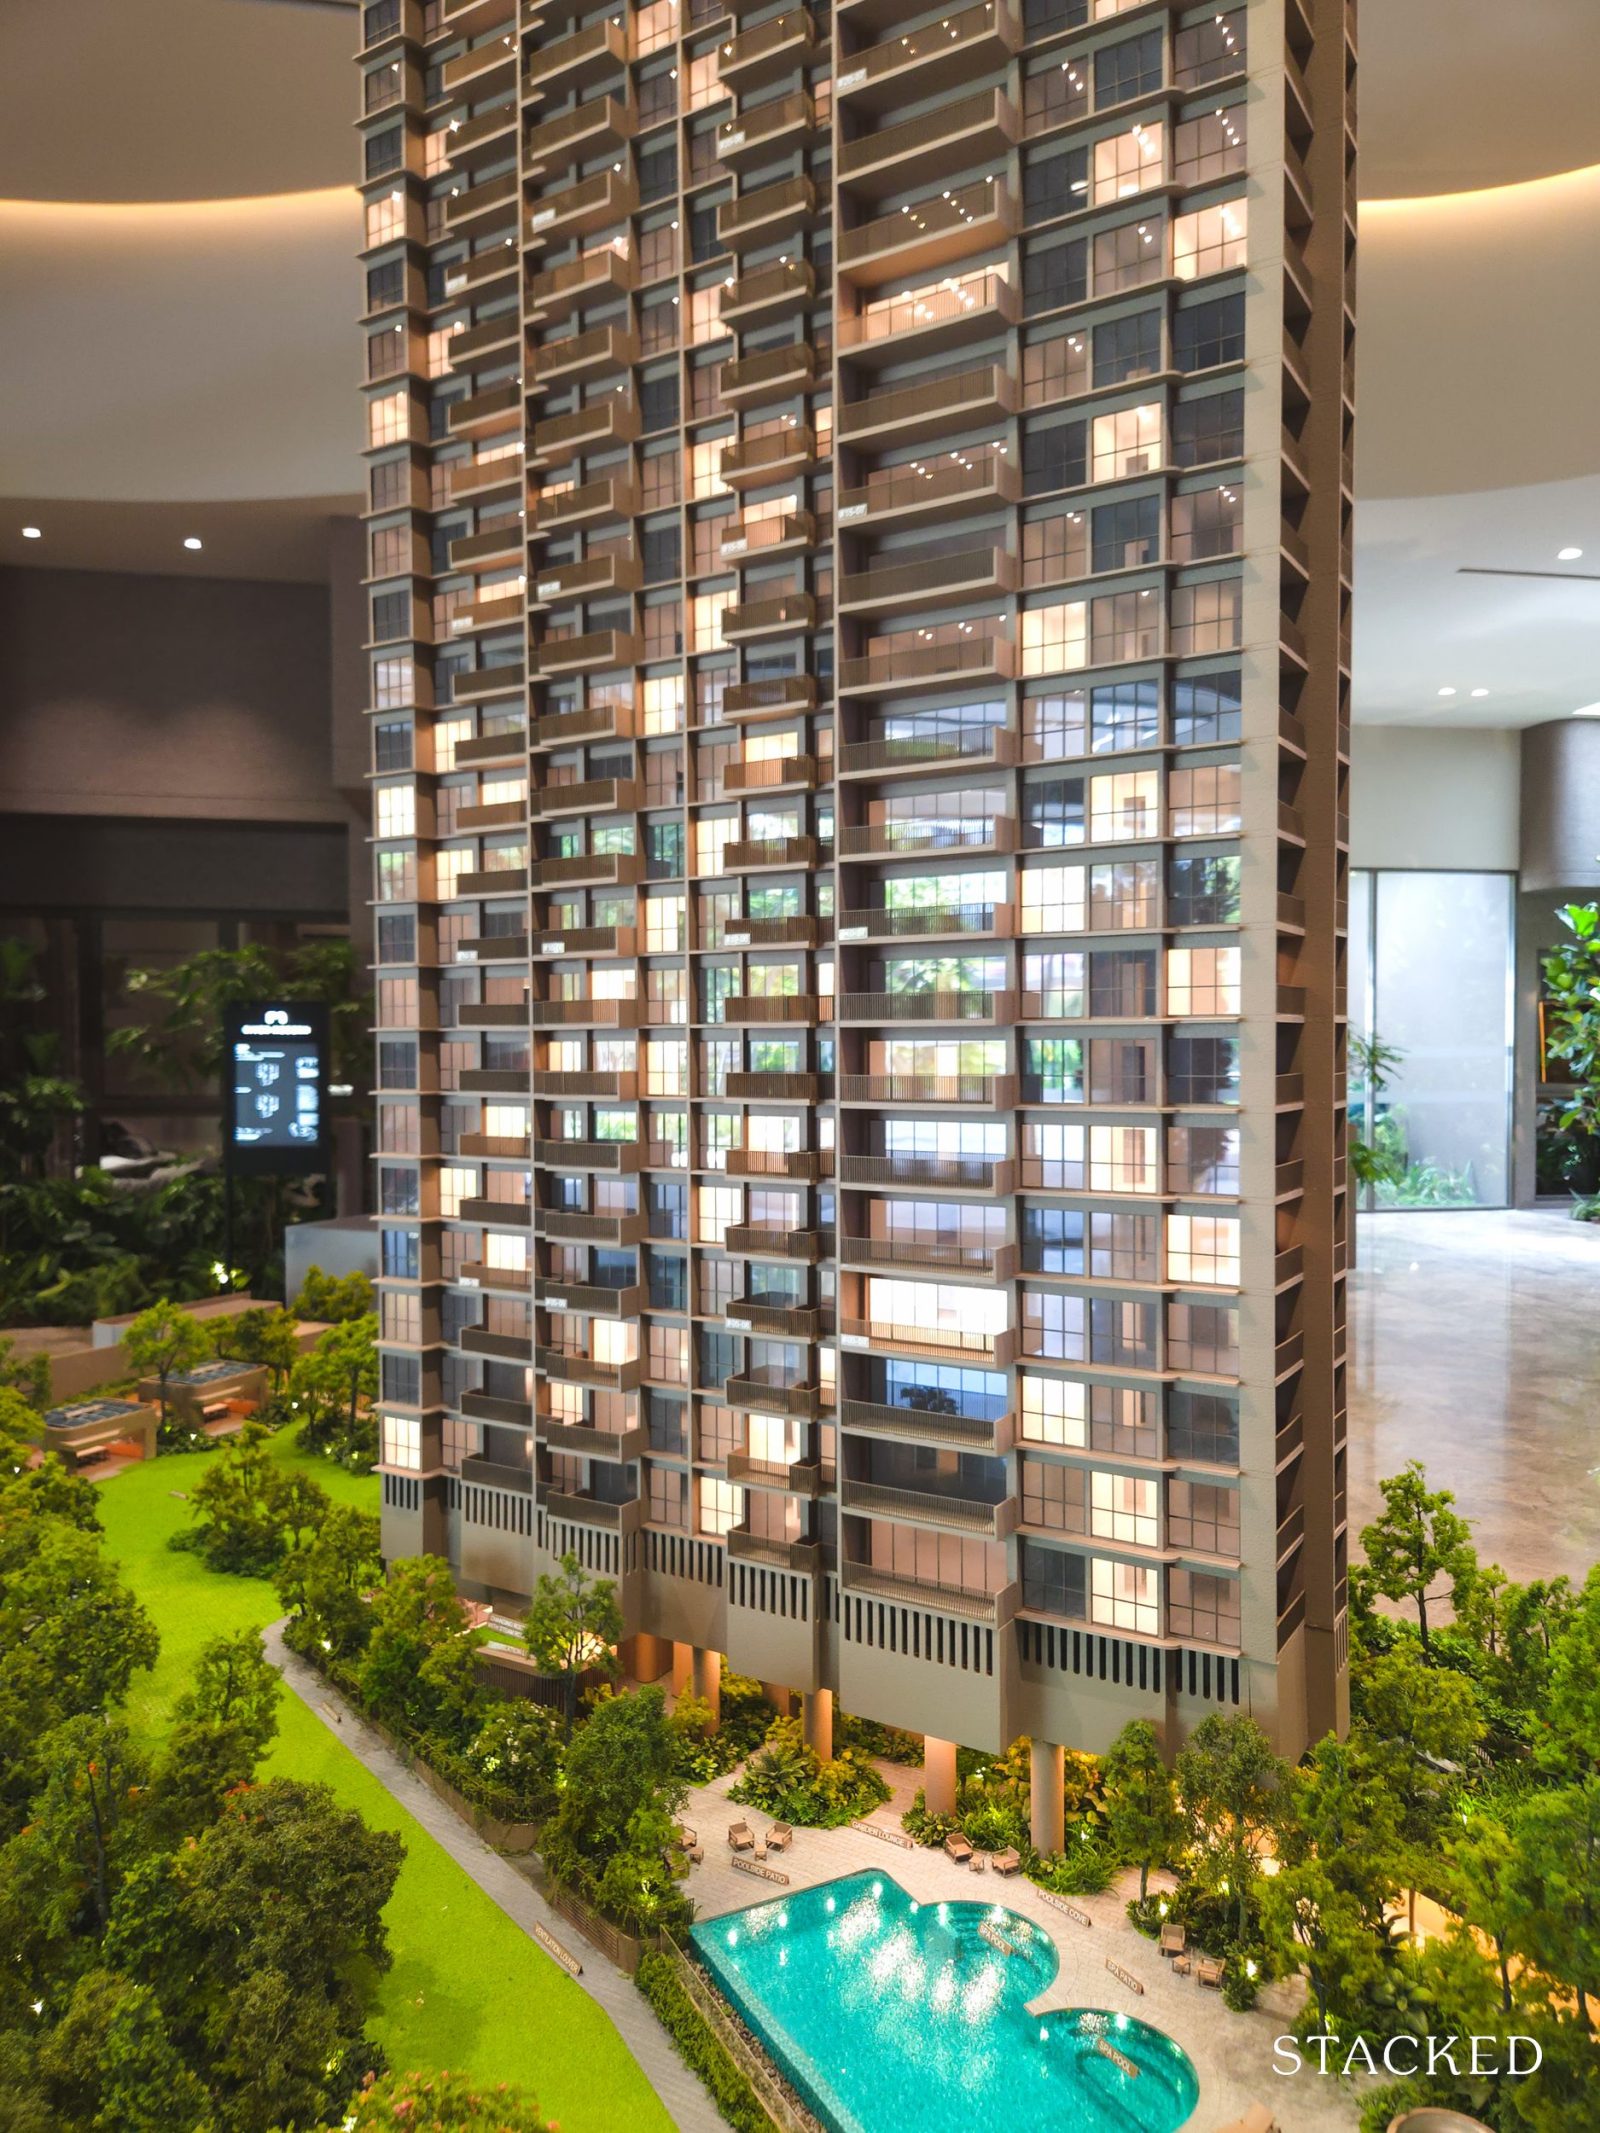
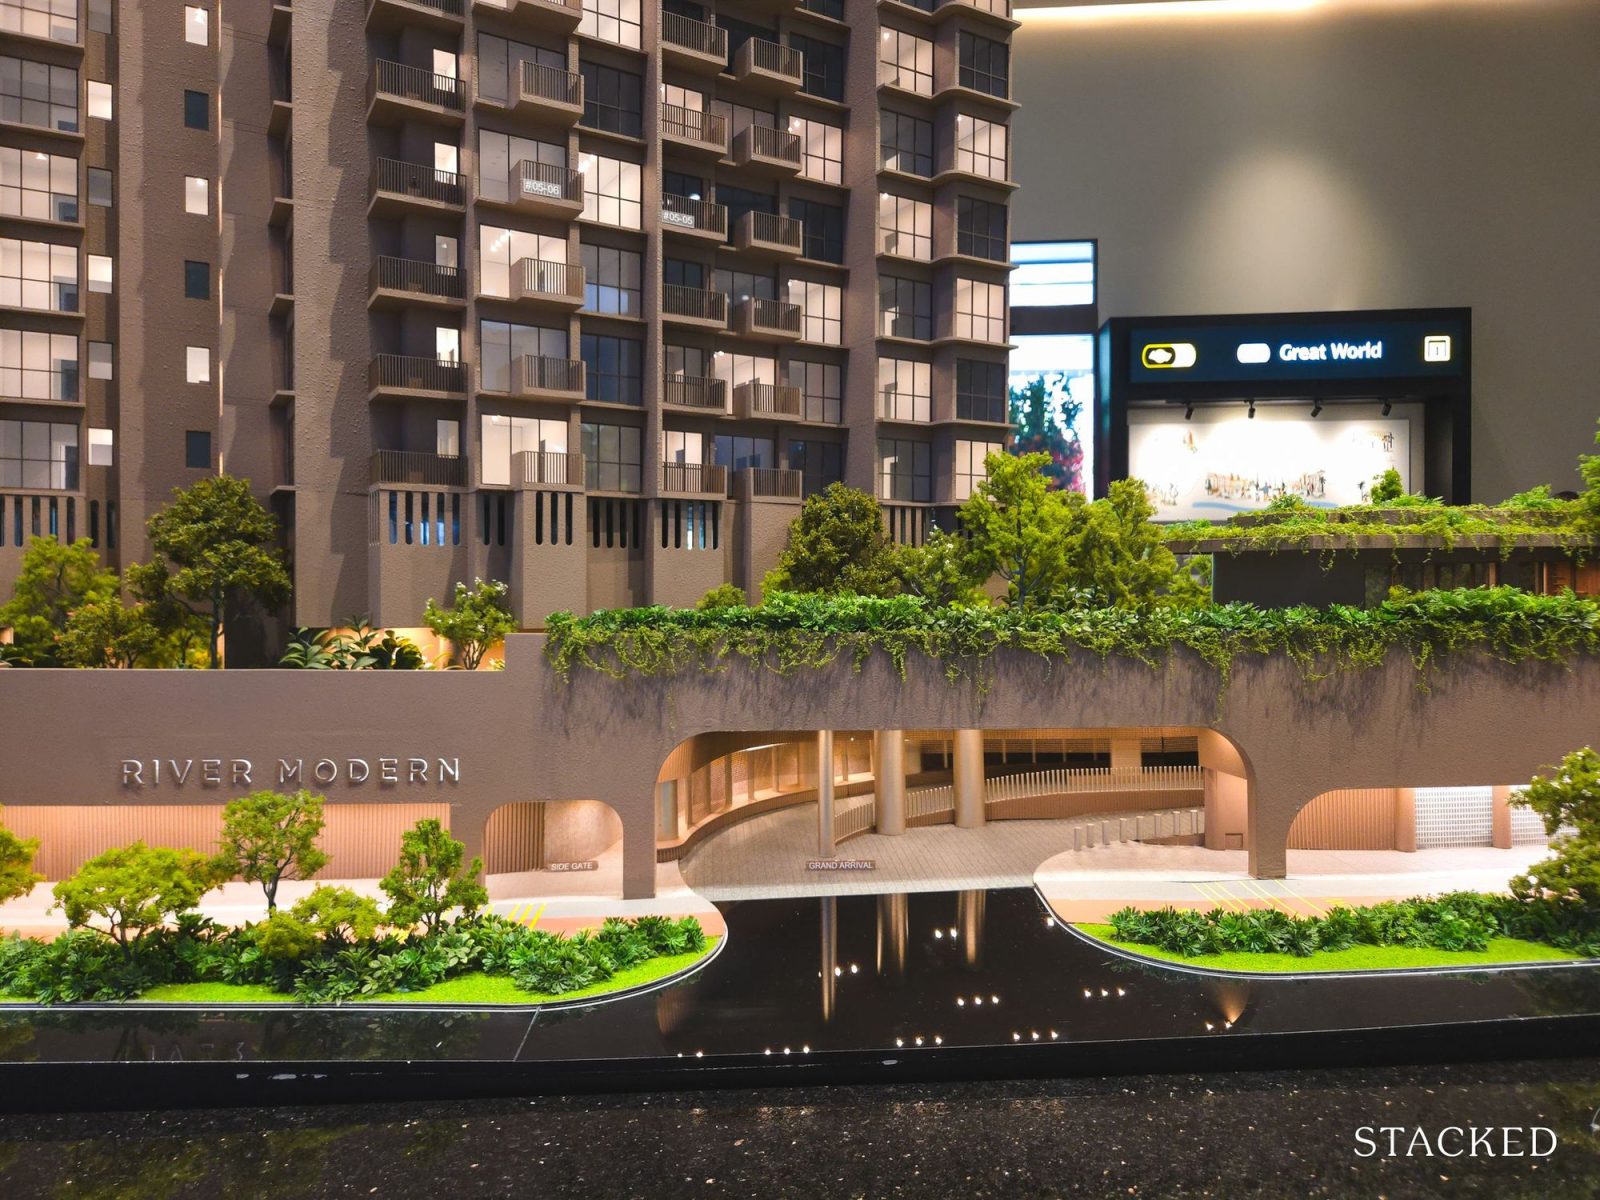
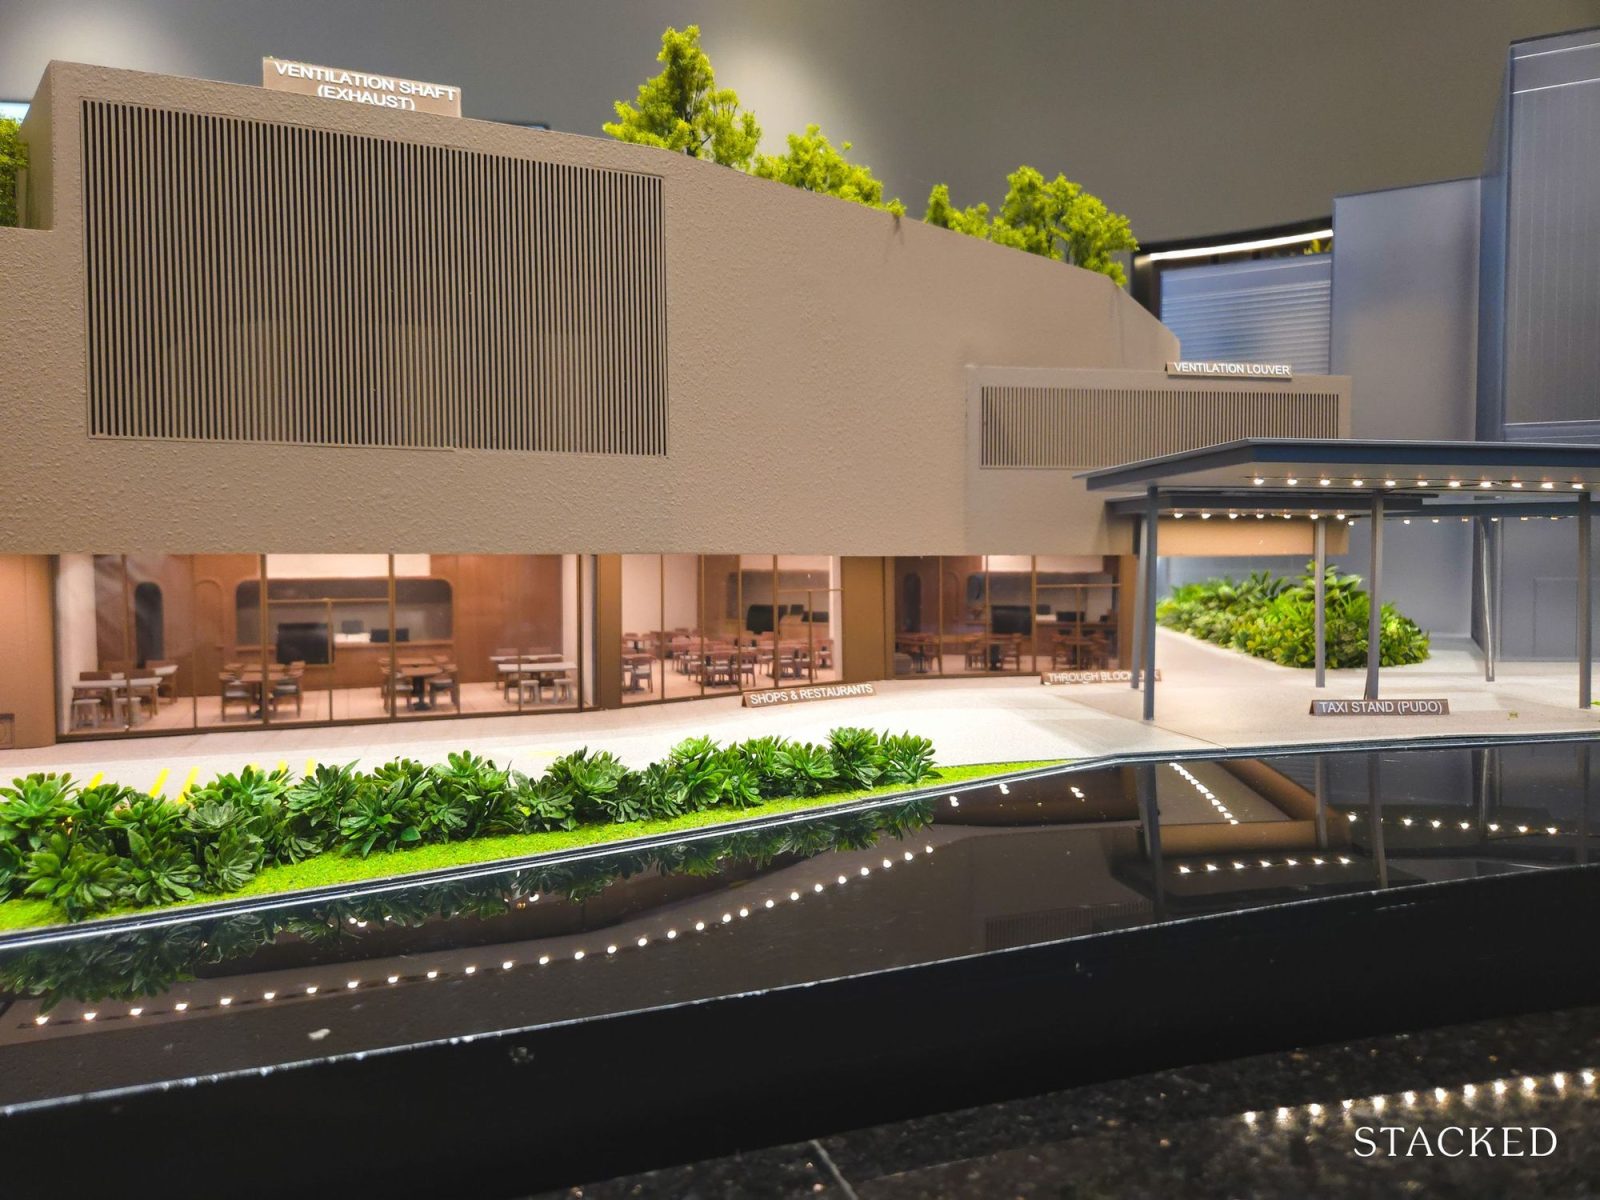
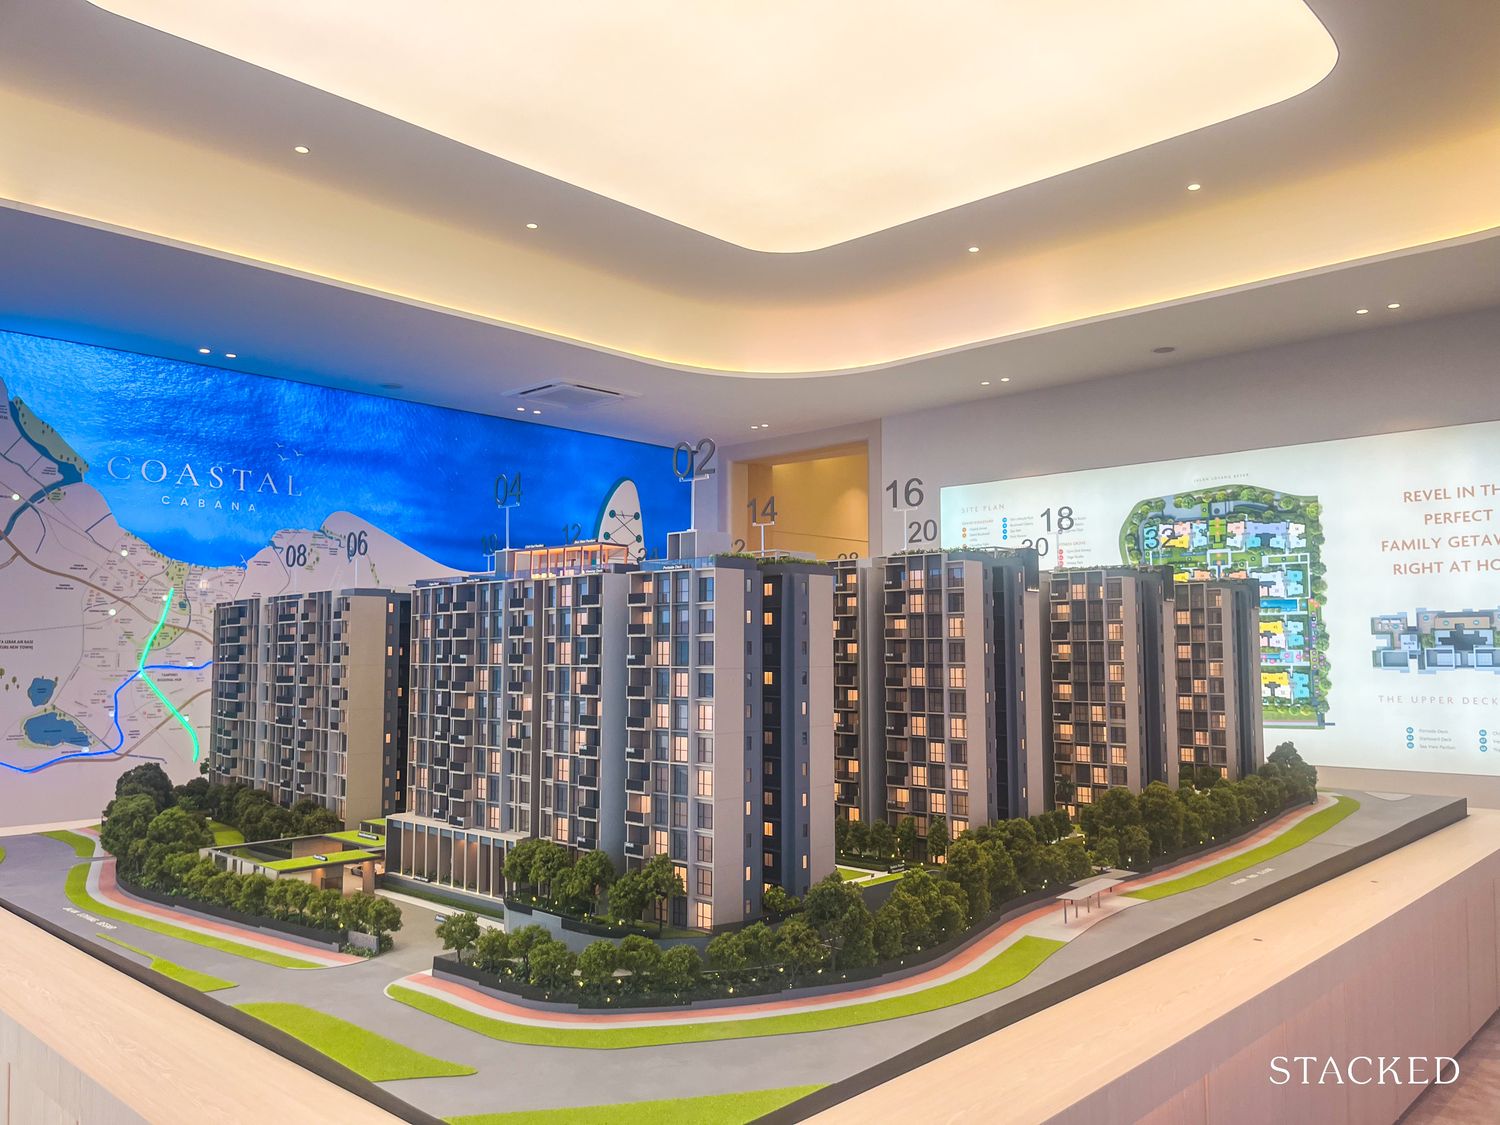
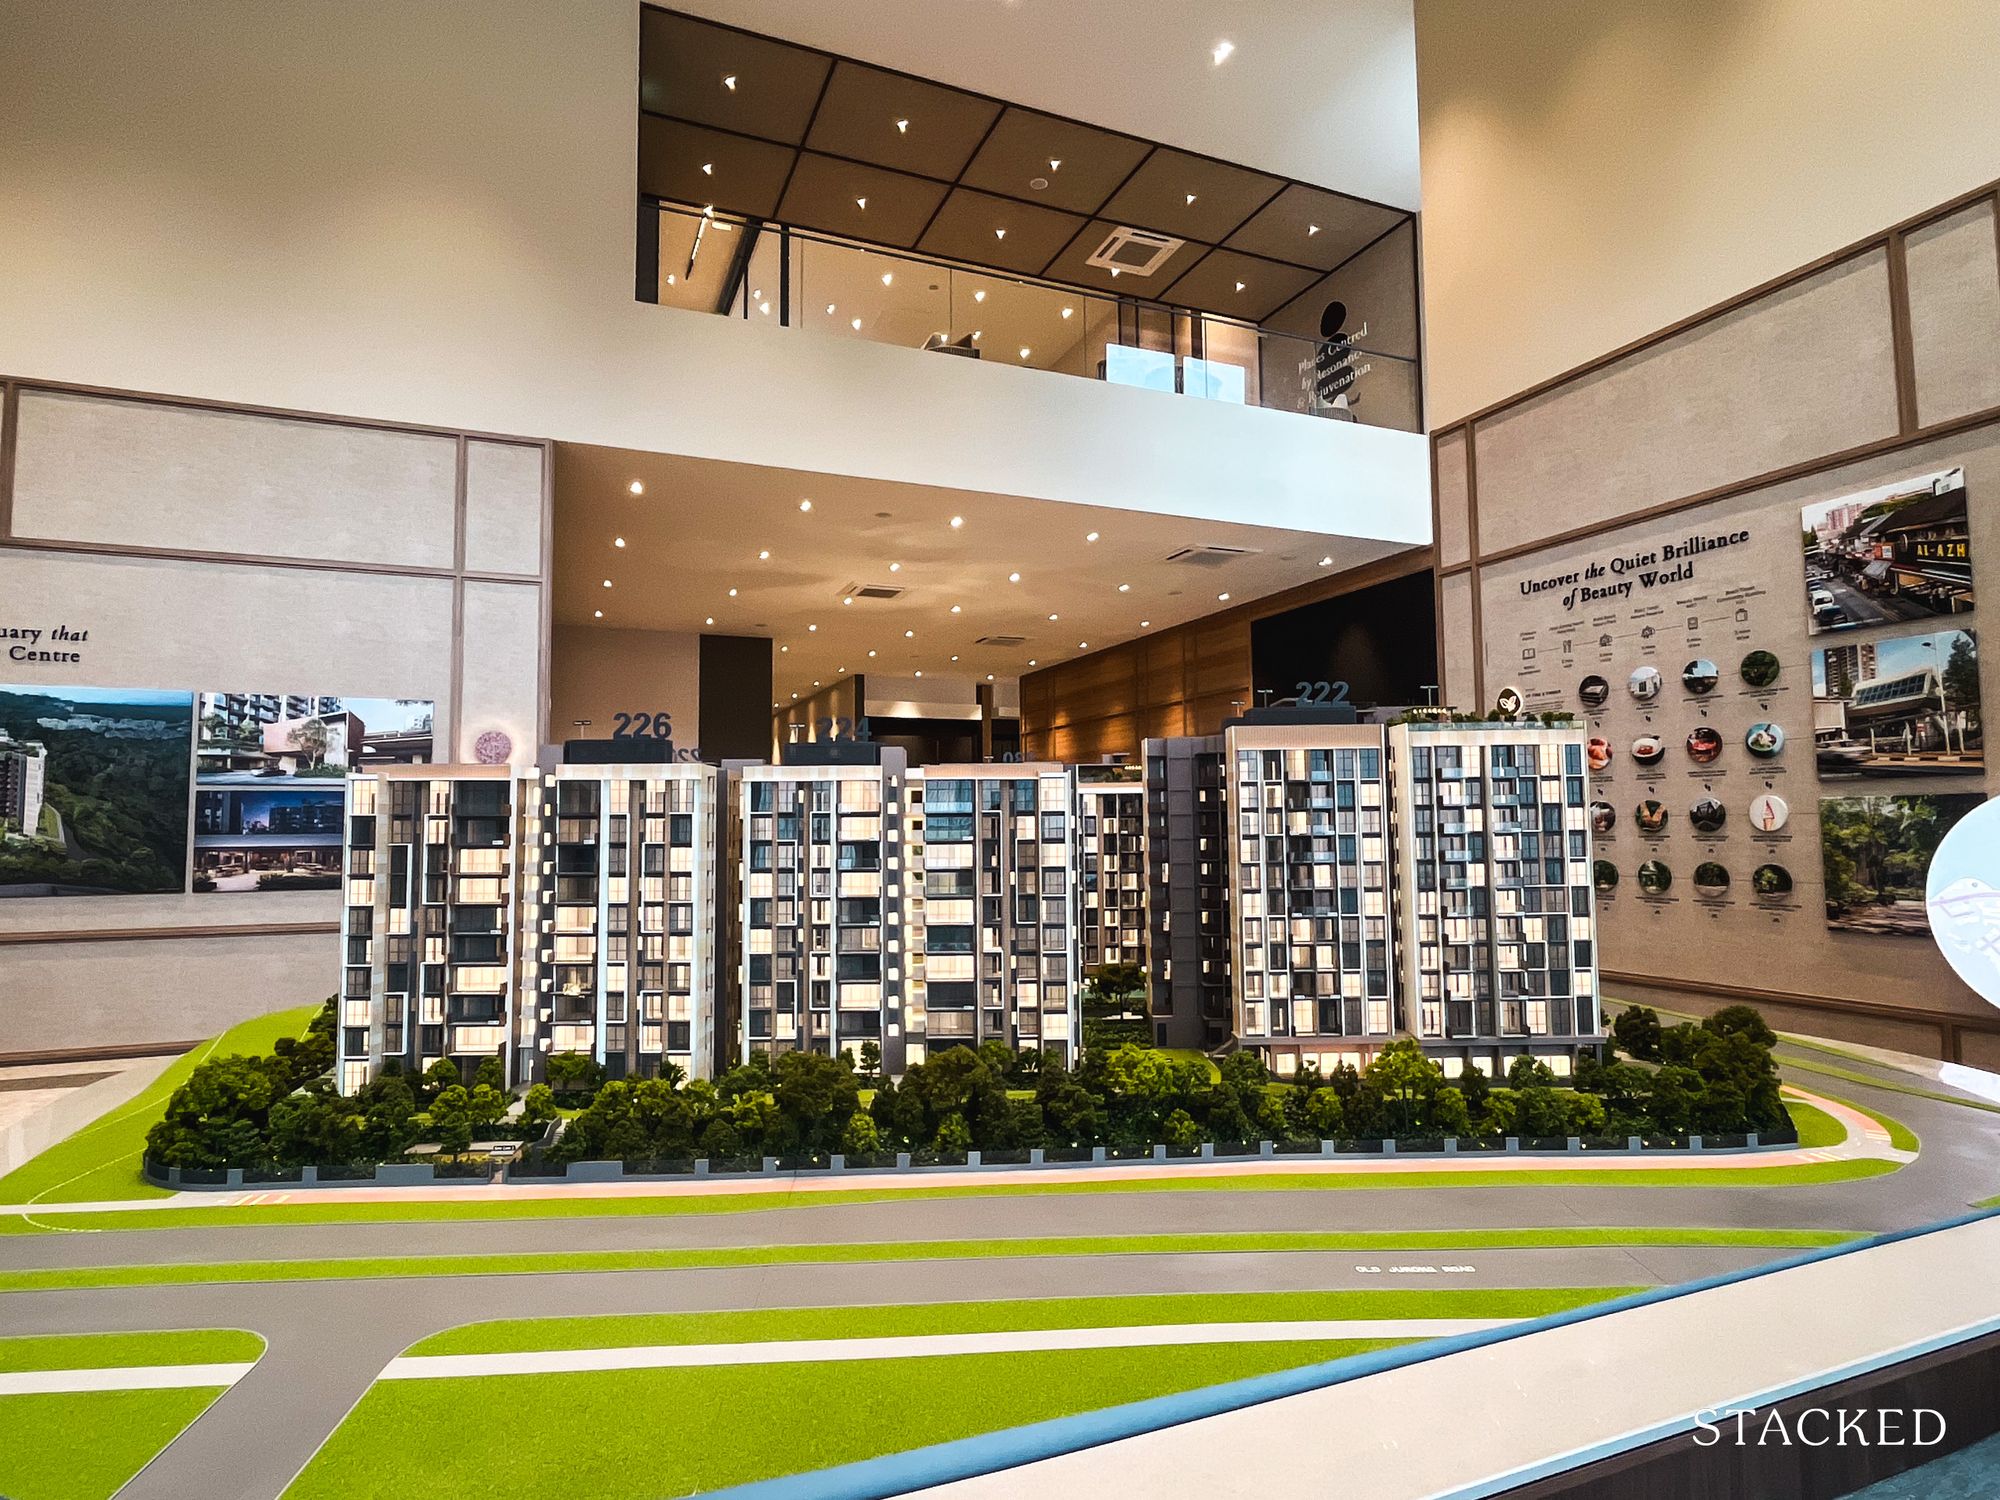
More than 80% of the site is set aside for landscaping and facilities. To make that work, the project goes tall with two 36-storey blocks. There will also be six commercial units on the first level, managed by the MCST.
There are considerations. The taller profile means many units will enjoy unblocked views of the river and the surrounding skyline, either towards Orchard Road or Marina Bay Sands. At the same time, as we’ve seen in projects like J’den and ELTA, this often results in a wider spread in terms of pricing between units on the lower and higher floors.
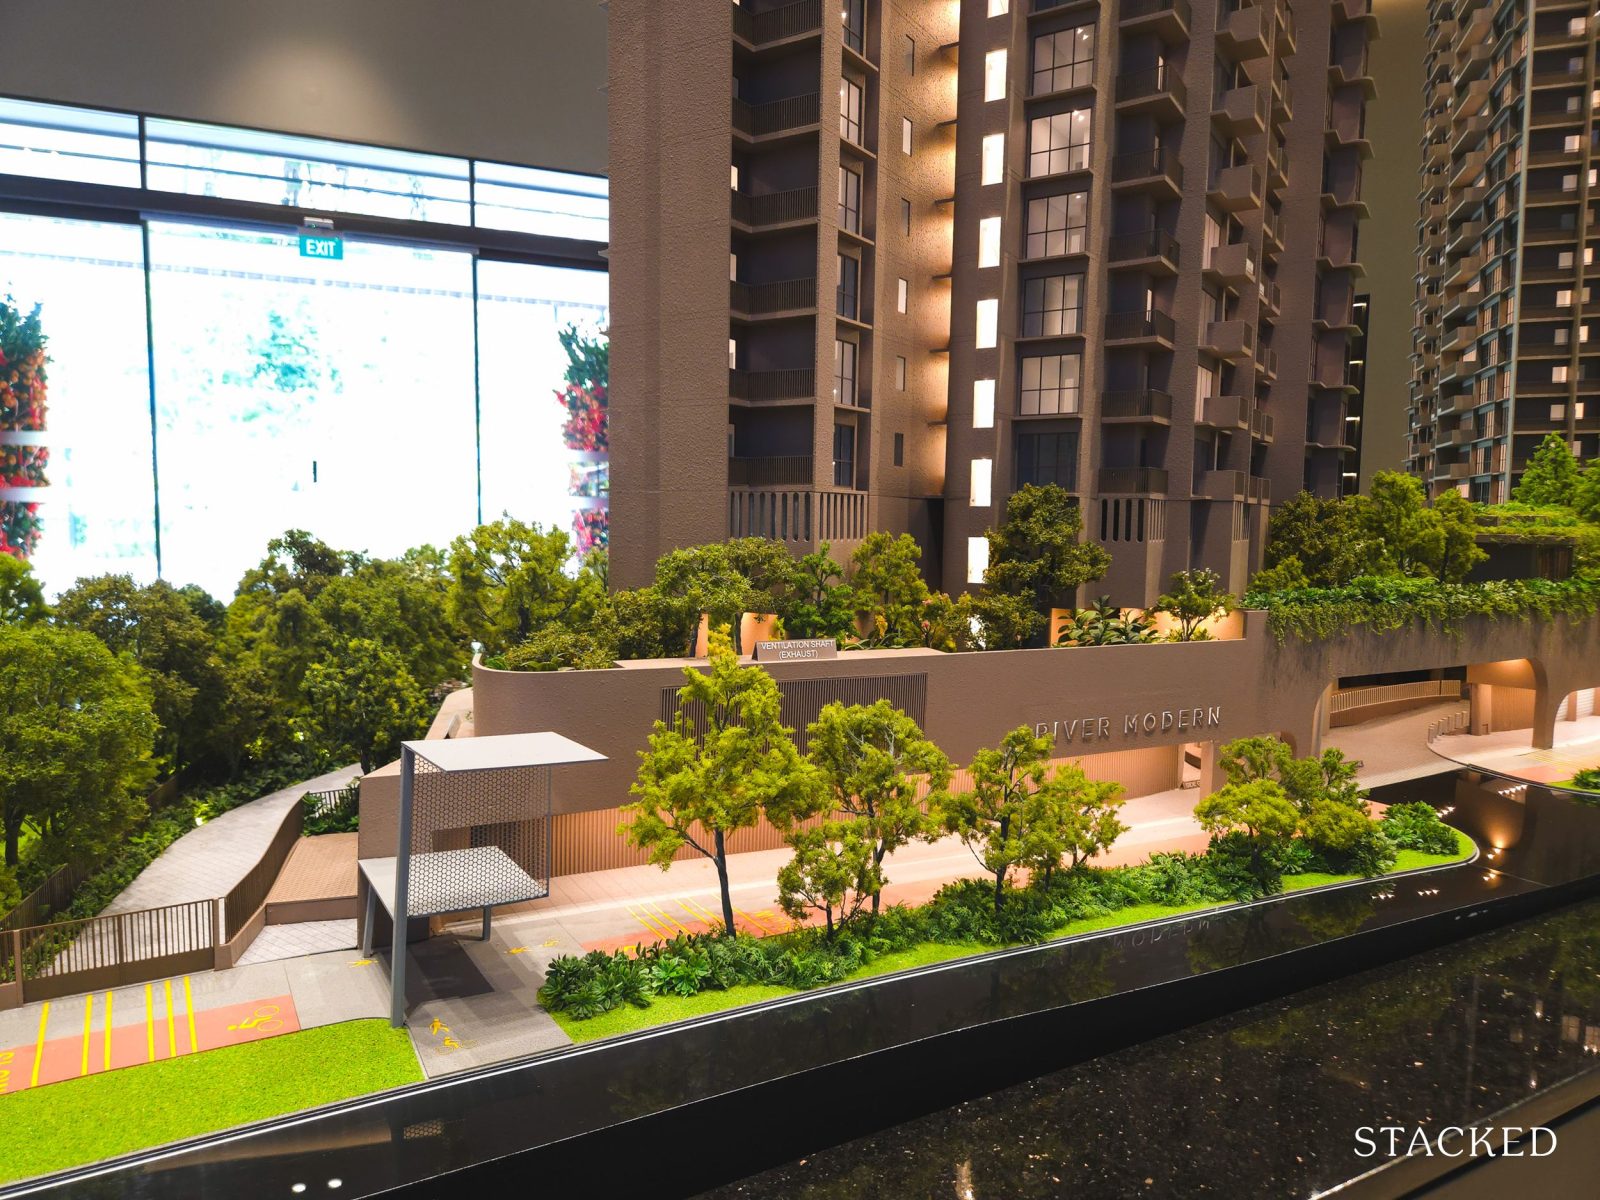
What’s interesting is how the natural terrain is handled. The site sits slightly elevated from the river promenade below and, instead of flattening it out, River Modern works with that elevation. This creates a subtle but noticeable separation from the public walkway of Kim Seng Park, giving the development a more private feel.
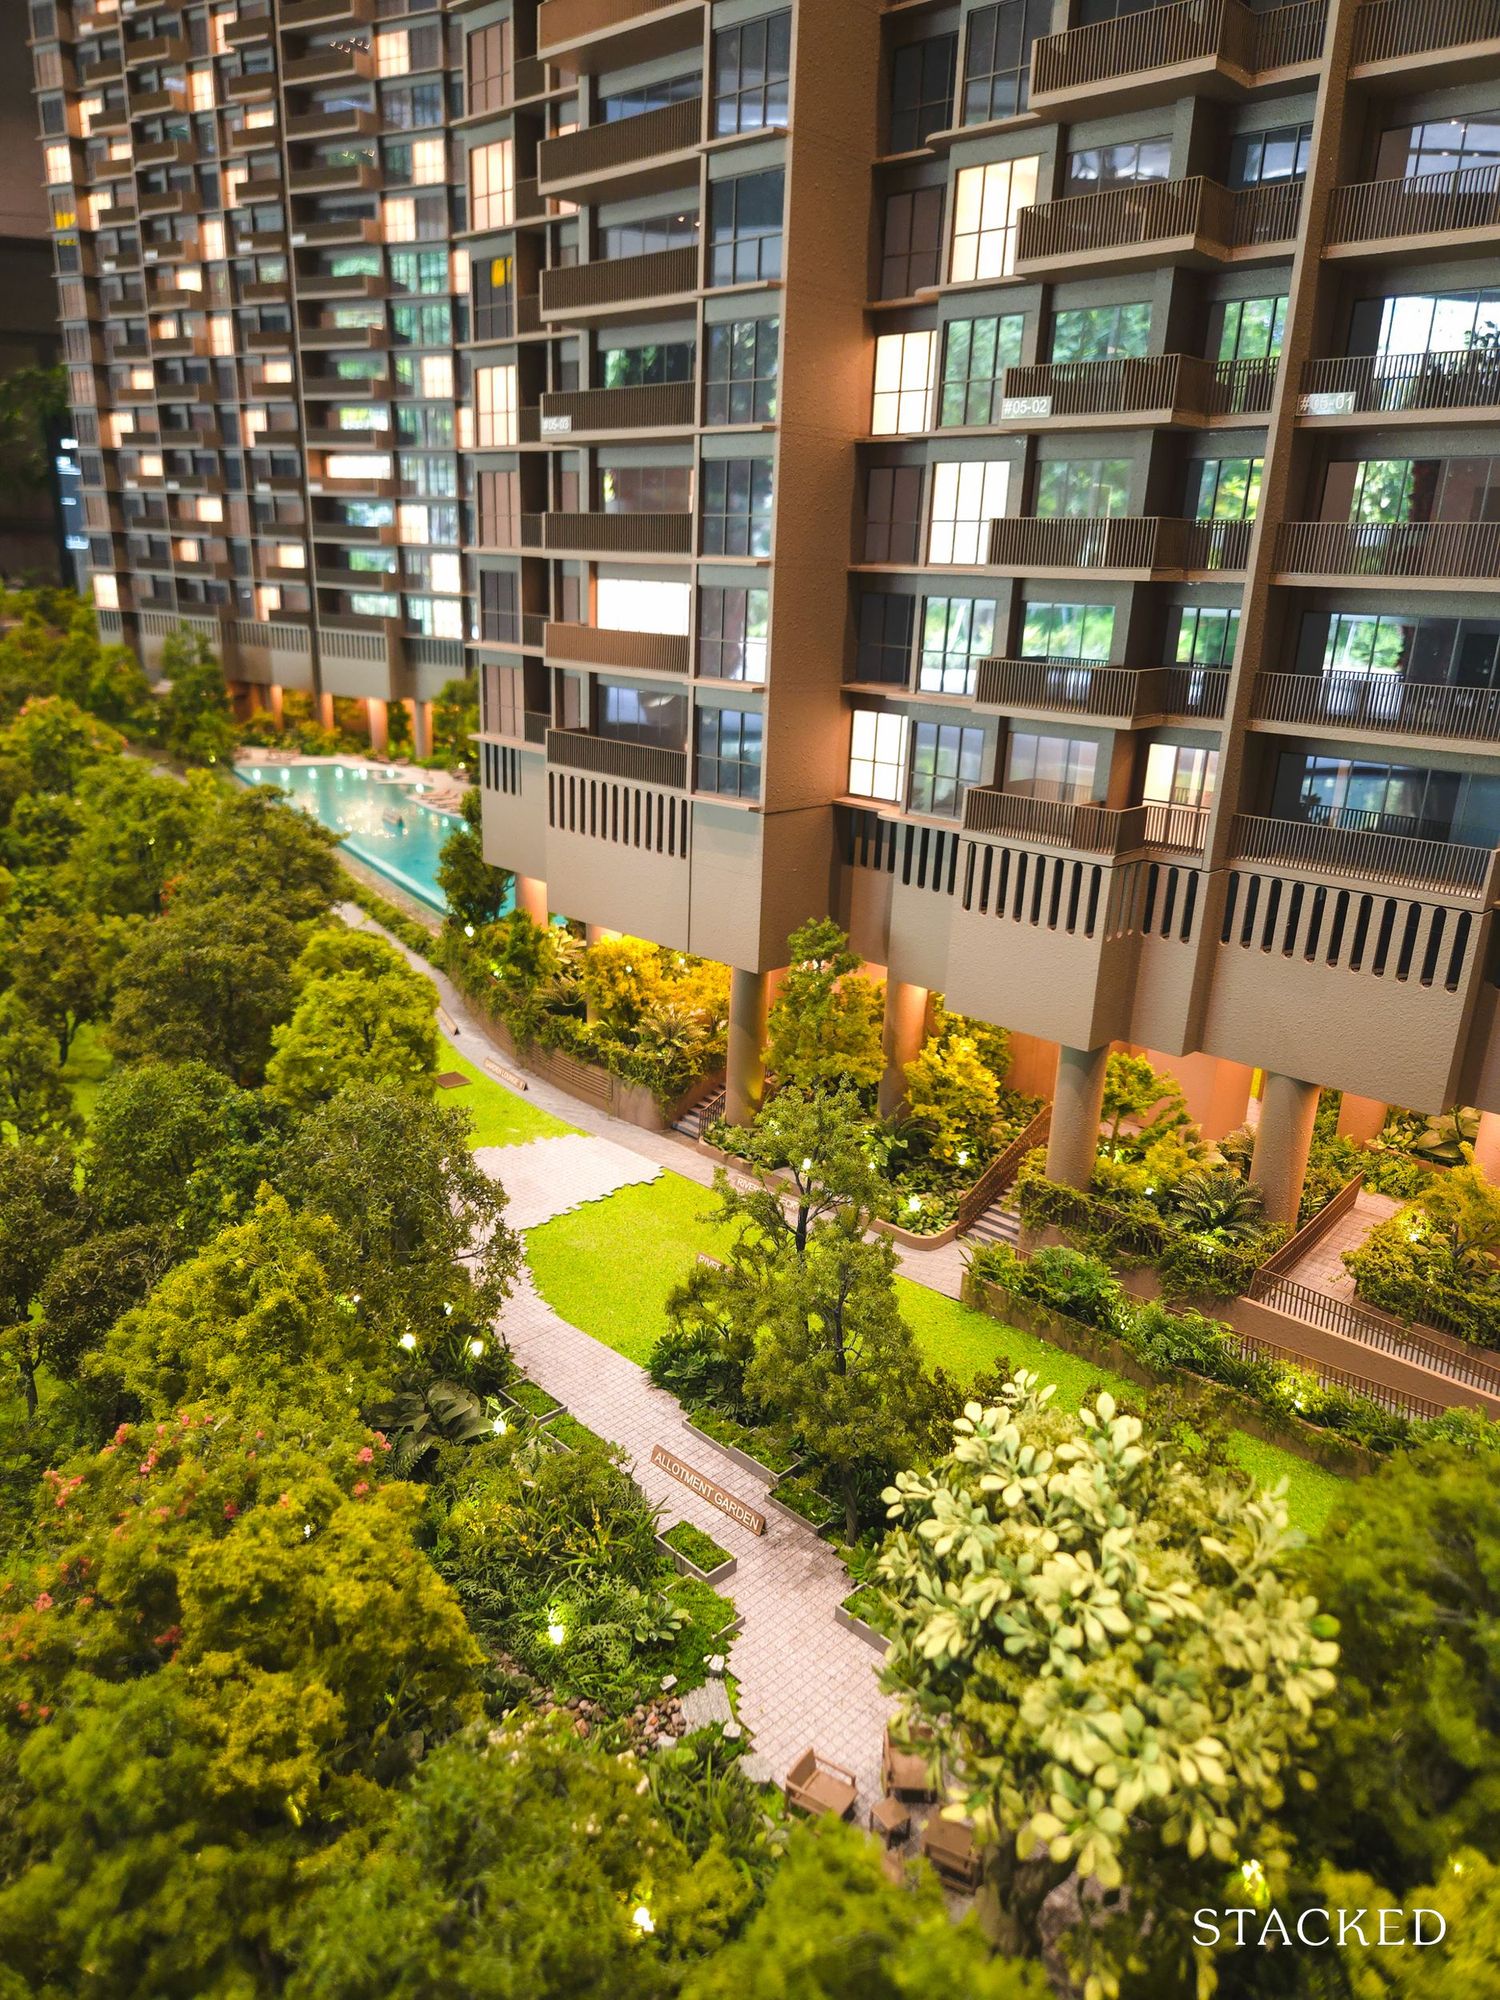
The residential blocks are also raised, so even the lowest units don’t start directly at ground level. In fact, the first residential floor sits at least five storeys above street level. Combined with the way the towers are angled (about 70% of units enjoy river-facing views), this will undoubtedly be one of the stronger draws of the project.
Day-to-day life in Robertson Quay: Walkability to Everything that Matters
River Modern is directly connected to Great World MRT Station with sheltered access into Great World City. The mall itself covers most everyday needs, from dining options to multiple supermarkets, including Meidi-Ya, CS Gold and Jason’s.
Given that level of connectivity, owning a car here may not be essential. The development provides 373 car park lots (including 12 EV lots), translating to roughly an 82% provision against the total unit count.
Beyond the mall, Robertson Quay has gradually evolved into a lifestyle-led enclave. The riverfront is lined with alfresco dining spots, established restaurants and an increasing number of wellness concepts, from boutique fitness studios to ice-bath and recovery spaces. Zion Riverside Food Centre is also within walking distance, offering a more local option for everyday meals.
Over time, this profile has shaped the demographic of residents. The area has long attracted expatriates and globally mobile buyers who prioritise Singapore’s walkability and dining culture, while still granting quick access to the CBD.
Interestingly, the river isn’t just scenery here. I have a few friends who live along this stretch, and for them, the river is part of their routine. On some mornings, instead of squeezing onto the train or sitting through traffic, they hop on the river taxi towards Raffles Quay and the CBD. It’s a slower, quieter commute and quite a unique way to start the workday.
All things considered, this is a location where daily life extends beyond the condo. The promenade sees activity throughout the day; whether it’s joggers in the morning, cyclists in the evening, or residents simply taking a stroll after dinner. It’s a lifestyle that’s difficult to replicate elsewhere in Singapore.
River-Inspired Architecture: An Evolution of the “Modern” Series
Given how central the river is to the identity of the neighbourhood, it’s not surprising that River Modern leans into it architecturally as well.
The project is designed by ipli Architects and P&T Architects, both established names in Singapore’s high-rise residential landscape. Ipli, in particular, has worked closely with GuocoLand across several projects in its “Modern” series, including Midtown Modern and the nearby Martin Modern.
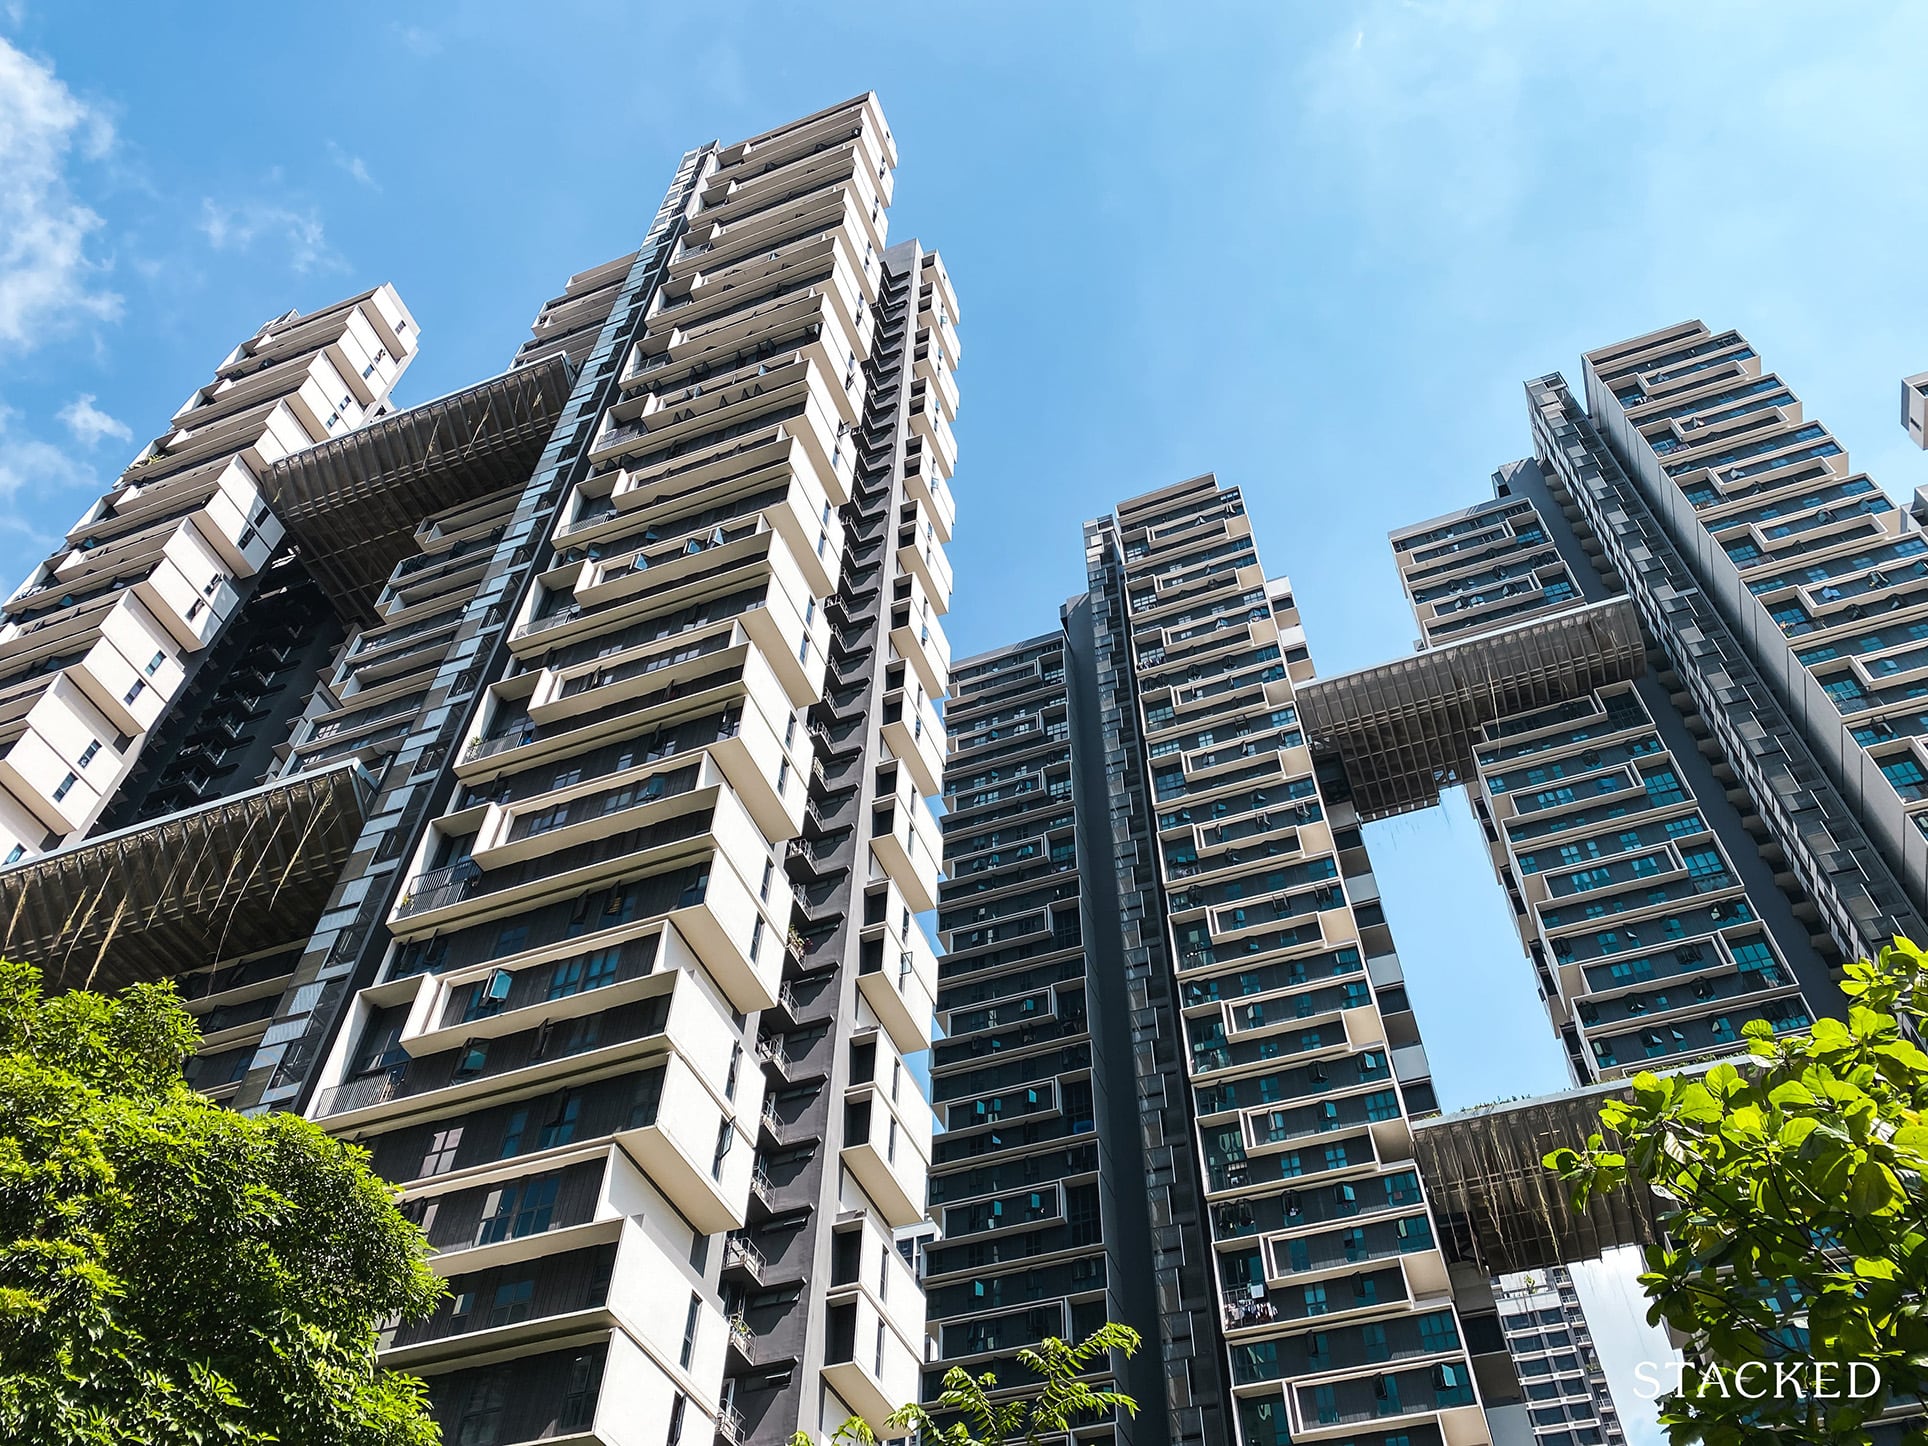
Those familiar with Martin Modern may notice a subtle continuity here. The curved crown detailing at the top of River Modern’s towers echoes a similar design language as seen in the softer lines that reference the movement of the river rather than rigid, boxy forms.
When Martin Modern launched a decade ago, it was seen as a defining project for GuocoLand; one that placed emphasis on generous landscaping, strong site planning and practical layouts rather than overt architectural statements. River Modern appears to build on that same foundation, this time with a direct riverfront setting.
P&T Architects, who have also collaborated with GuocoLand on projects such as Lentor Hill Residences and Faber Residence, bring their own high-density residential experience into the mix.
The result is a sleek, contemporary development that doesn’t try to overpower its surroundings. With two 36-storey towers angled towards the water, around 70% of units are positioned to enjoy river-facing views, which is a clear reflection of how the project prioritises its setting.
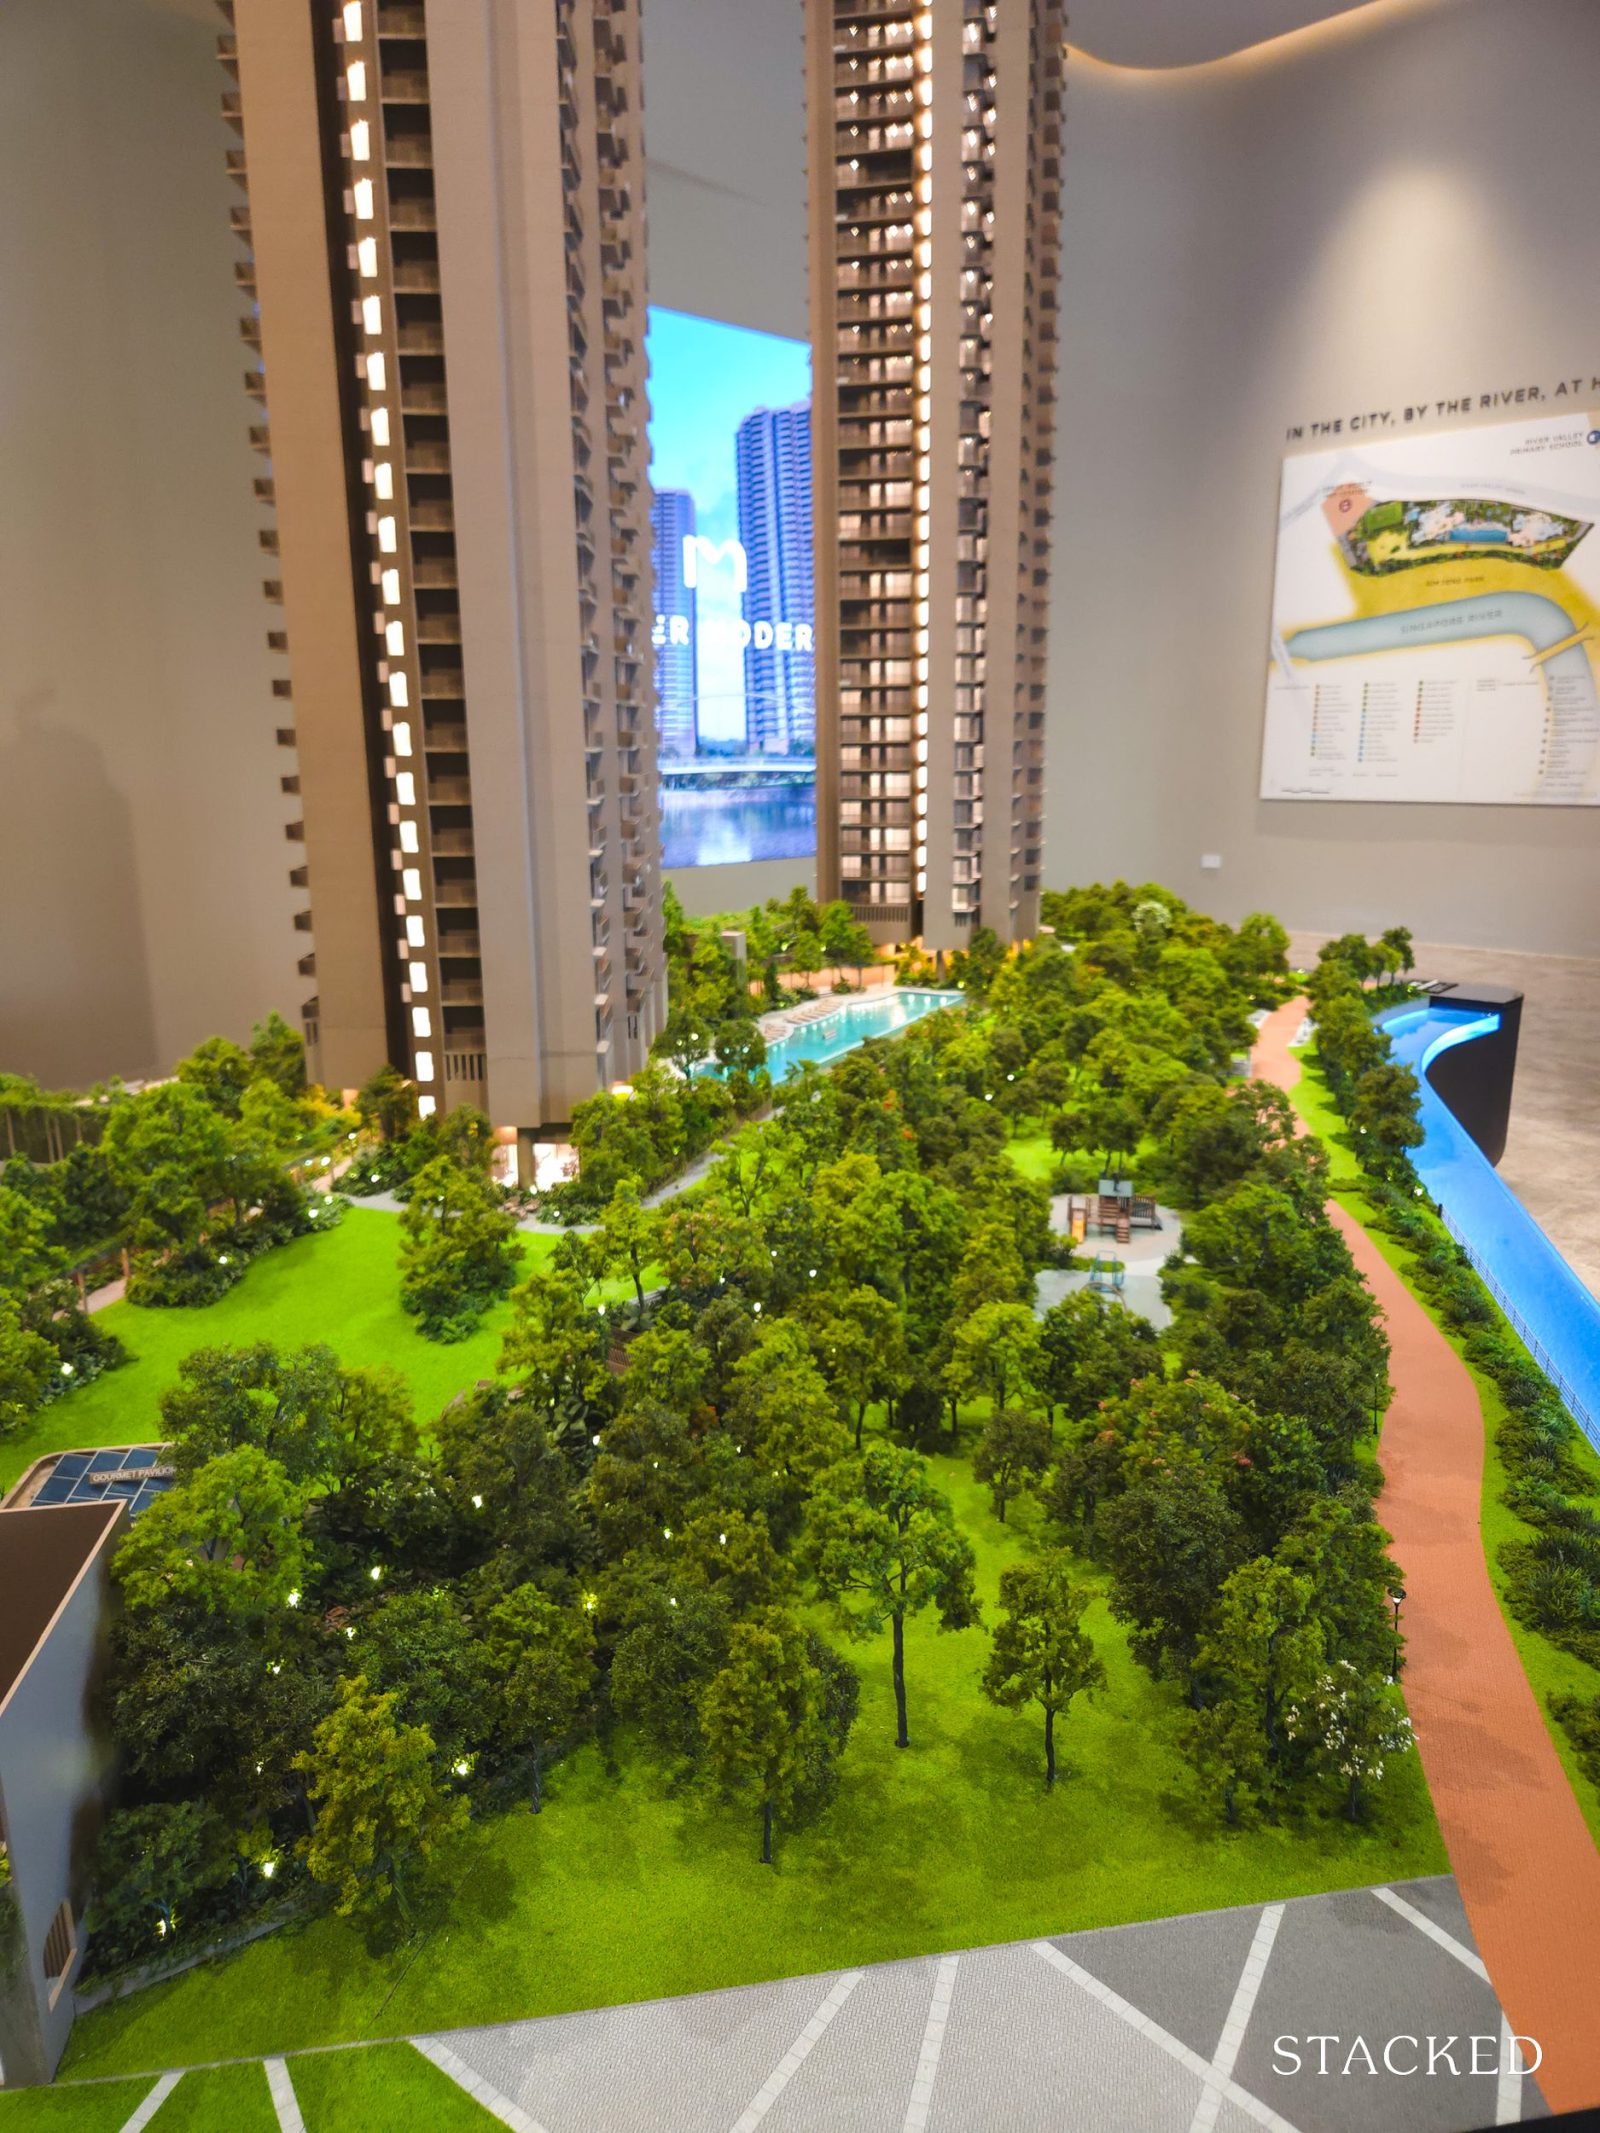
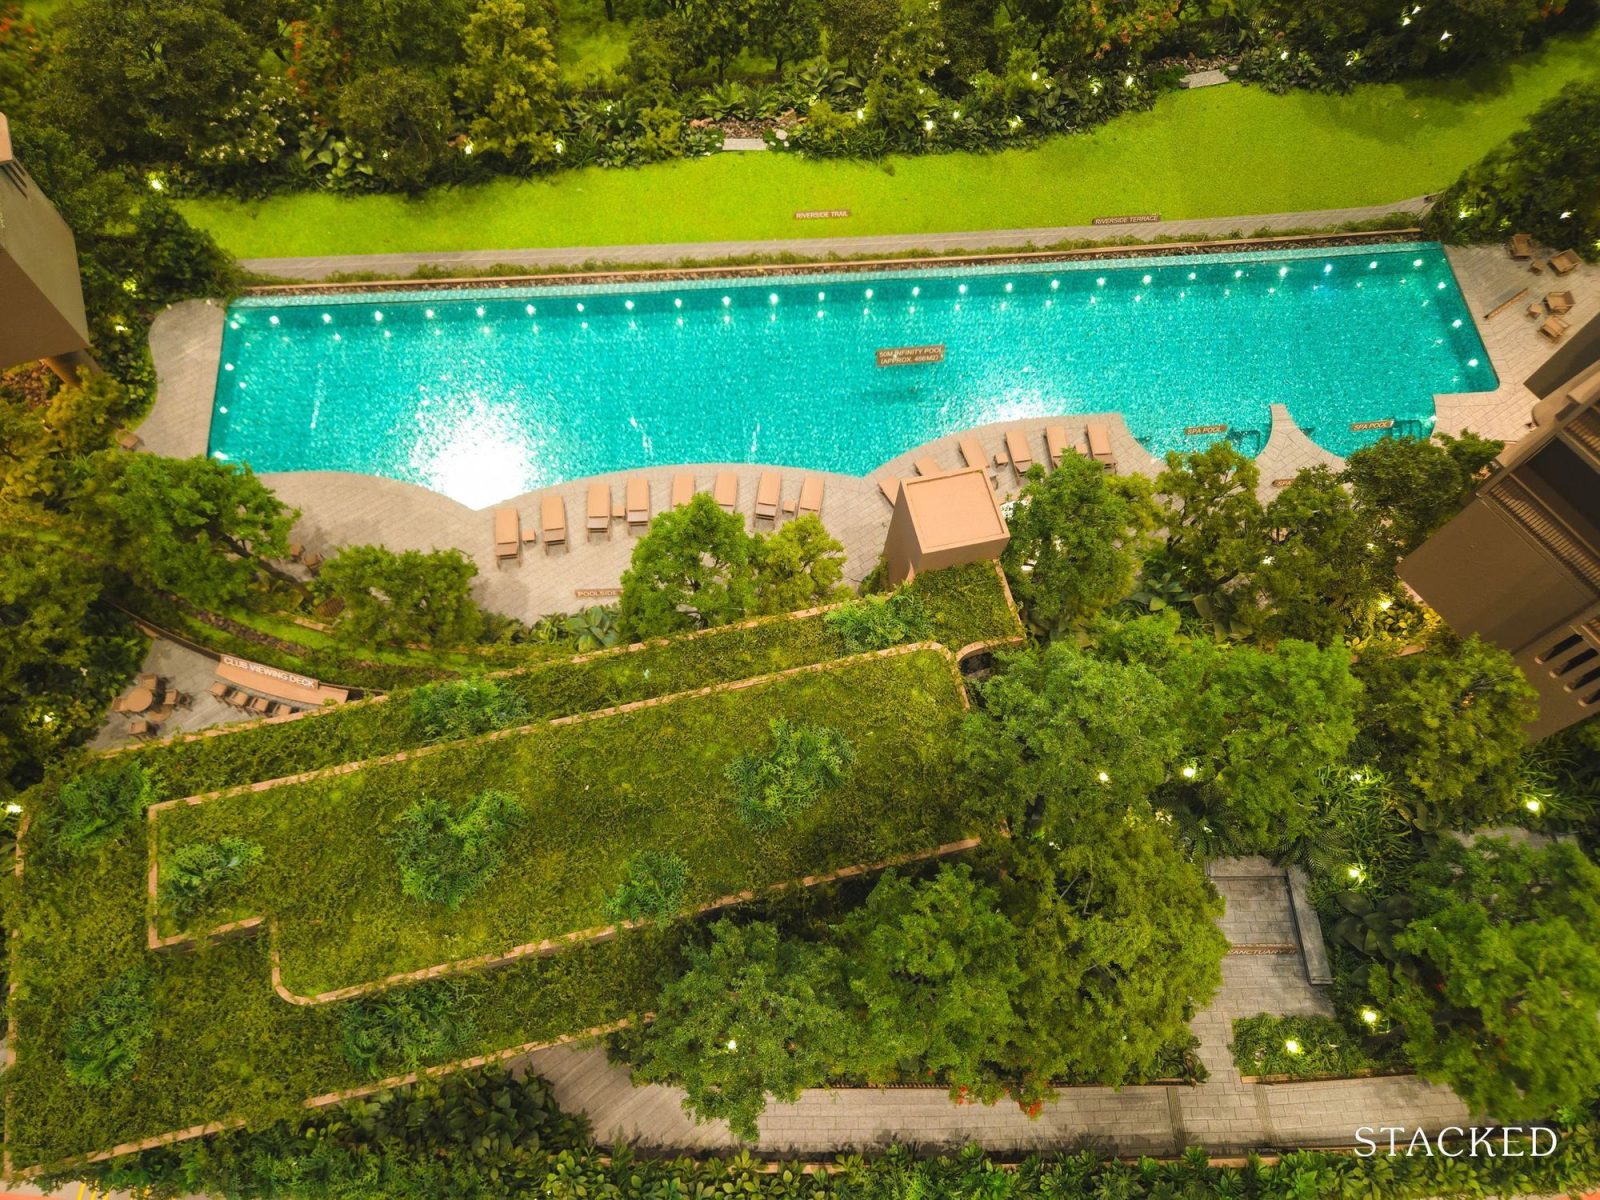
As for facilities, River Modern offers a fairly comprehensive line-up. There’s a tennis court, a 50m lap pool, a gym and two sheltered gourmet pavilions.
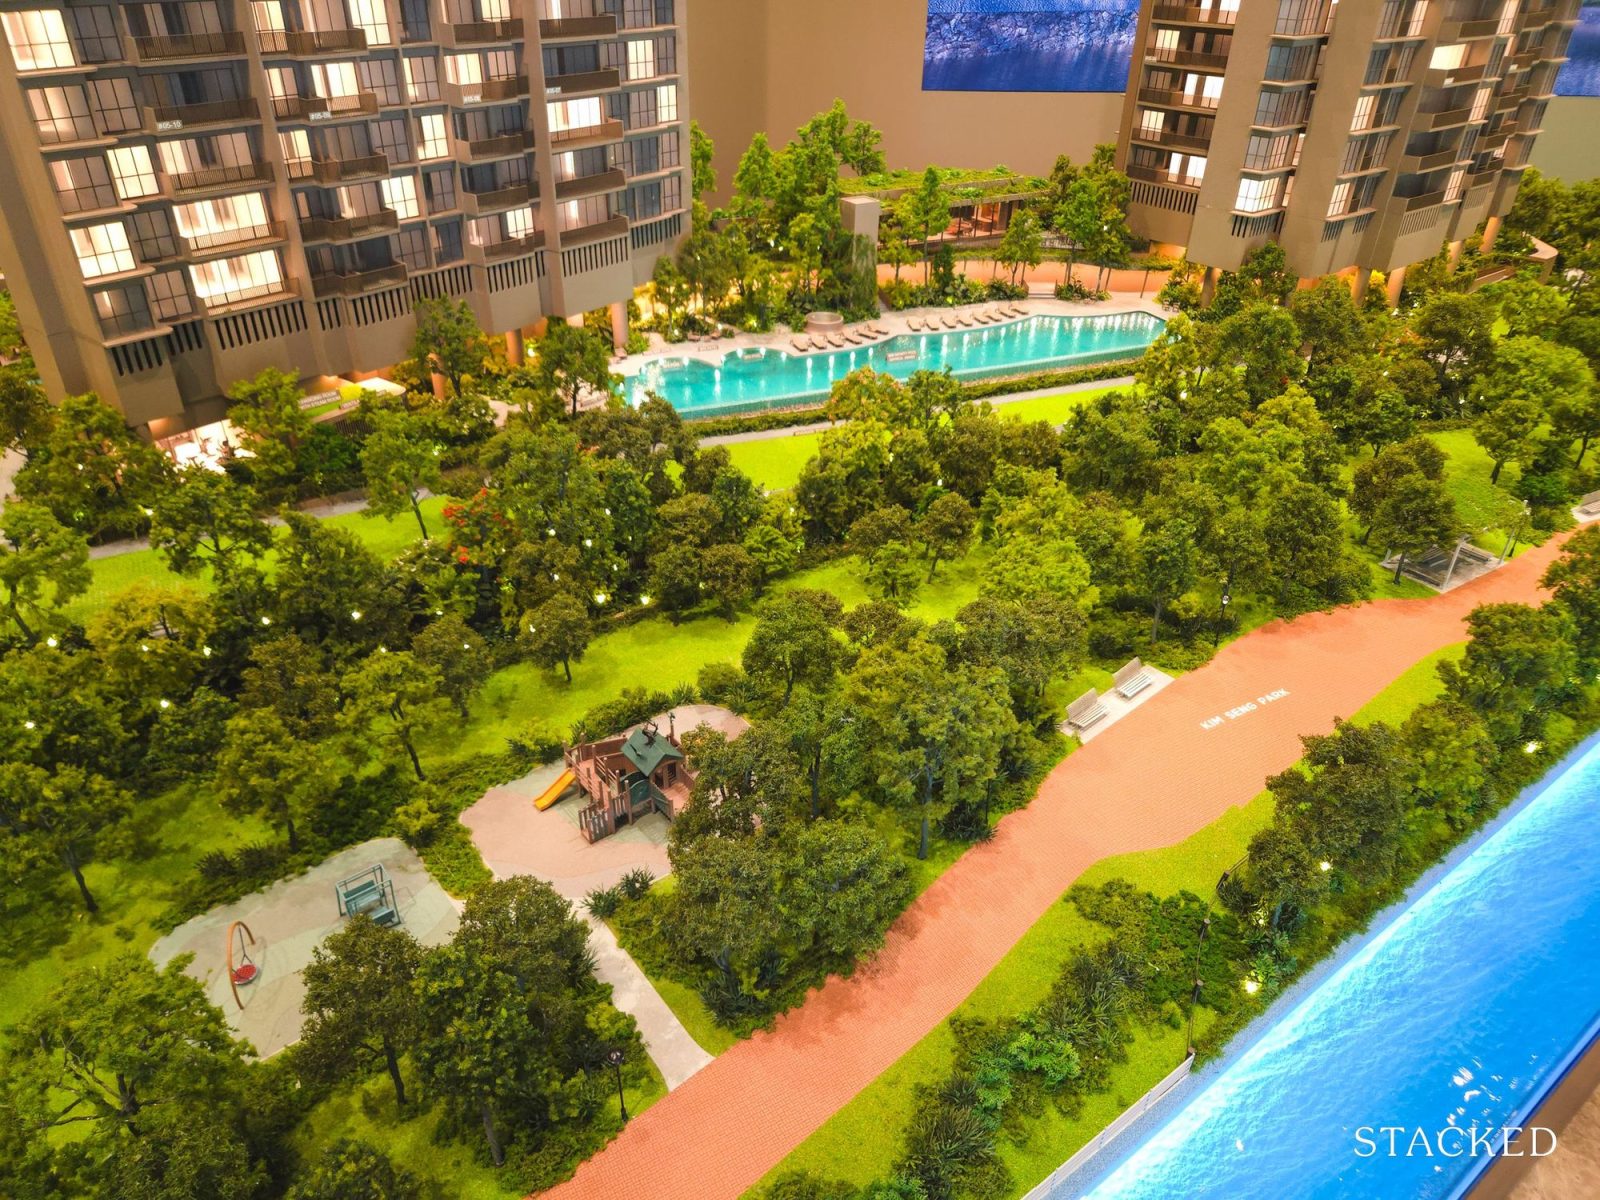
Given that this is positioned for homeowners and a family-friendly development, you’ll also find family-oriented amenities such as a play pool, playground and open lawns, which is something GuocoLand has consistently emphasised across most of its projects.
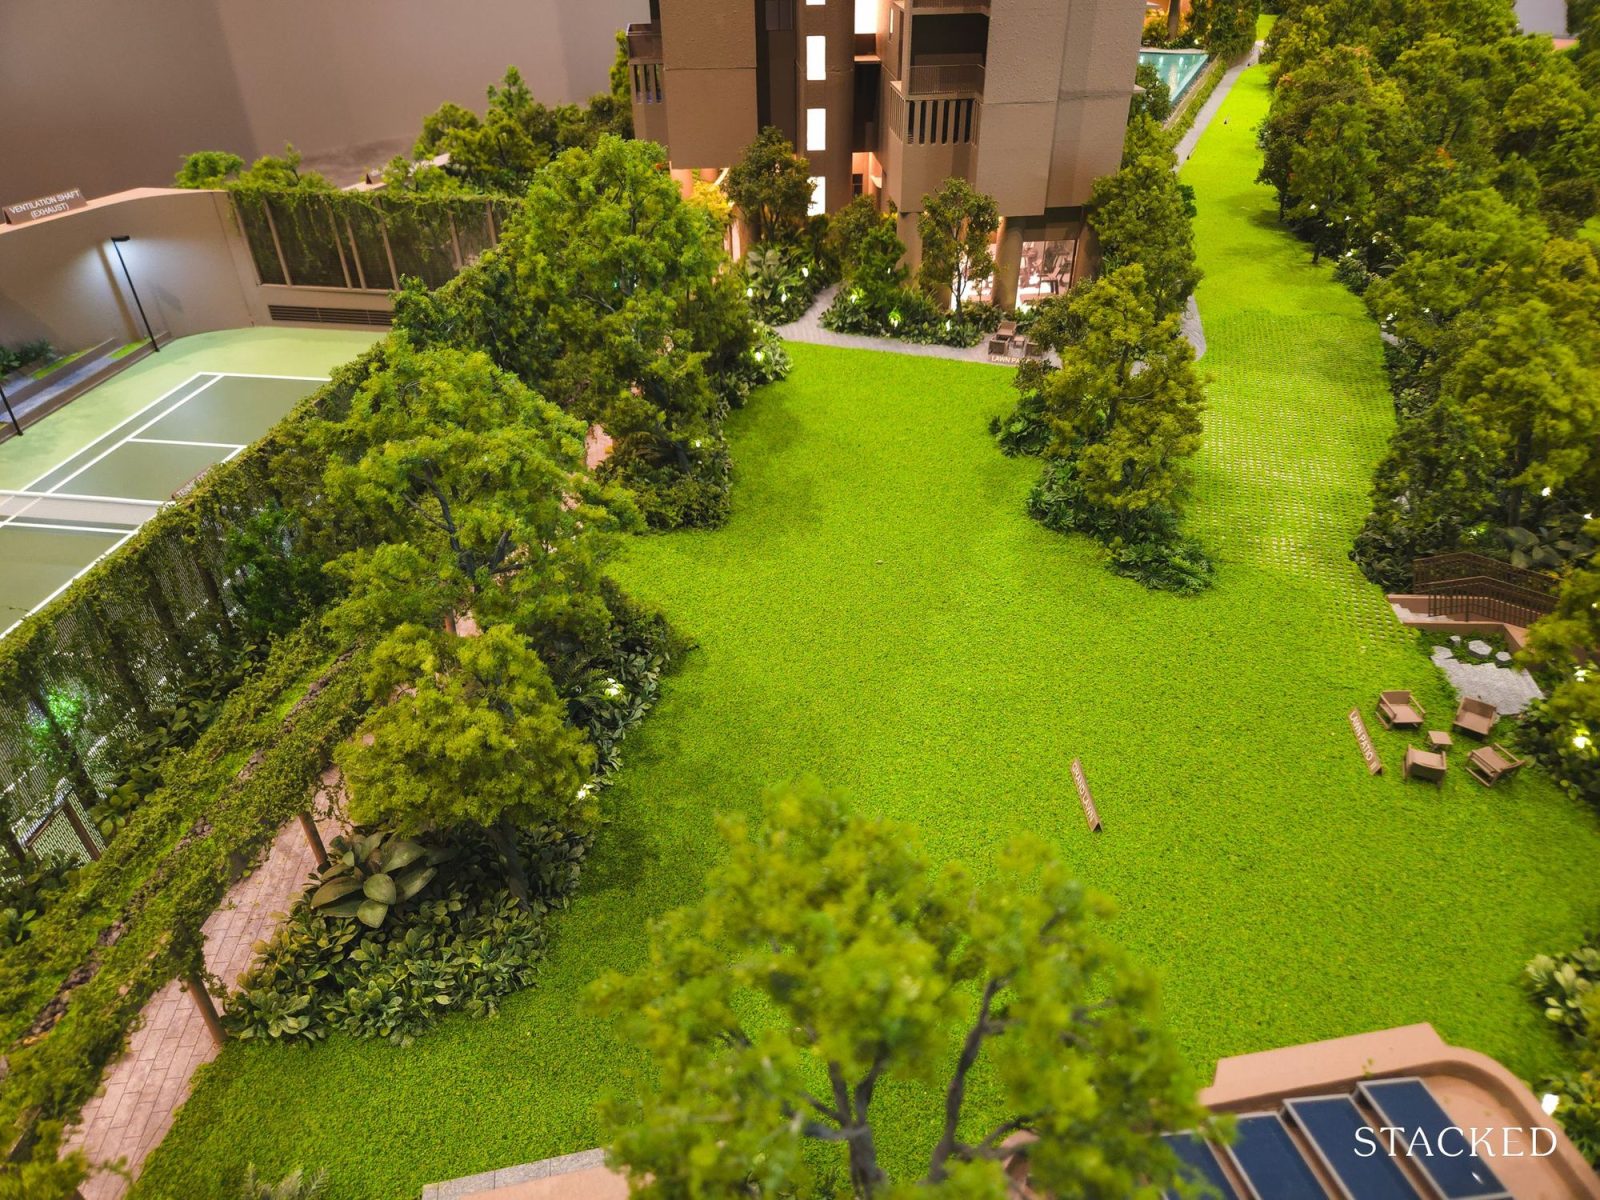
Overall, the landscaping is also designed well. It’s split into four zones (lawn, pool, forest and riverside) so things don’t feel overly concentrated in one corner.
And instead of stuffing the place with facilities just to tick boxes, the choice of amenities feels intentional. The clubhouse, for example, looks out towards the river and Kim Seng Park, which makes it feel connected to the surroundings.
There are also six strata commercial units within the development. Details on the tenant mix have yet to be confirmed, but given the already mature retail and dining scene in the area, these are likely to serve as complementary conveniences rather than primary draw factors.
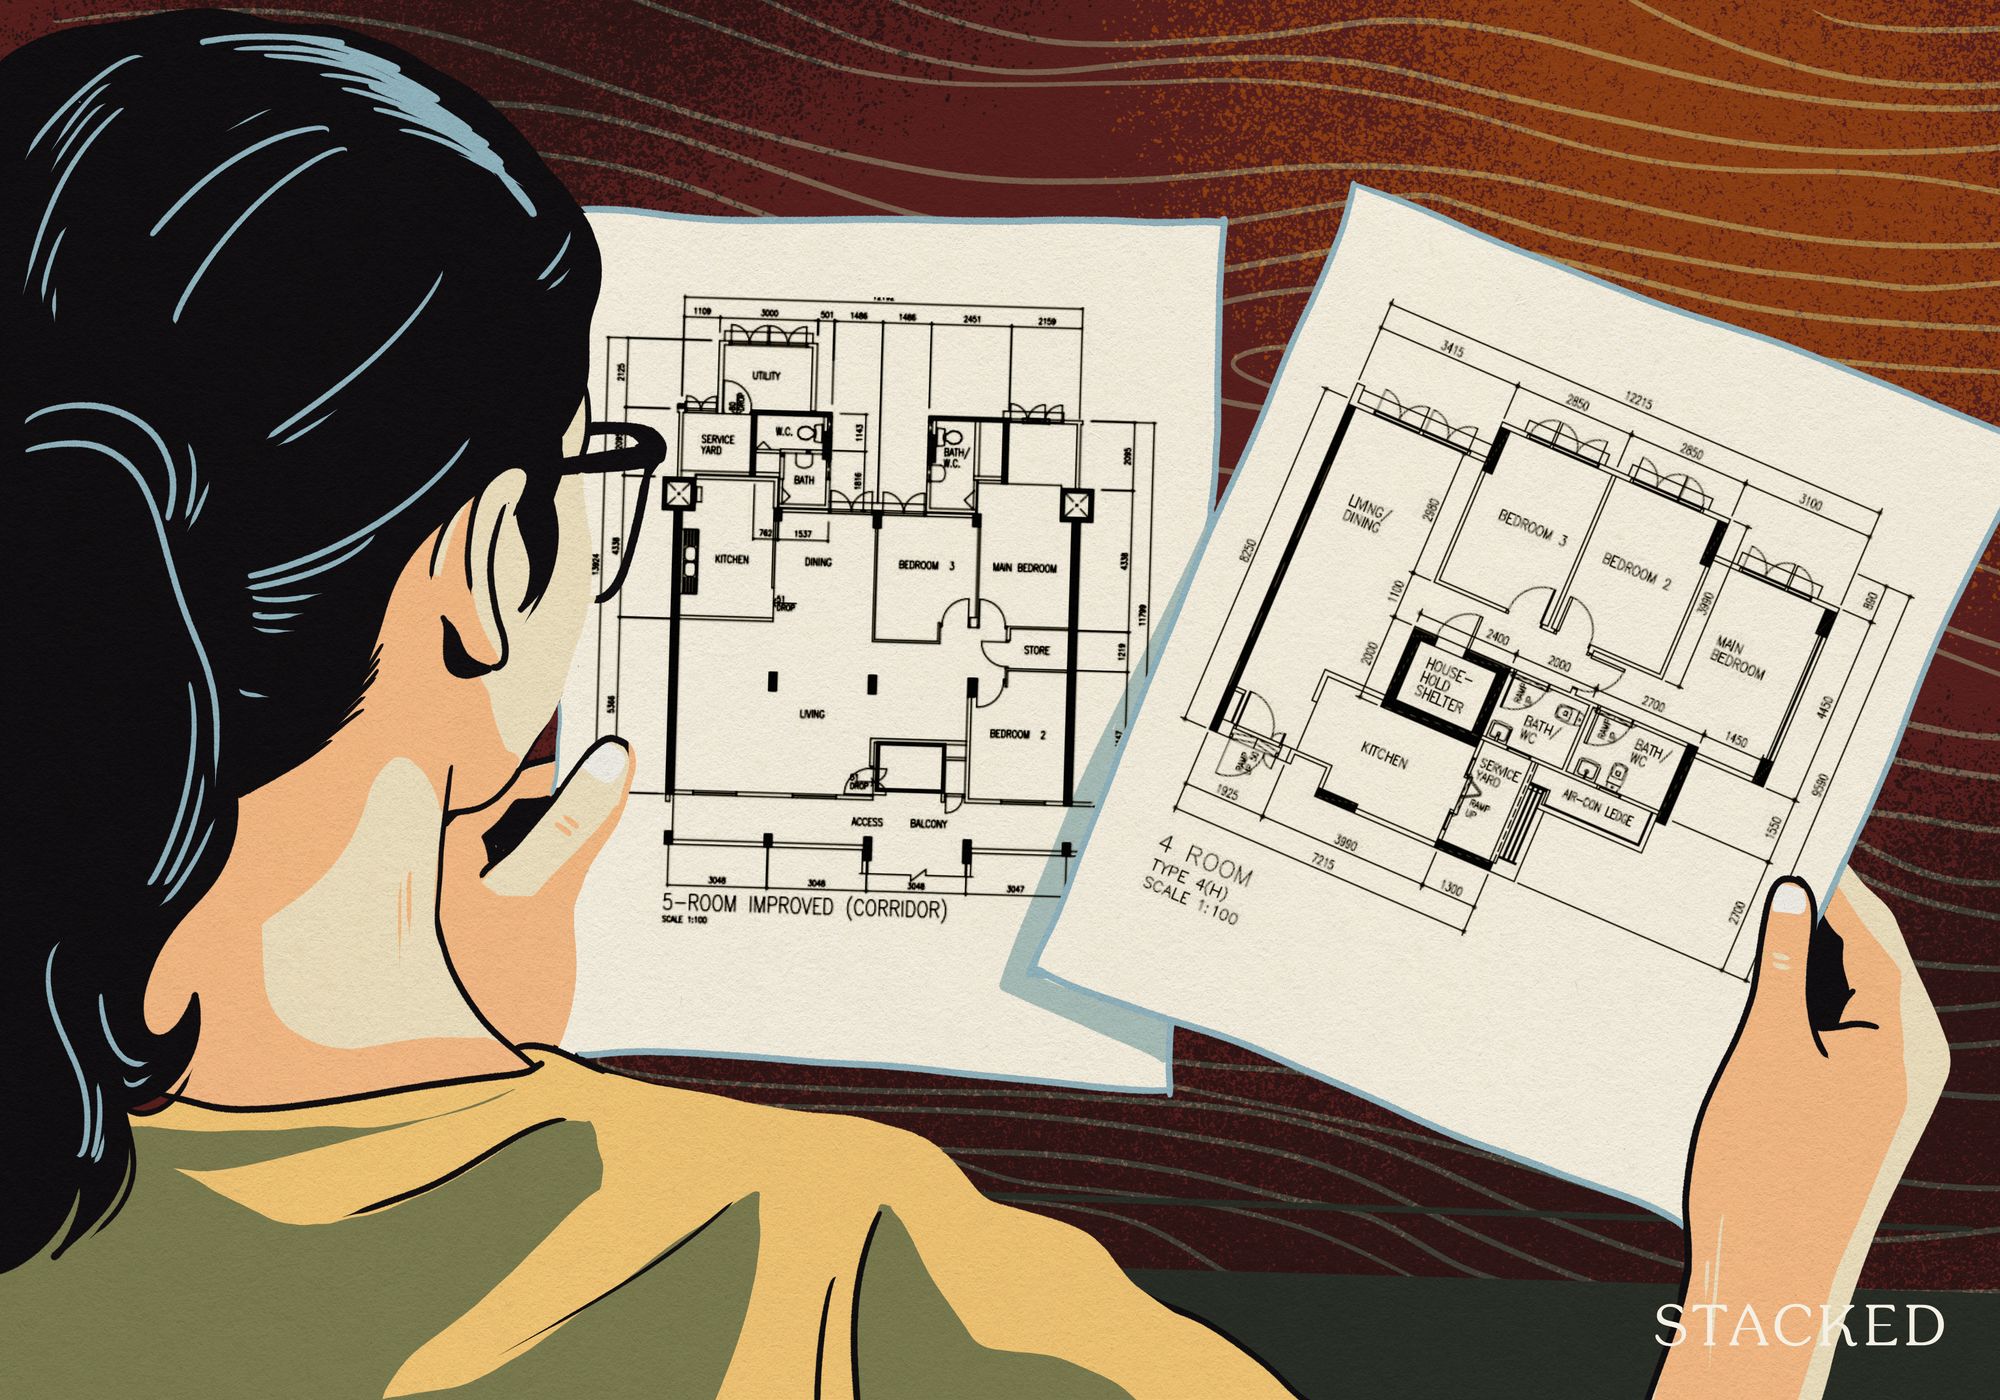
River Modern’s Unit Mix and Layout Design
| Unit Type | Size (sqft) | No. of Units | % of Unit Mix |
| 2 Bedroom | 538 | 70 | 38.5% |
| 2 Bedoom Plus | 646 / 678 / 689 | 105 | |
| 3 Bedroom | 797 / 829 / 904 | 105 | 46.1% |
| 3 Bedroom Flex | 893 | 35 | |
| 3 Bedroom Plus | 1,098 / 1,109 | 70 | |
| 4 Bedroom | 1,464 | 35 | 15.4% |
| 4 Bedroom Plus | 1,830 | 35 |
River Modern joins Zyon Grand, River Green and Promenade Peak as part of the newer batch of post-GFA harmonised projects in this enclave.
In practical terms, this means air-conditioning ledges are no longer included in the stated unit sizes. So while the square footage may look smaller on paper compared to older resale projects nearby, the layouts tend to be more efficient. It also makes psf comparisons across these four launches more straightforward.
In terms of mix, three-bedroom units make up the largest share at 46.1%. That’s a noticeable increase in the overall proportion since Promenade Peak and River Green were more heavily weighted towards two-bedroom units. Zyon Grand also had a strong three-bedroom presence.
Two-bedroom units still account for 38.5% of River Modern’s mix, so it isn’t a drastic shift. But with almost half the development made up of three-bedrooms (and no one-bedroom units at all), the positioning leans more towards own-stay buyers than investors. Given the current ABSD structure, that omission is probably not accidental.
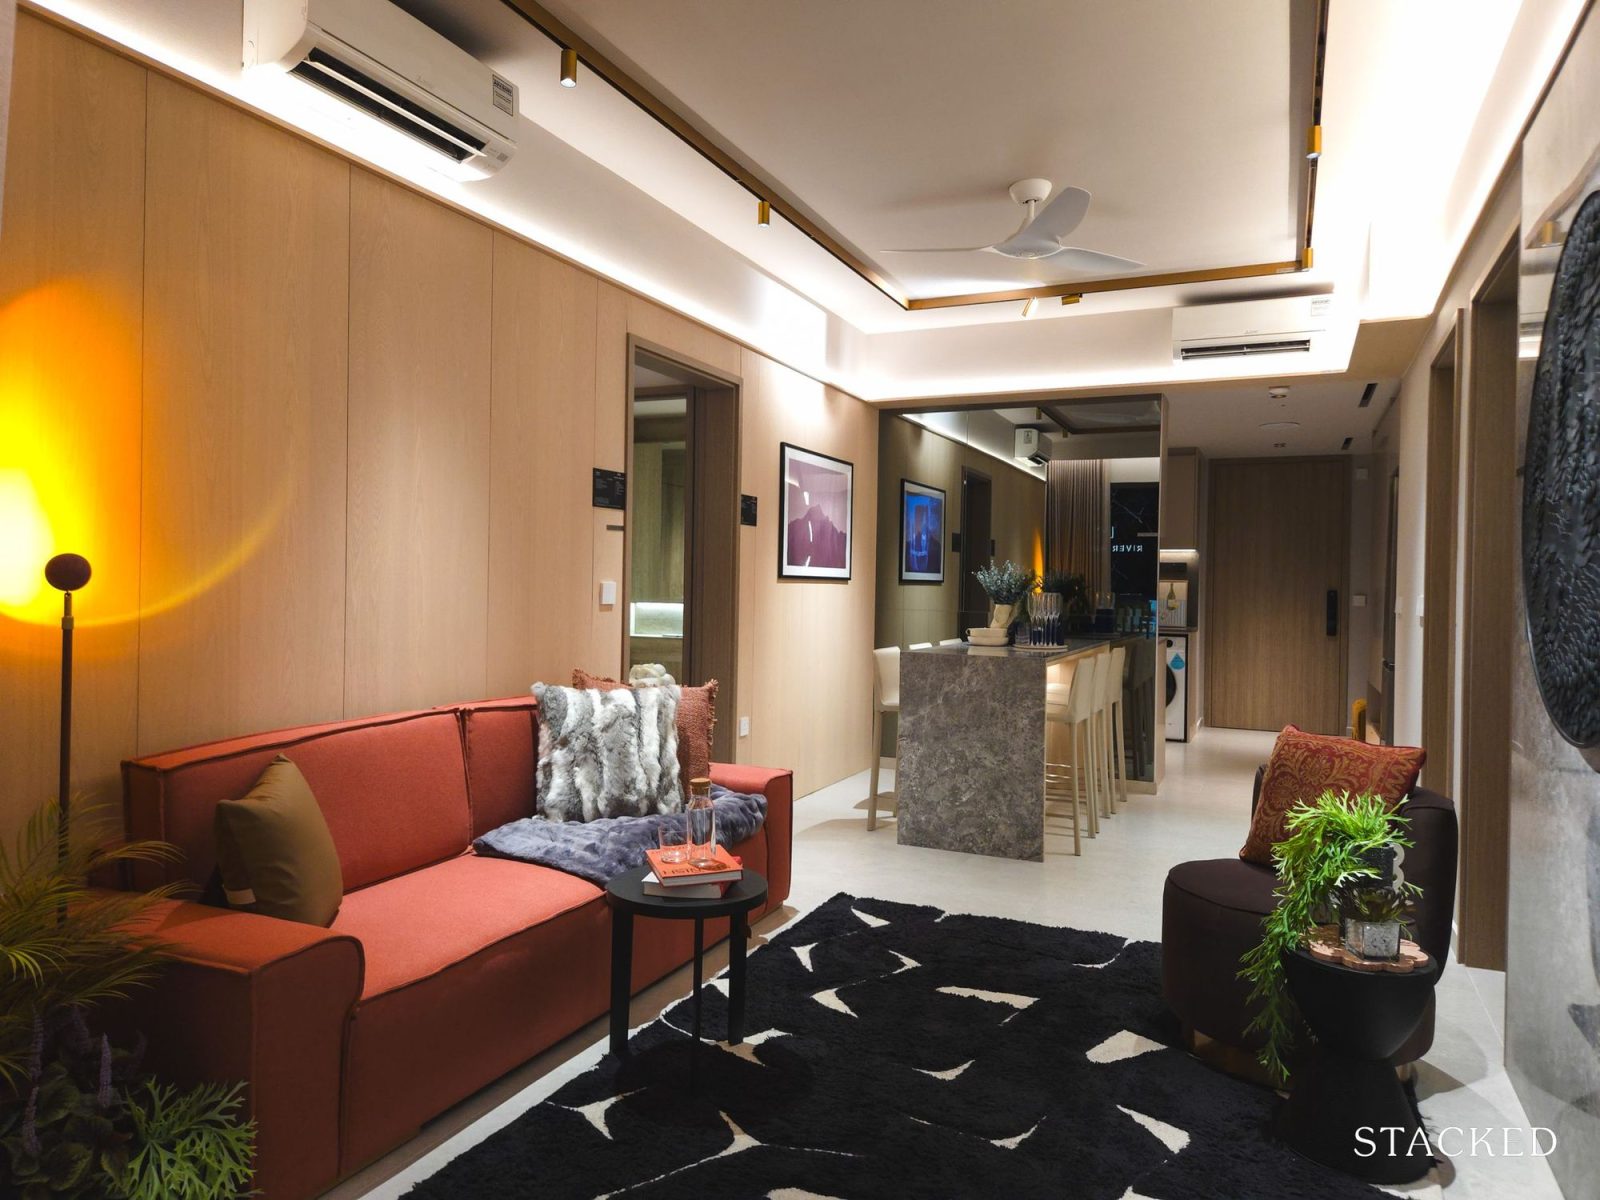
2 Bedroom Showflat – Type B4 (689 sqft)
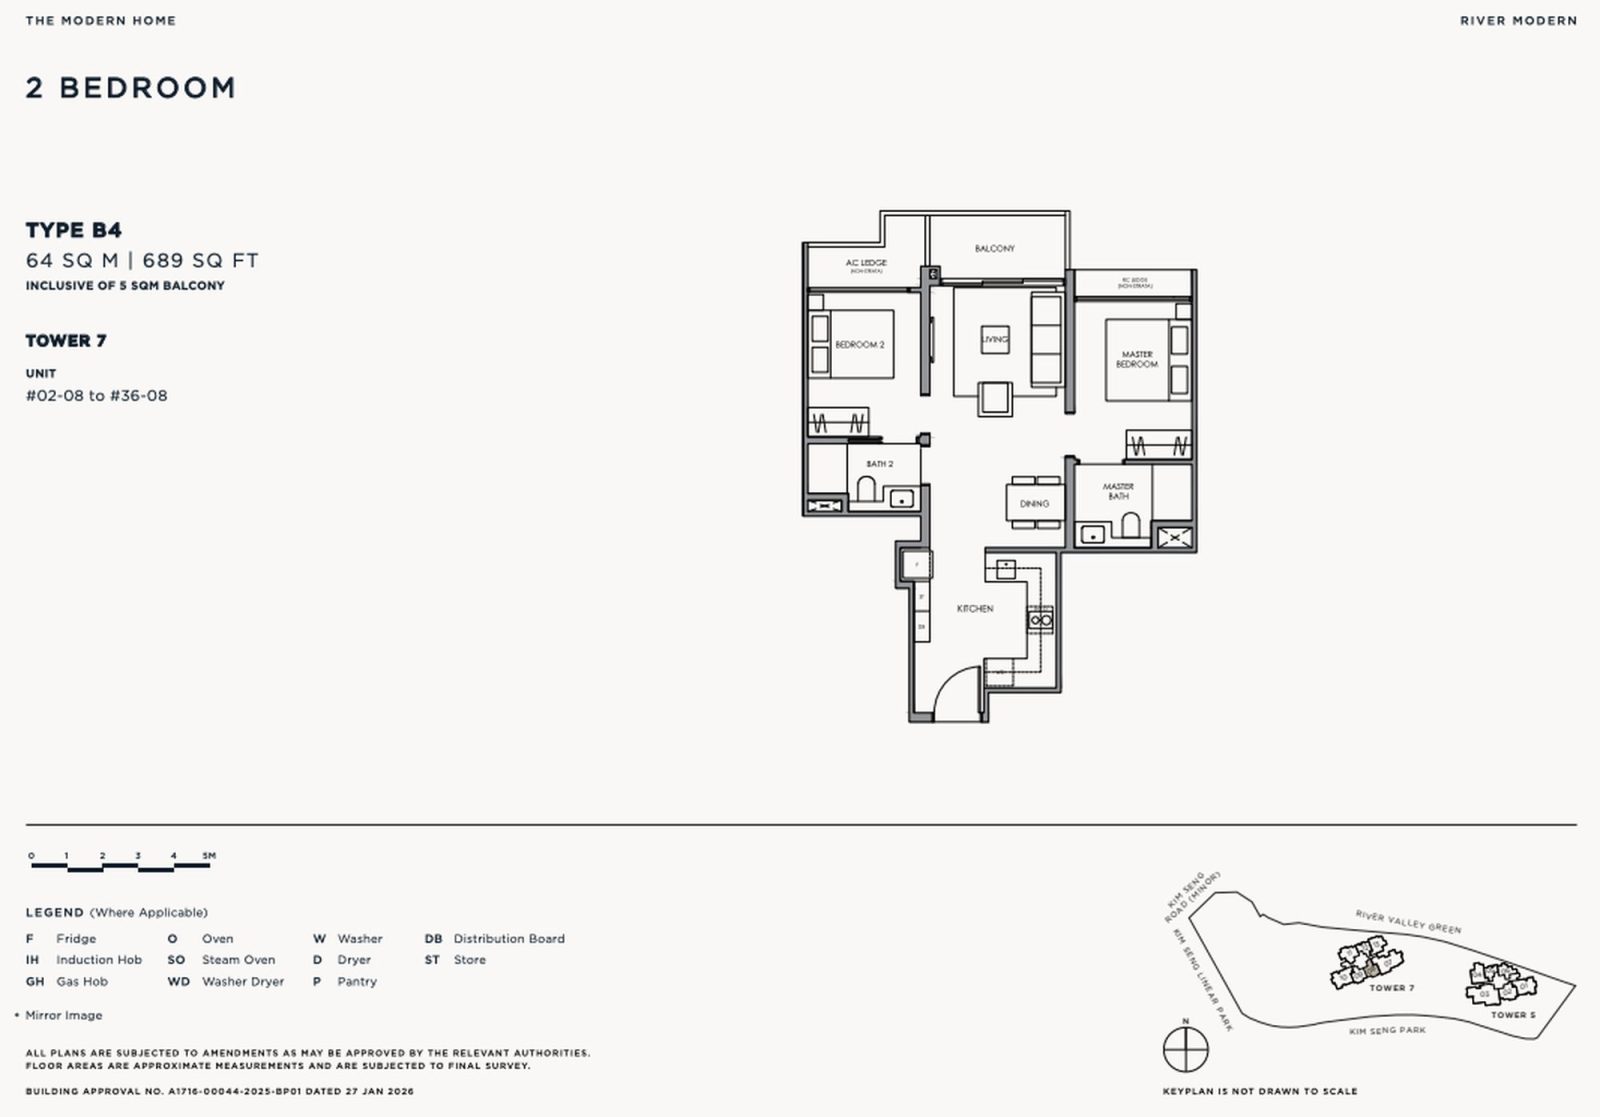
There are two types of two-bedroom configurations at River Modern — the entry-level two-bedroom (538 sq ft) and the two-bedroom Plus, which comes in three sizes (646 / 678 / 689 sq ft). The showflat on display is the largest of the four at 689 sq ft.
Having four two-bedroom variations here is interesting. The 538 sq ft layout clearly targets buyers who just want the lowest entry price, while the Plus versions give you a bit more breathing room.
In reality, two-bedders today are no longer just for couples. In central areas like this, many small families are already making it work, so having that range makes sense here.
All the two-bedroom units use a dumbbell layout, so the bedrooms sit on opposite sides of the living area. It’s a layout most buyers are already familiar with, and for good reason: it works.
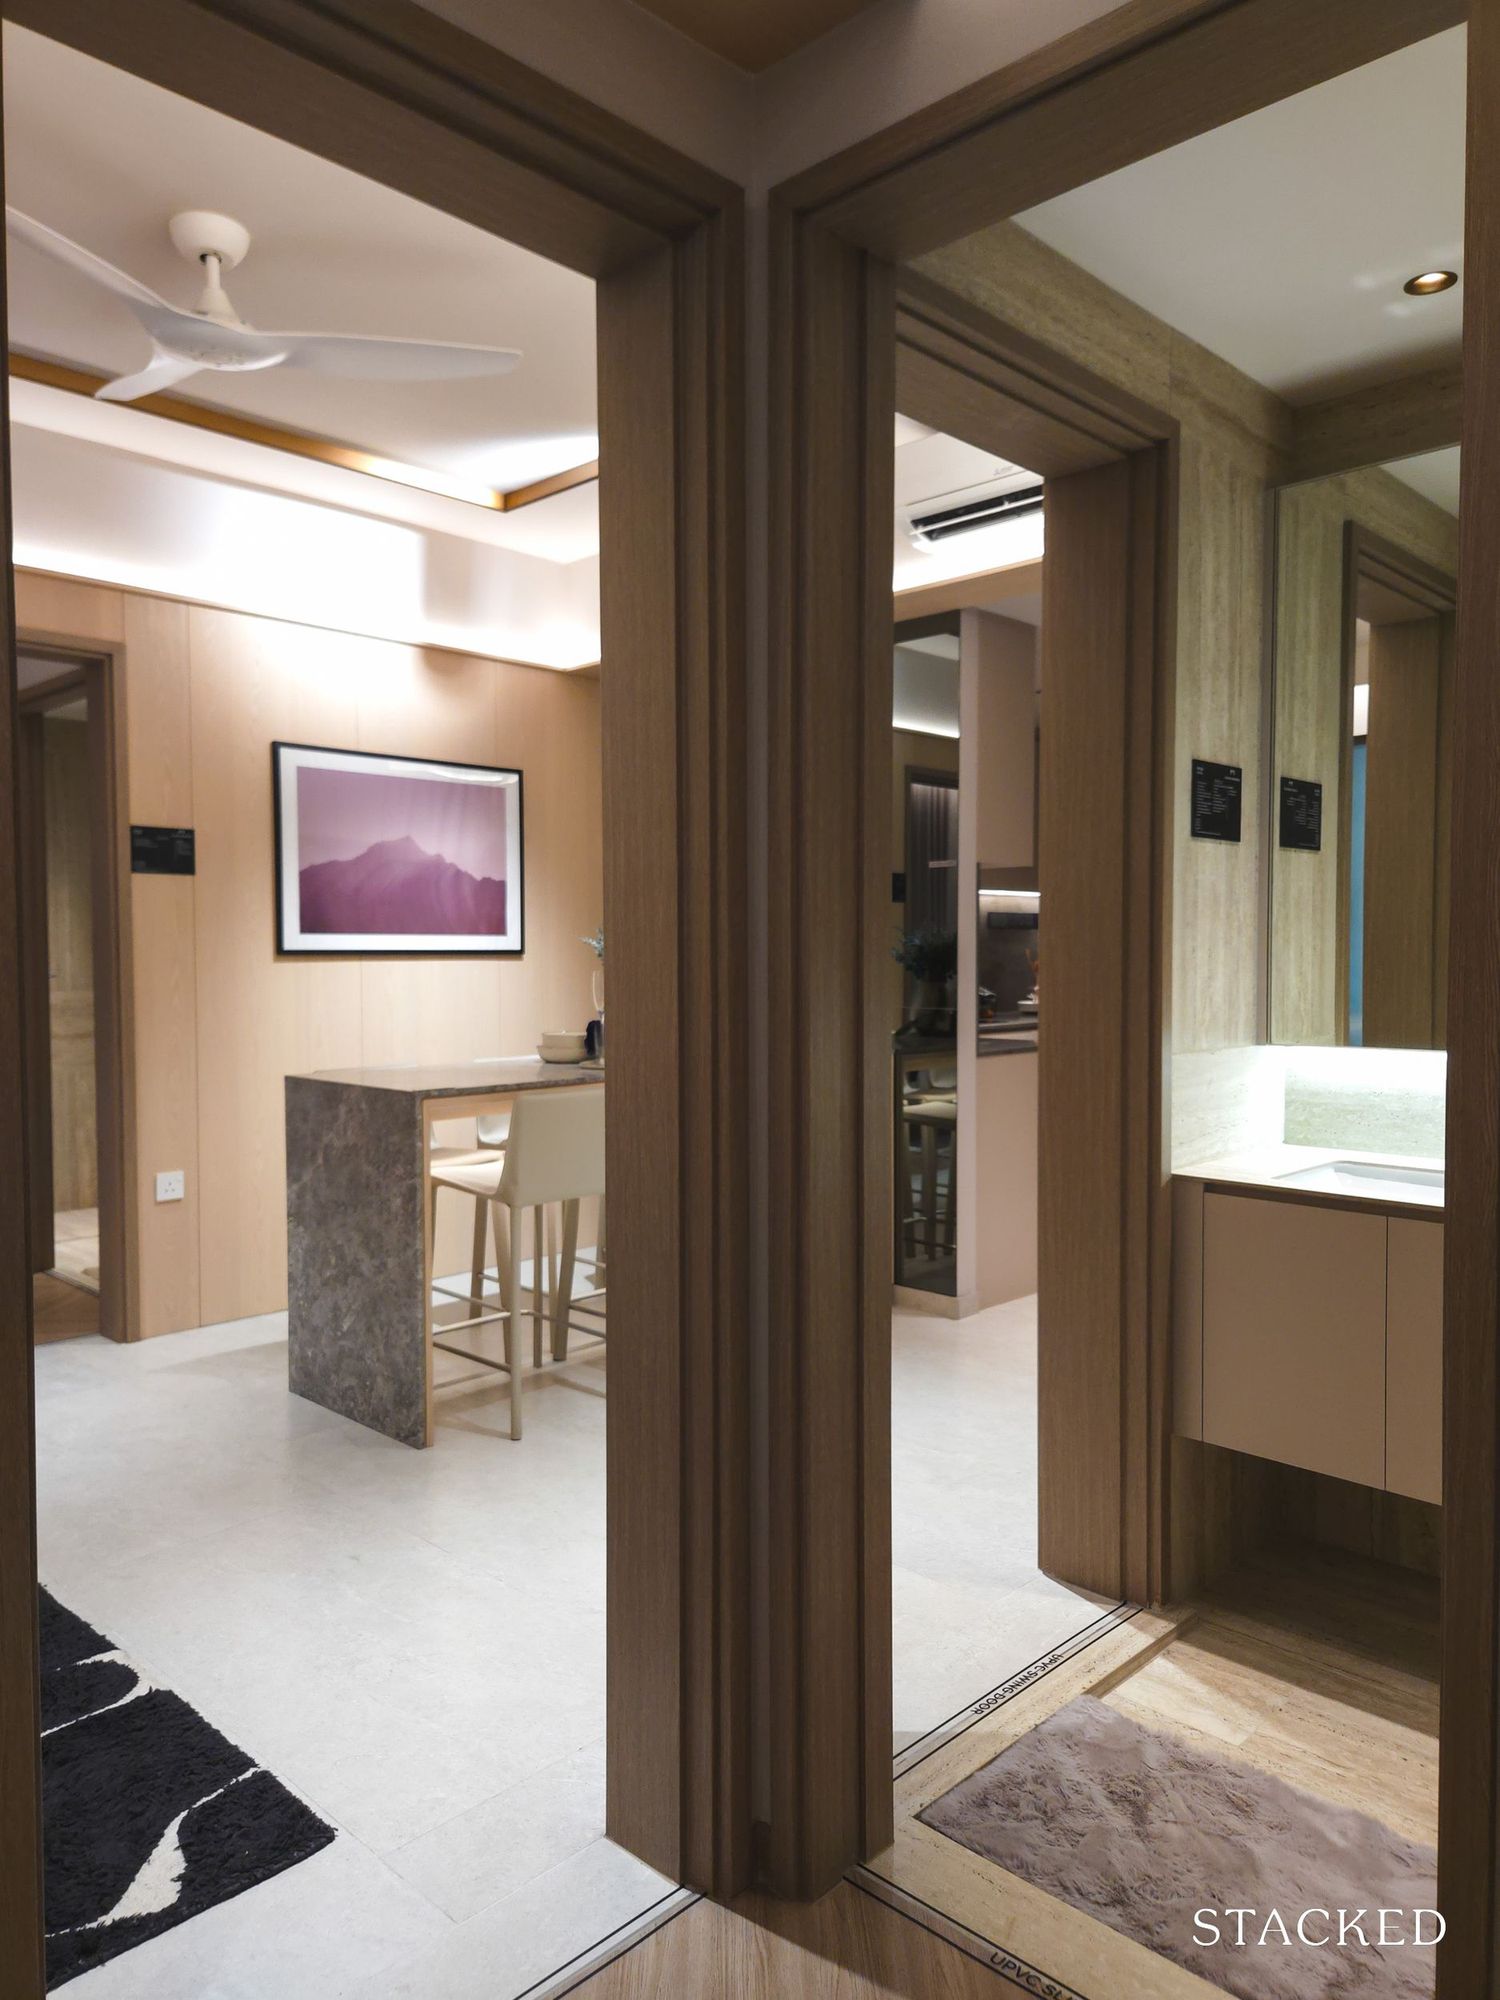
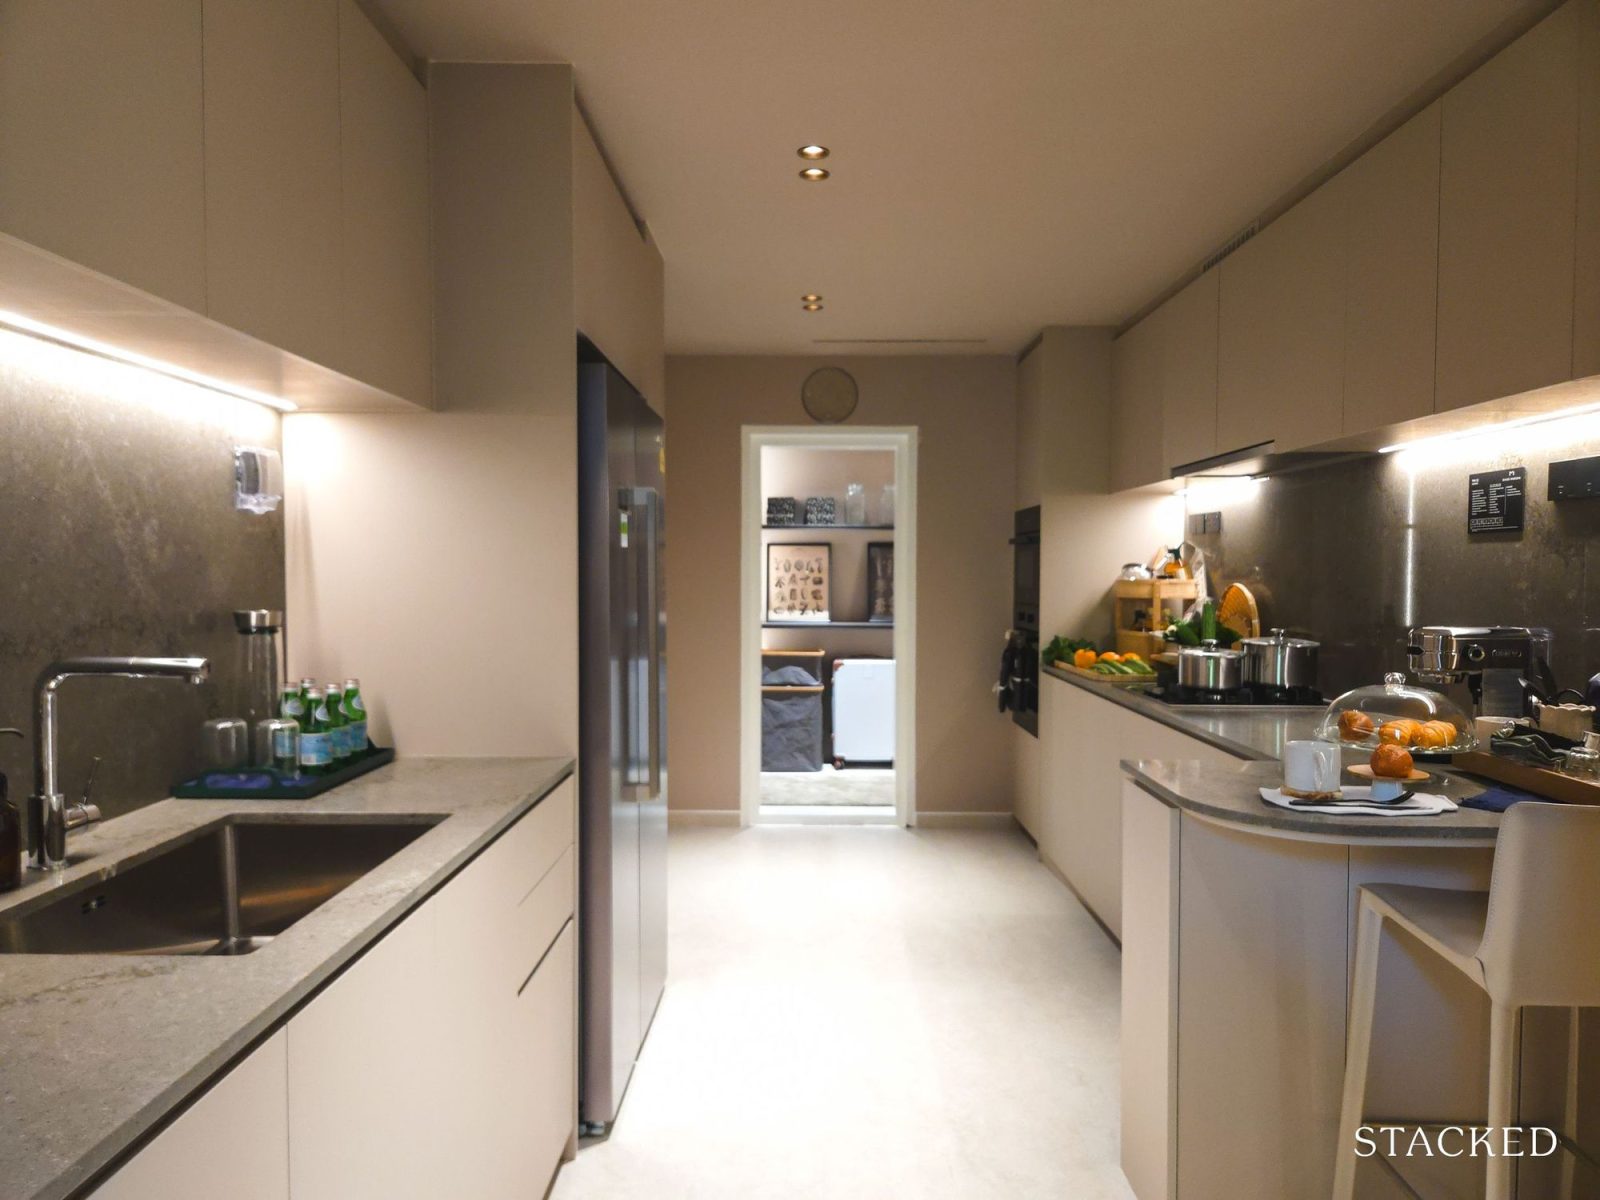
Both bedrooms are ensuites with the common bathroom designed in a Jack-and-Jill style so guests can access it too. The kitchen isn’t a tight galley; there’s a small recessed section that makes it feel a bit less corridor-like.
It’s not a kitchen you’d be hosting big dinners in, but for simple everyday cooking, it does the job. From the main entrance, the unit opens directly into the kitchen, skipping the foyer, which makes sense given the compact size.
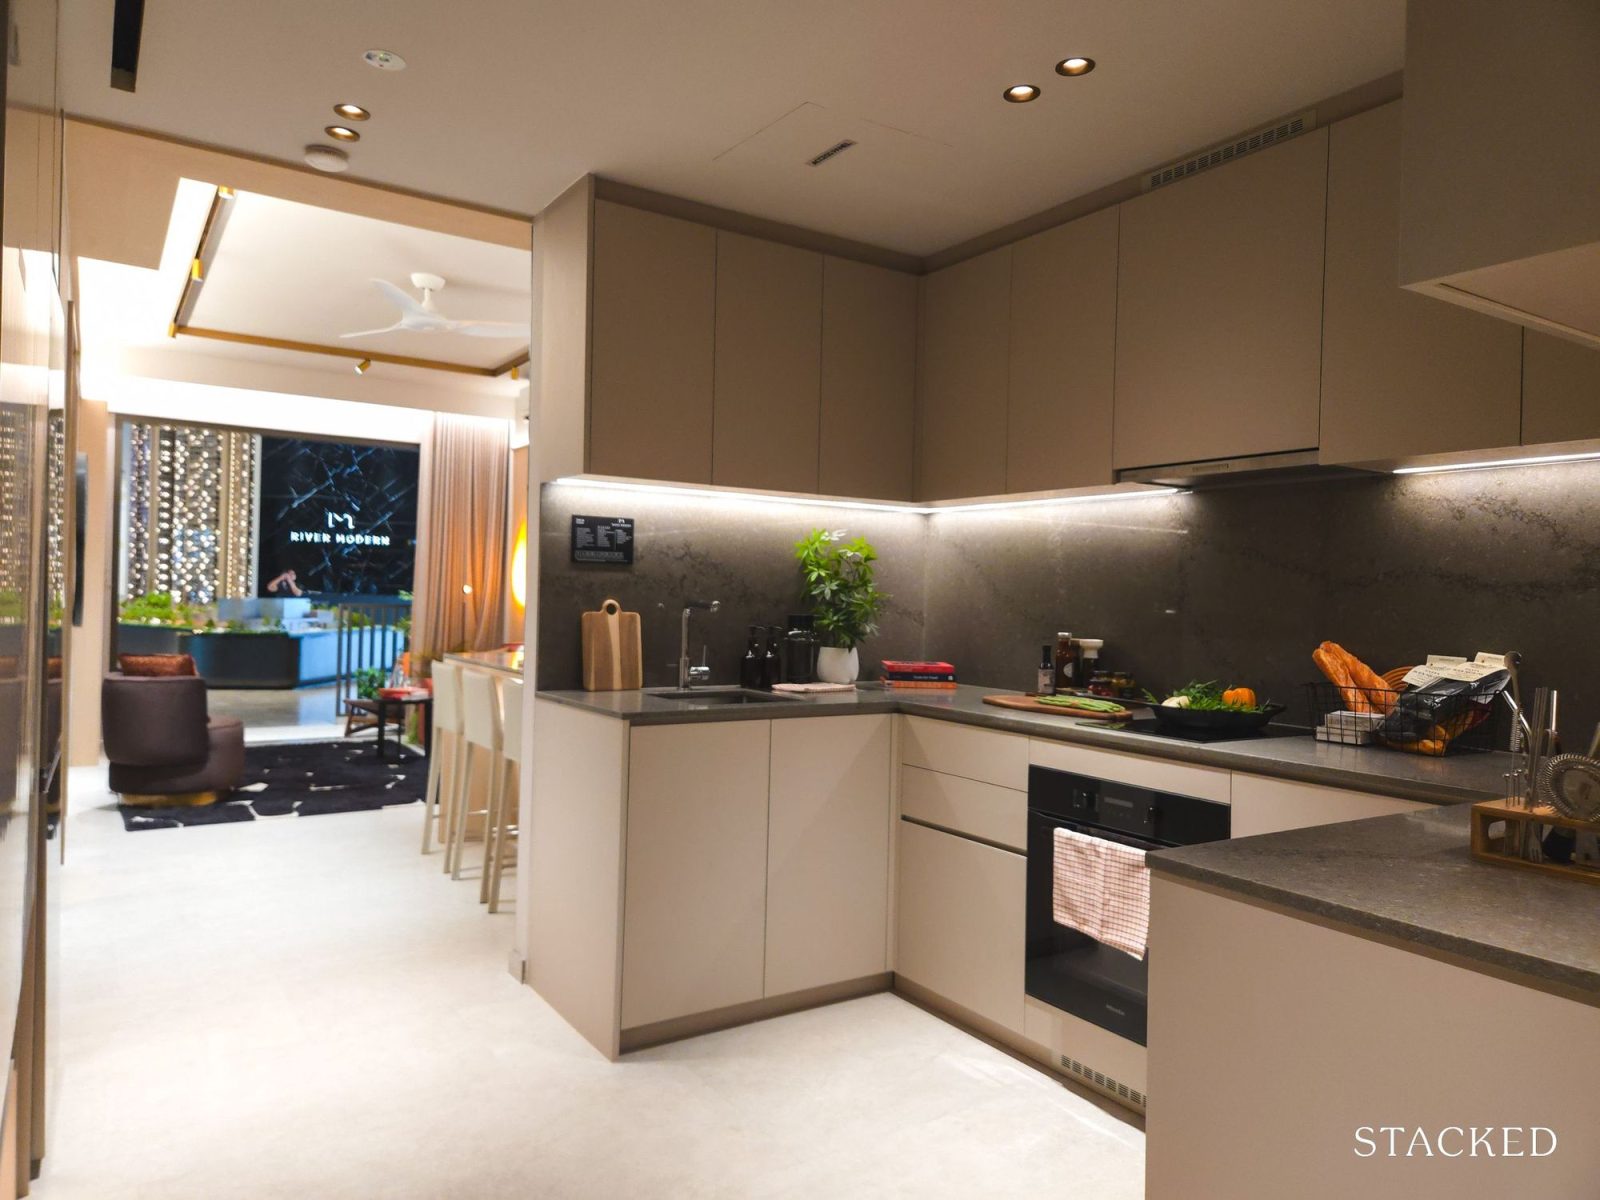
Appliances are fairly standard for this segment of buyer it is targeting: Miele oven, induction hob and hood, Blanco sink and mixer, and a Smeg fridge and washer-dryer. Finishes include quartz backsplash surfaces, porcelain tiles in the living area and vinyl flooring in the bedrooms. Ceiling height stands at about 2.825m.
One small detail that stands out is the herringbone vinyl flooring in the bedrooms. It’s not common in Singapore, and you can tell it costs the developer more, but visually, it does elevate the room a bit.
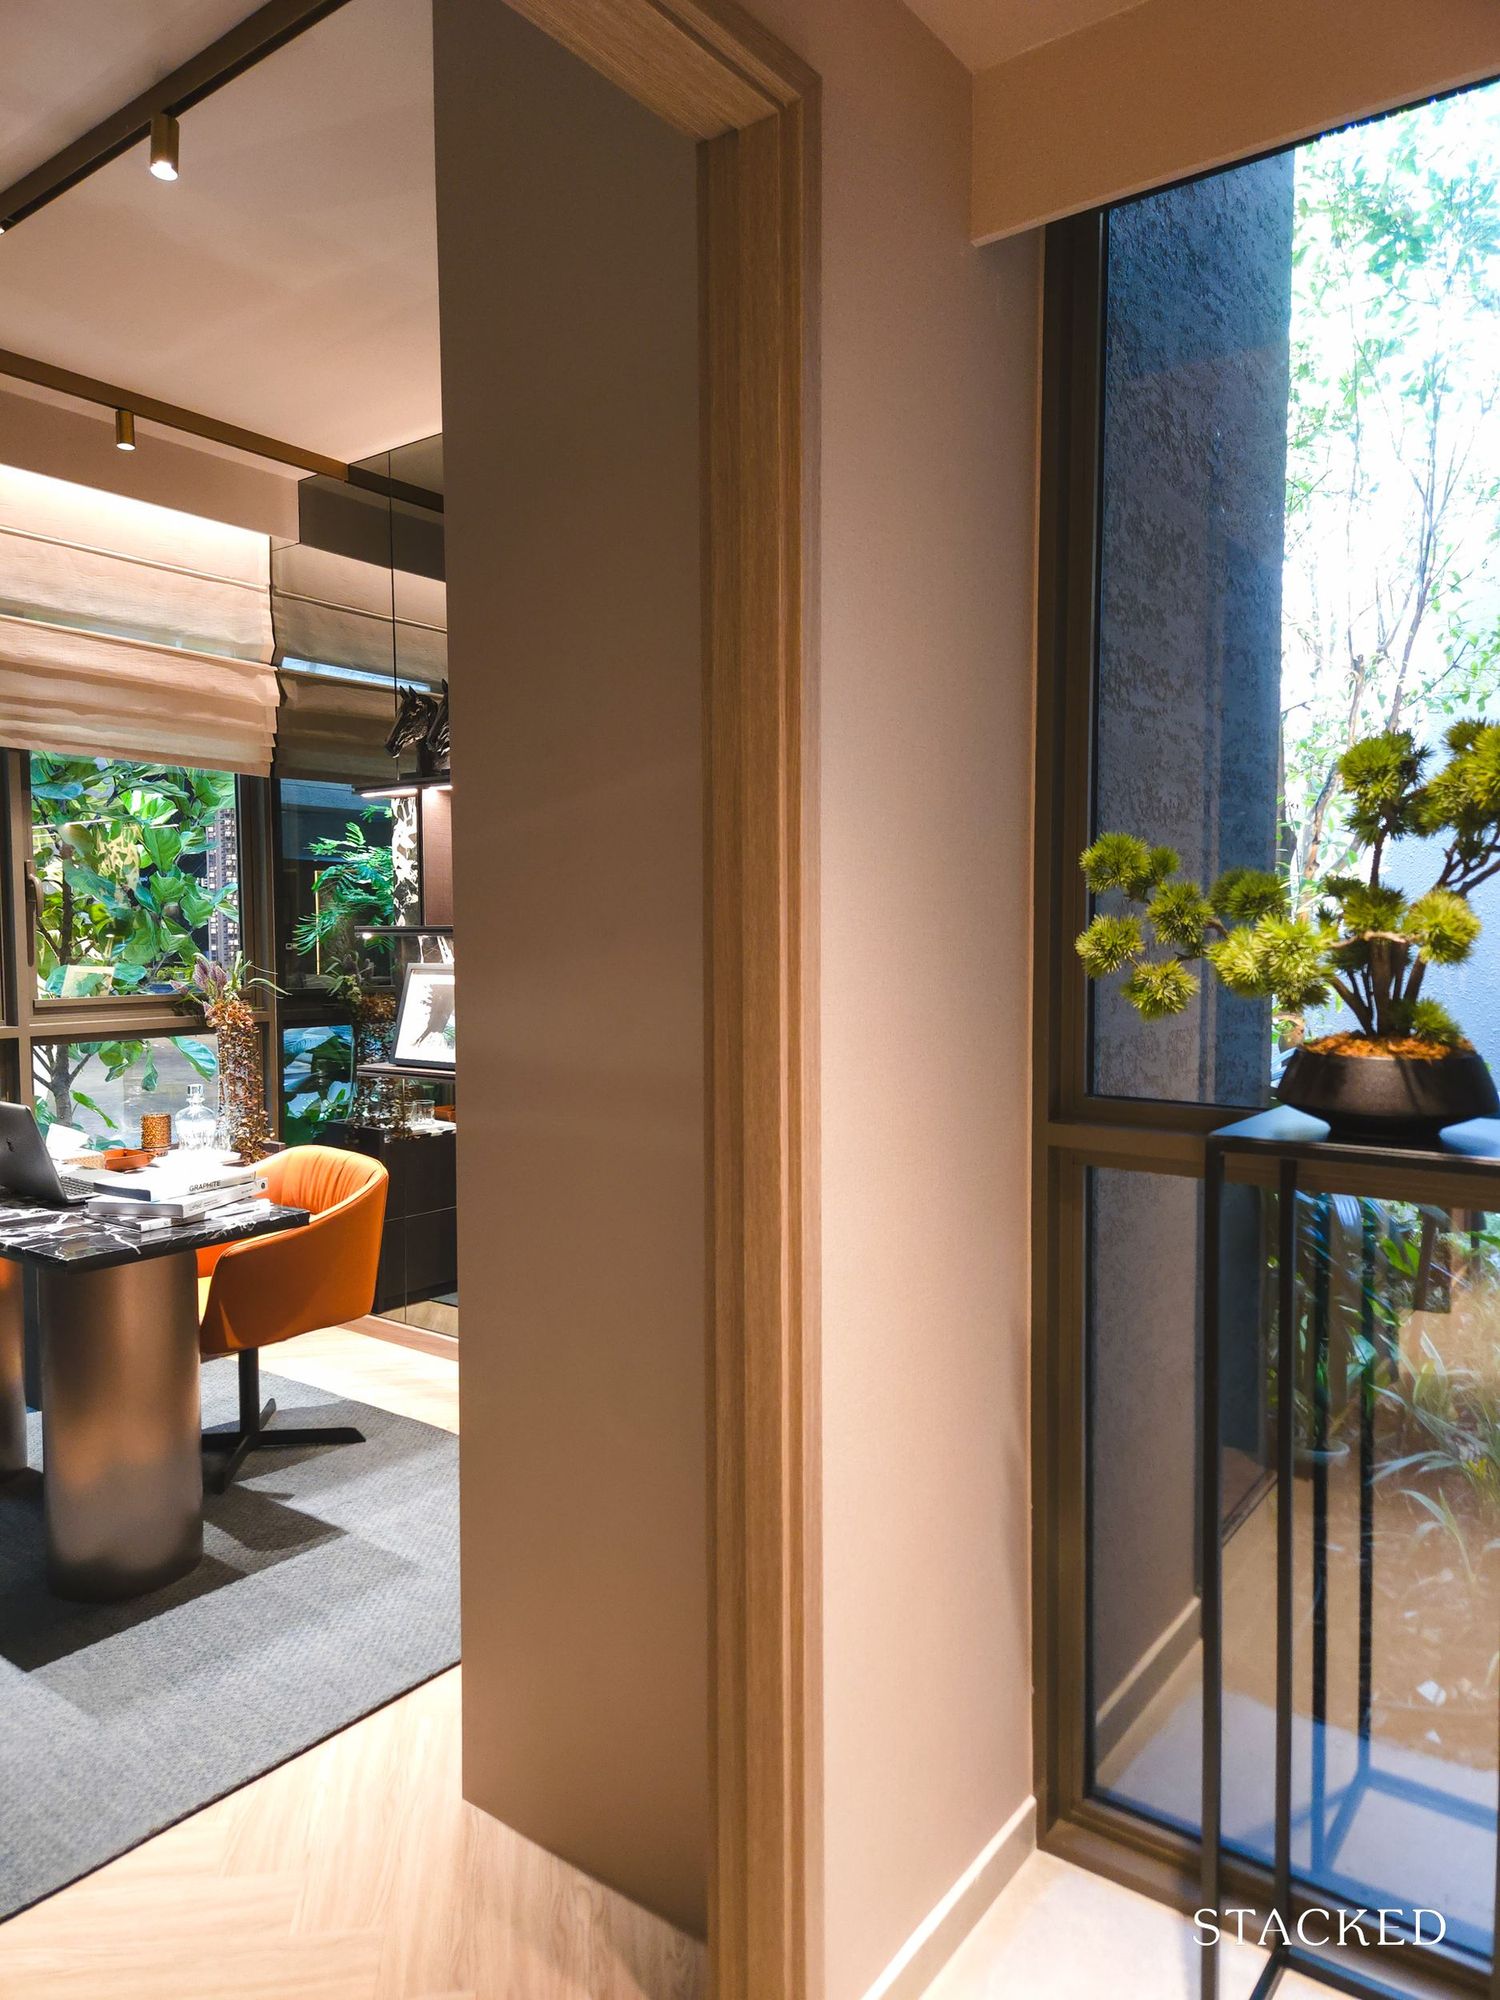
The living and dining area is straightforward. A four-seater dining table fits comfortably, and the living space can take a three-seater sofa with a TV console without feeling tight. A ceiling fan is pre-installed. The balcony extends from the living room, though its depth is slightly compact, so it’s better suited for light seating rather than a full outdoor dining set. It does come with a water and power point.
Seeing that this unit type faces Kim Seng Park and the river, the balcony becomes a meaningful extension of the living space.
The common bedroom can accommodate a queen-sized bed and features a built-in wardrobe with a practical dual-functional component: sliding doors below and swing cabinets above. Due to the placement of the AC ledge, this room does not enjoy full-height windows.
The common bathroom is designed in a Jack-and-Jill format, so it connects directly to Bedroom 2 while still being accessible from the living area for guests. In practice, this means Bedroom 2 functions almost like a junior ensuite.
There are no windows in this bathroom, so it will rely on mechanical ventilation. Fittings are fairly standard for this segment. You’ll find a wall-hung WC, basin and shower mixer from Duravit.
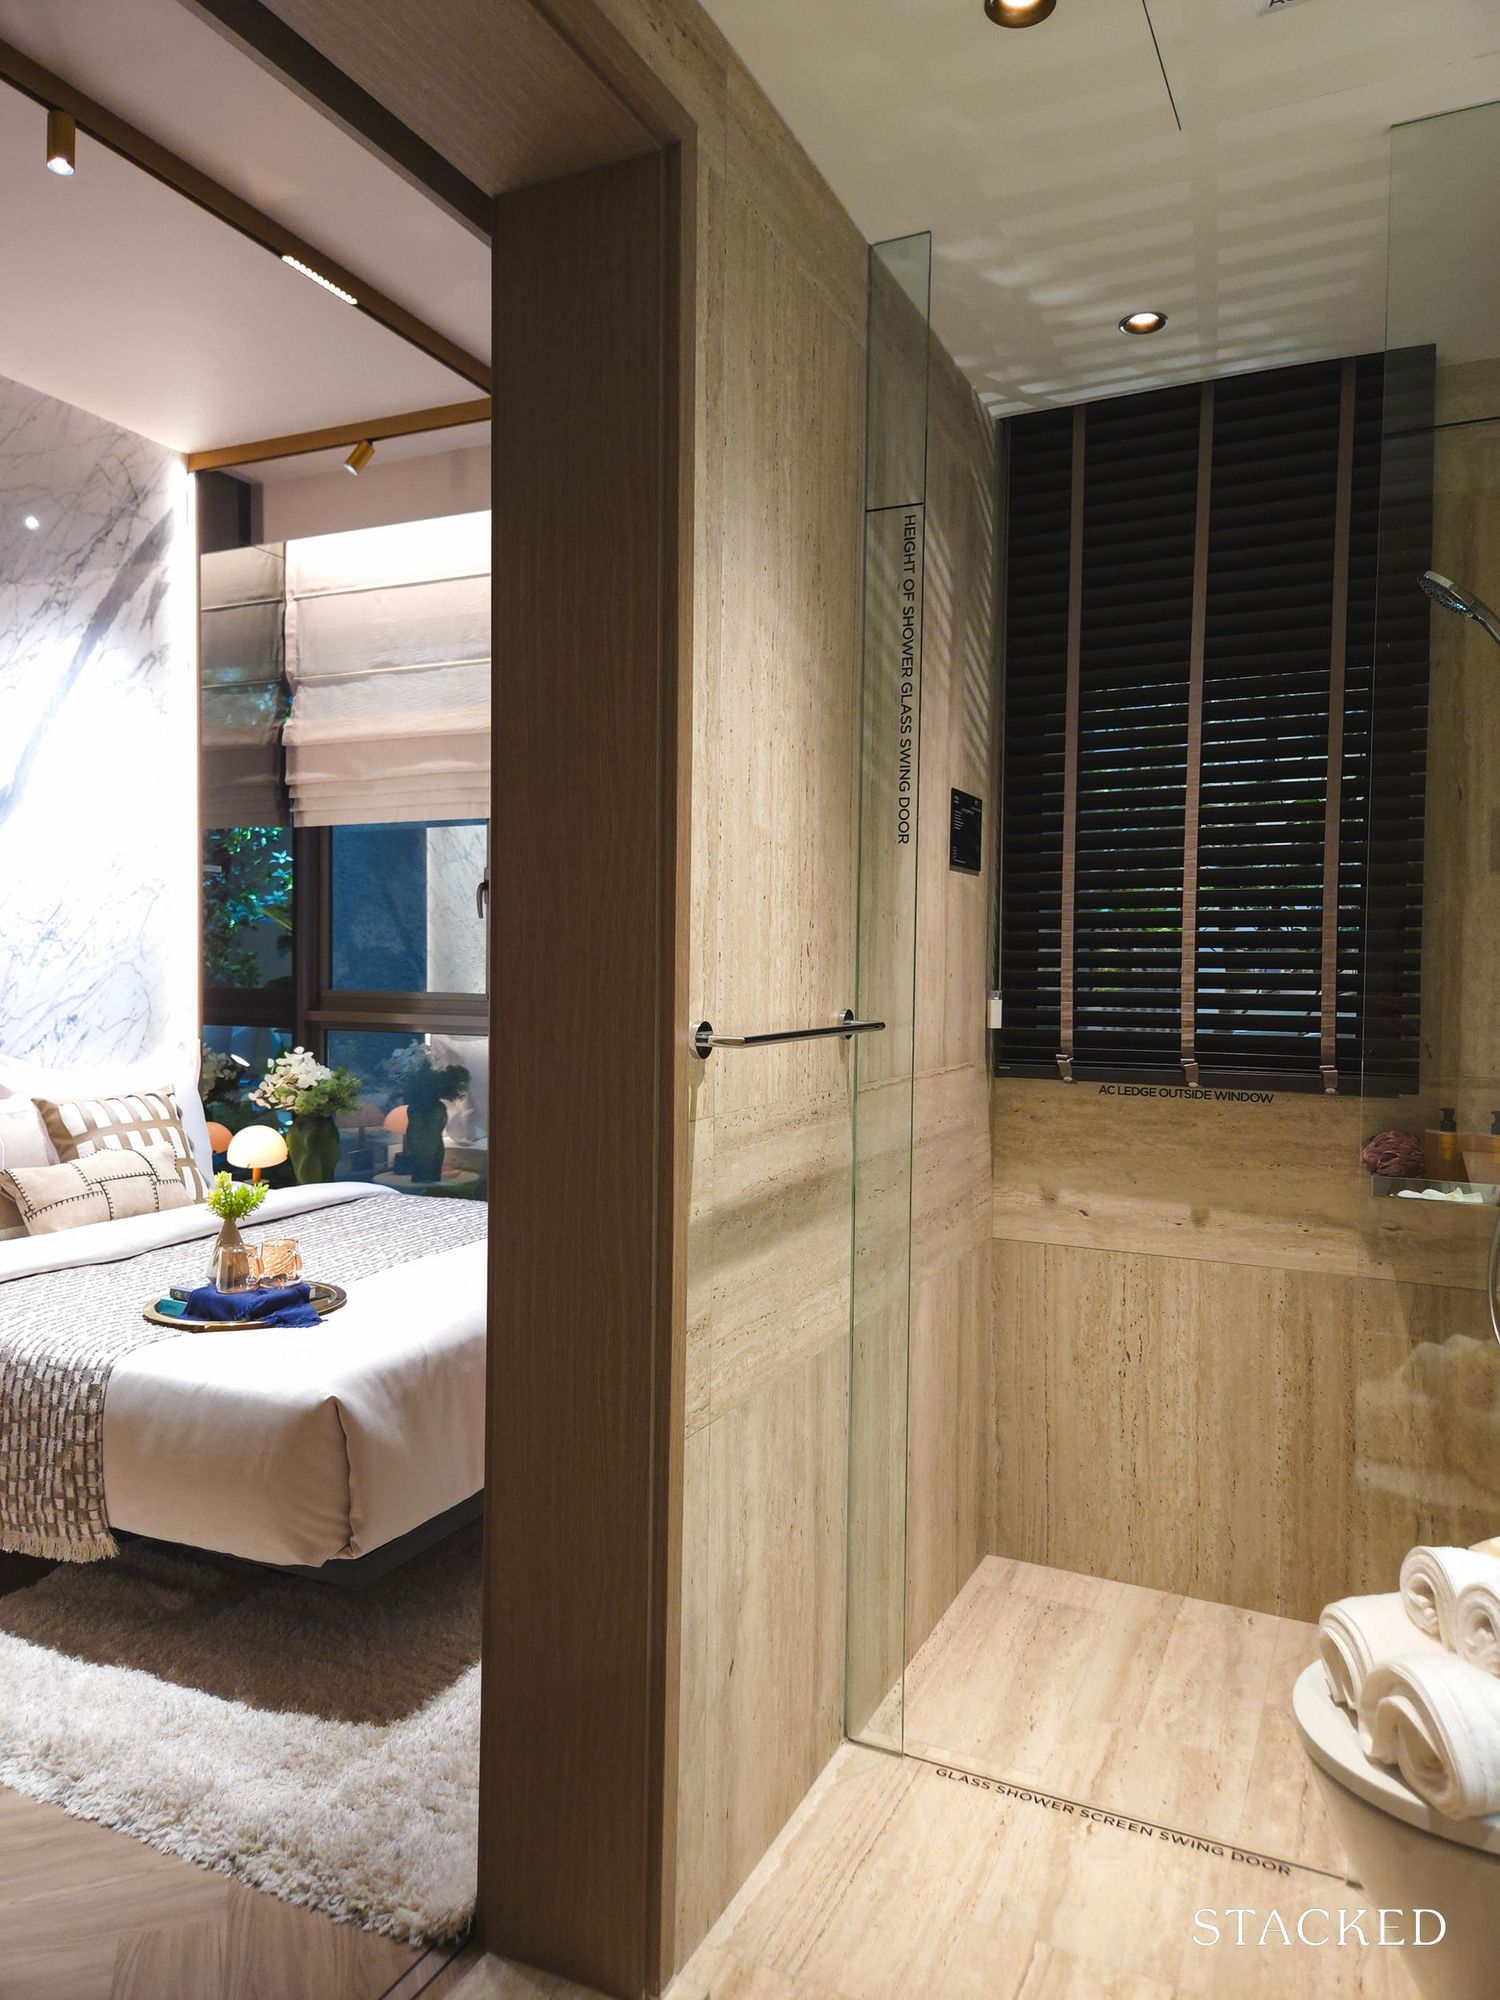
On the other hand, the master bedroom can accommodate a king-sized bed and benefits from full-height windows, which makes it feel noticeably brighter compared to Bedroom 2. The master bathroom is also ensuite and shares all the same components as the common bathroom, though it does come with an additional rain shower, also from Duravit.
Overall, this is a fairly typical two-bedroom layout for a new launch today: efficient, regular in shape, and easy to furnish.
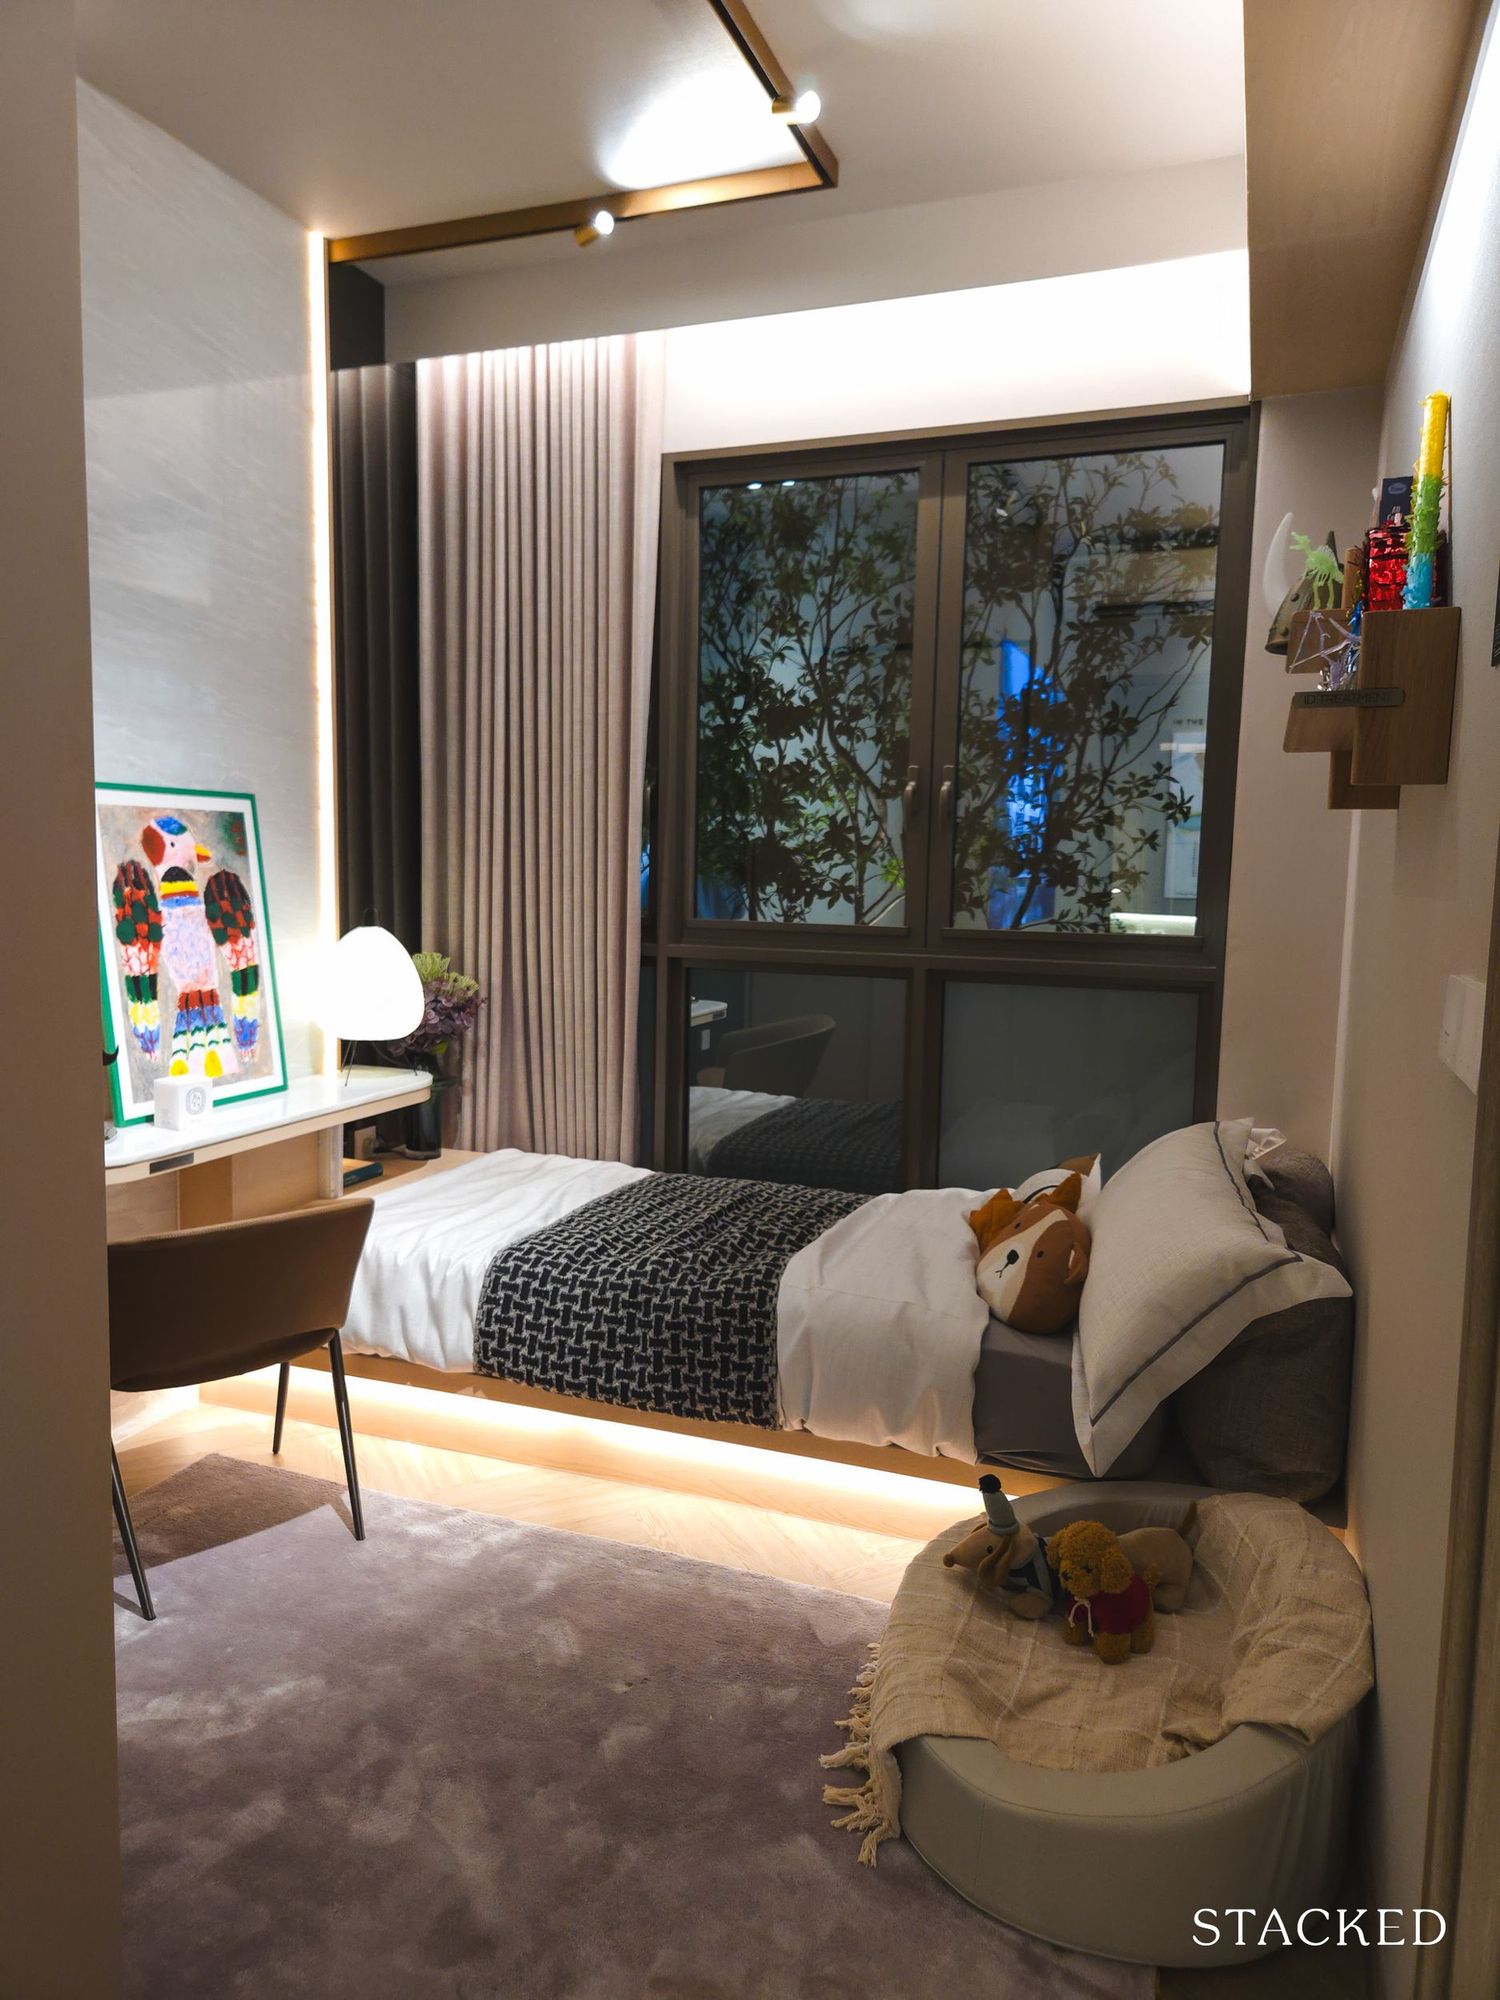
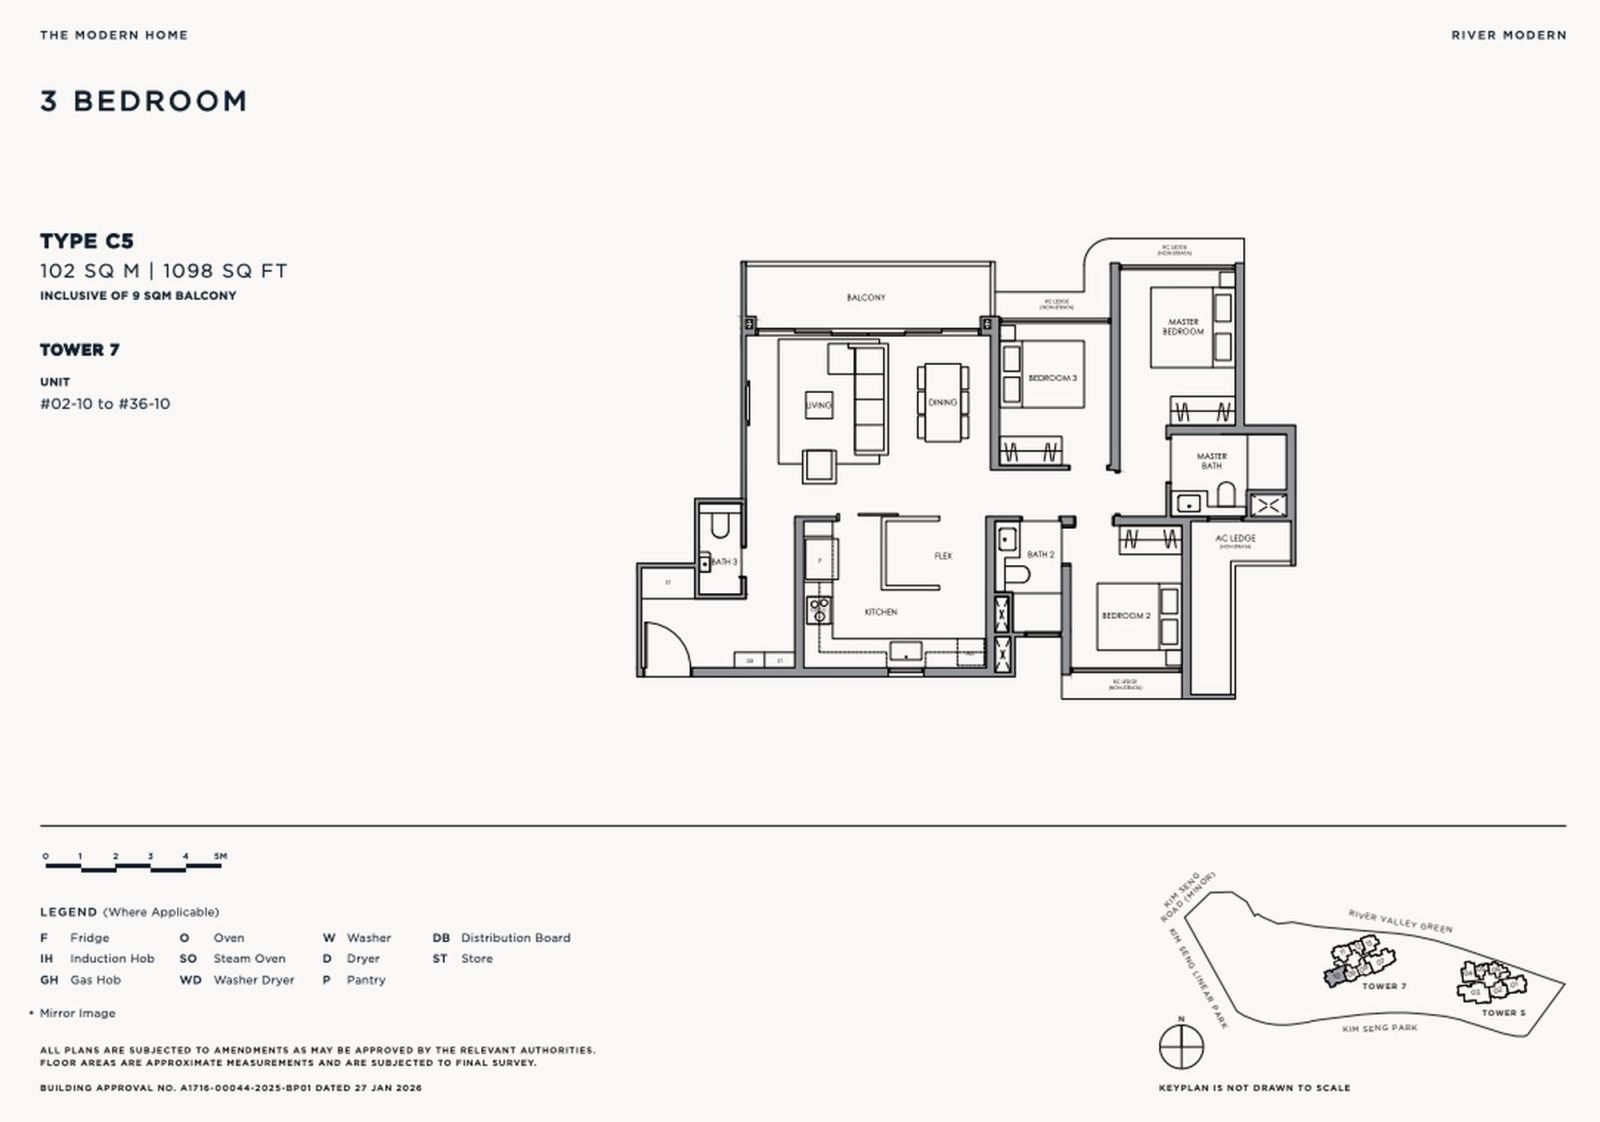
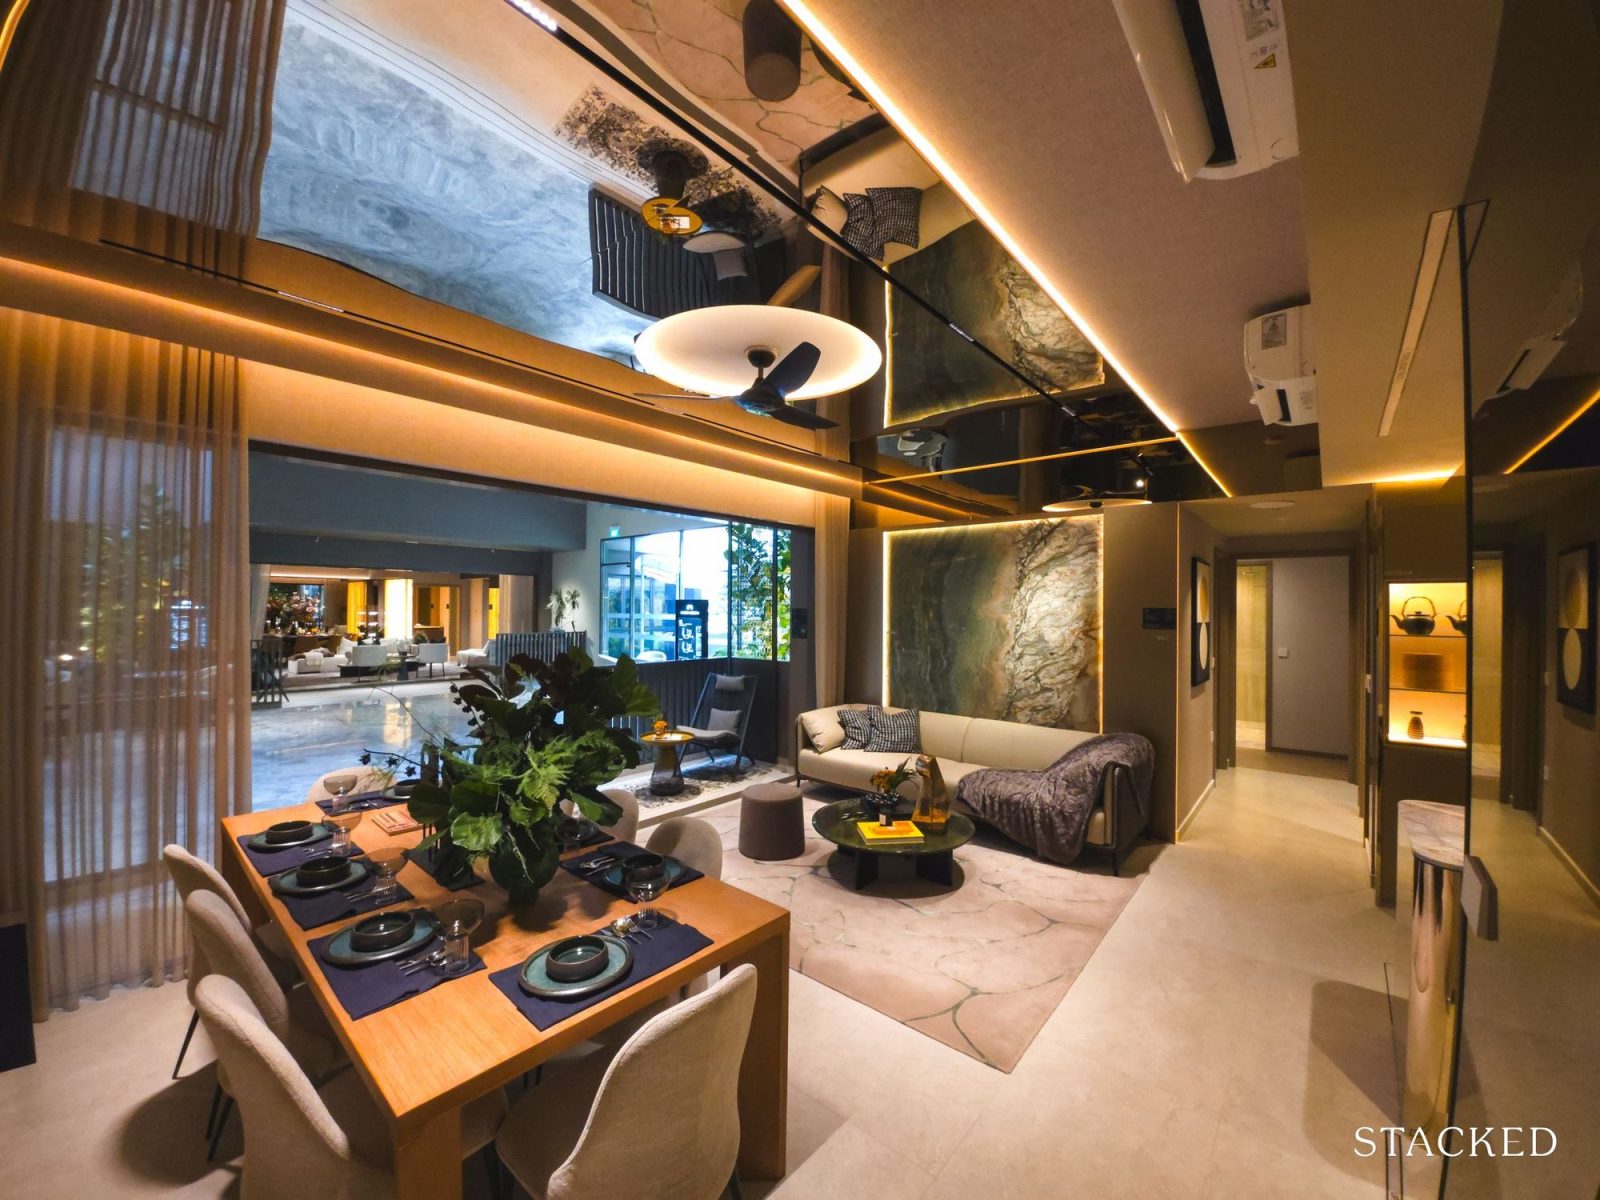
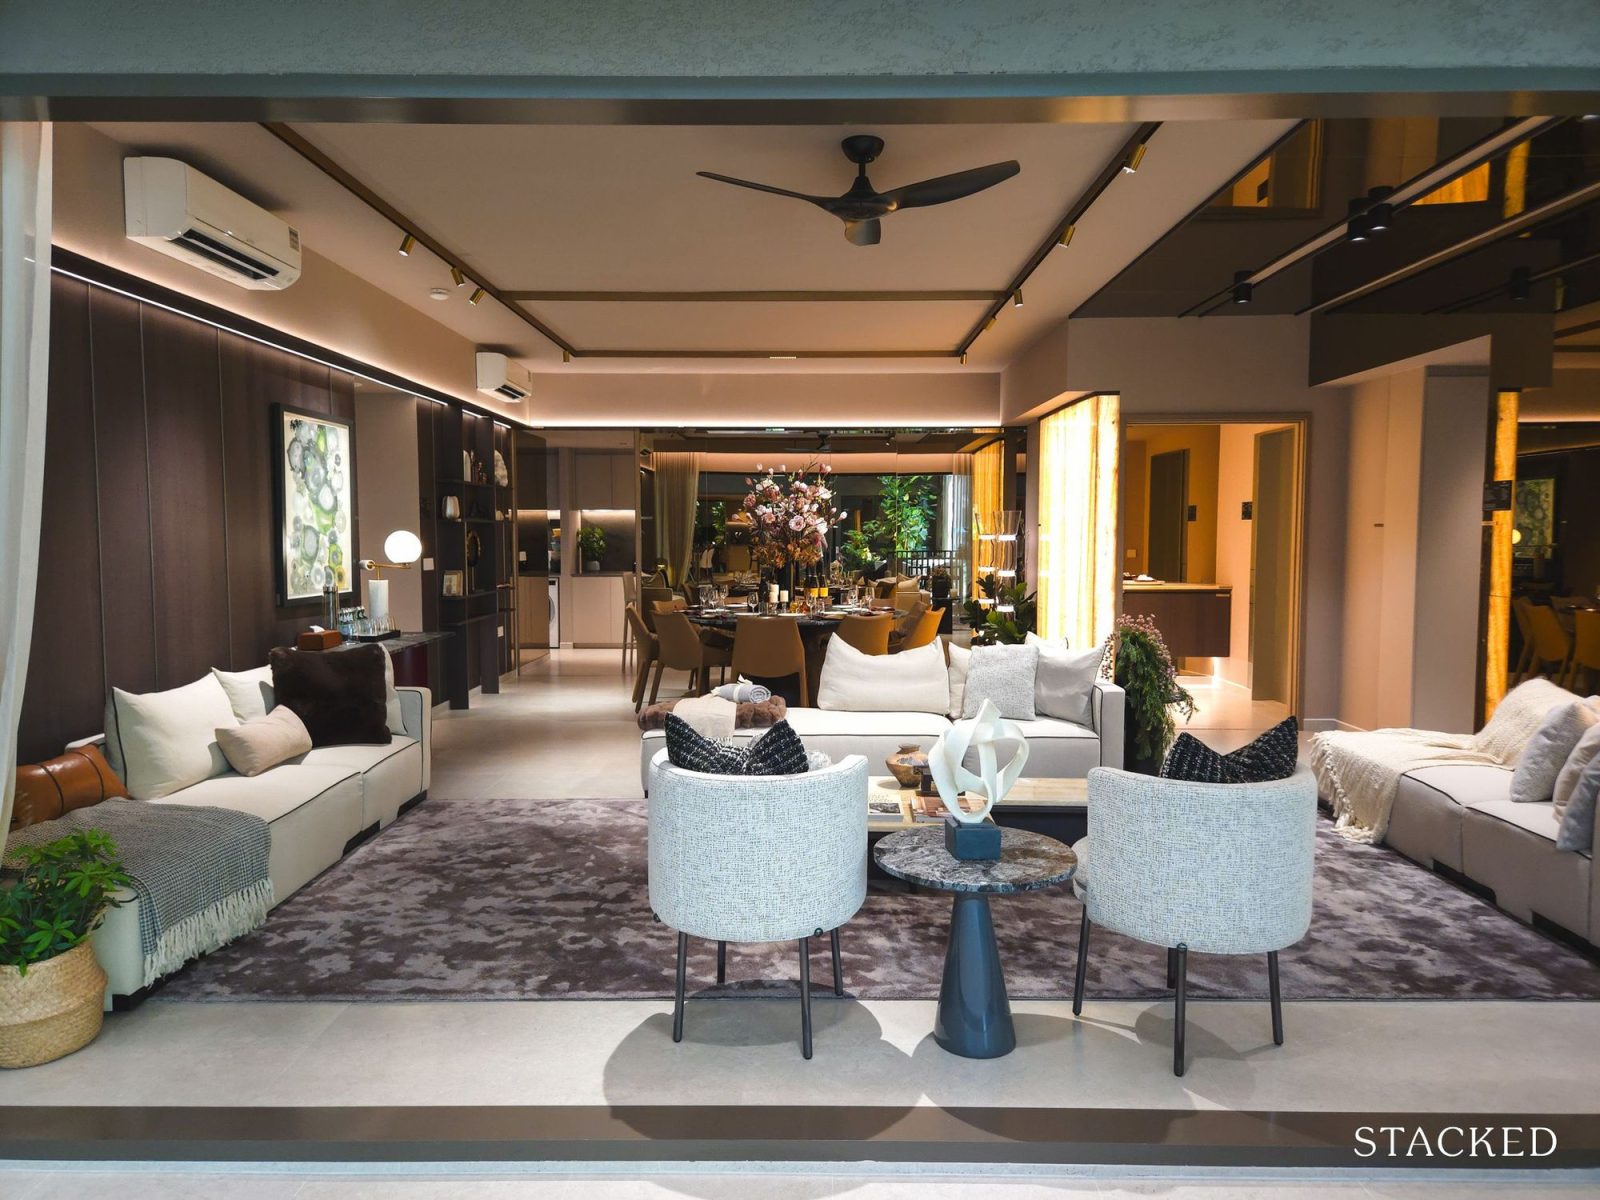
3 Bedroom Plus Showflat – Type C5 (1,098 sqft)
As mentioned earlier, three-bedroom units form the largest share of the mix at 46.1%, which suggests GuocoLand is clearly targeting family buyers here.
There are three configurations: the standard three-bedroom, the three-bedroom Flex and the three-bedroom Plus. The showflat features the smaller three-bedroom Plus at 1,098 sq ft, and even at this size, it feels relatively generous by today’s standards.
At first glance, the space doesn’t immediately strike most people as a typical three-bedder. The wide frontage and the way the kitchen integrates with the living area make it feel closer to a four-bedder instead. Besides the three bedrooms, you get two bathrooms and a powder room, which is always useful for households that host frequently.
Finishes are consistent with the rest of the project. Porcelain tiles in the living areas, vinyl flooring in the bedrooms, and ceiling heights of about 2.825m. Similar to the two-bedroom units, the bedrooms here use herringbone vinyl, which is quite a step up from the standard flooring found in most new launch condos.
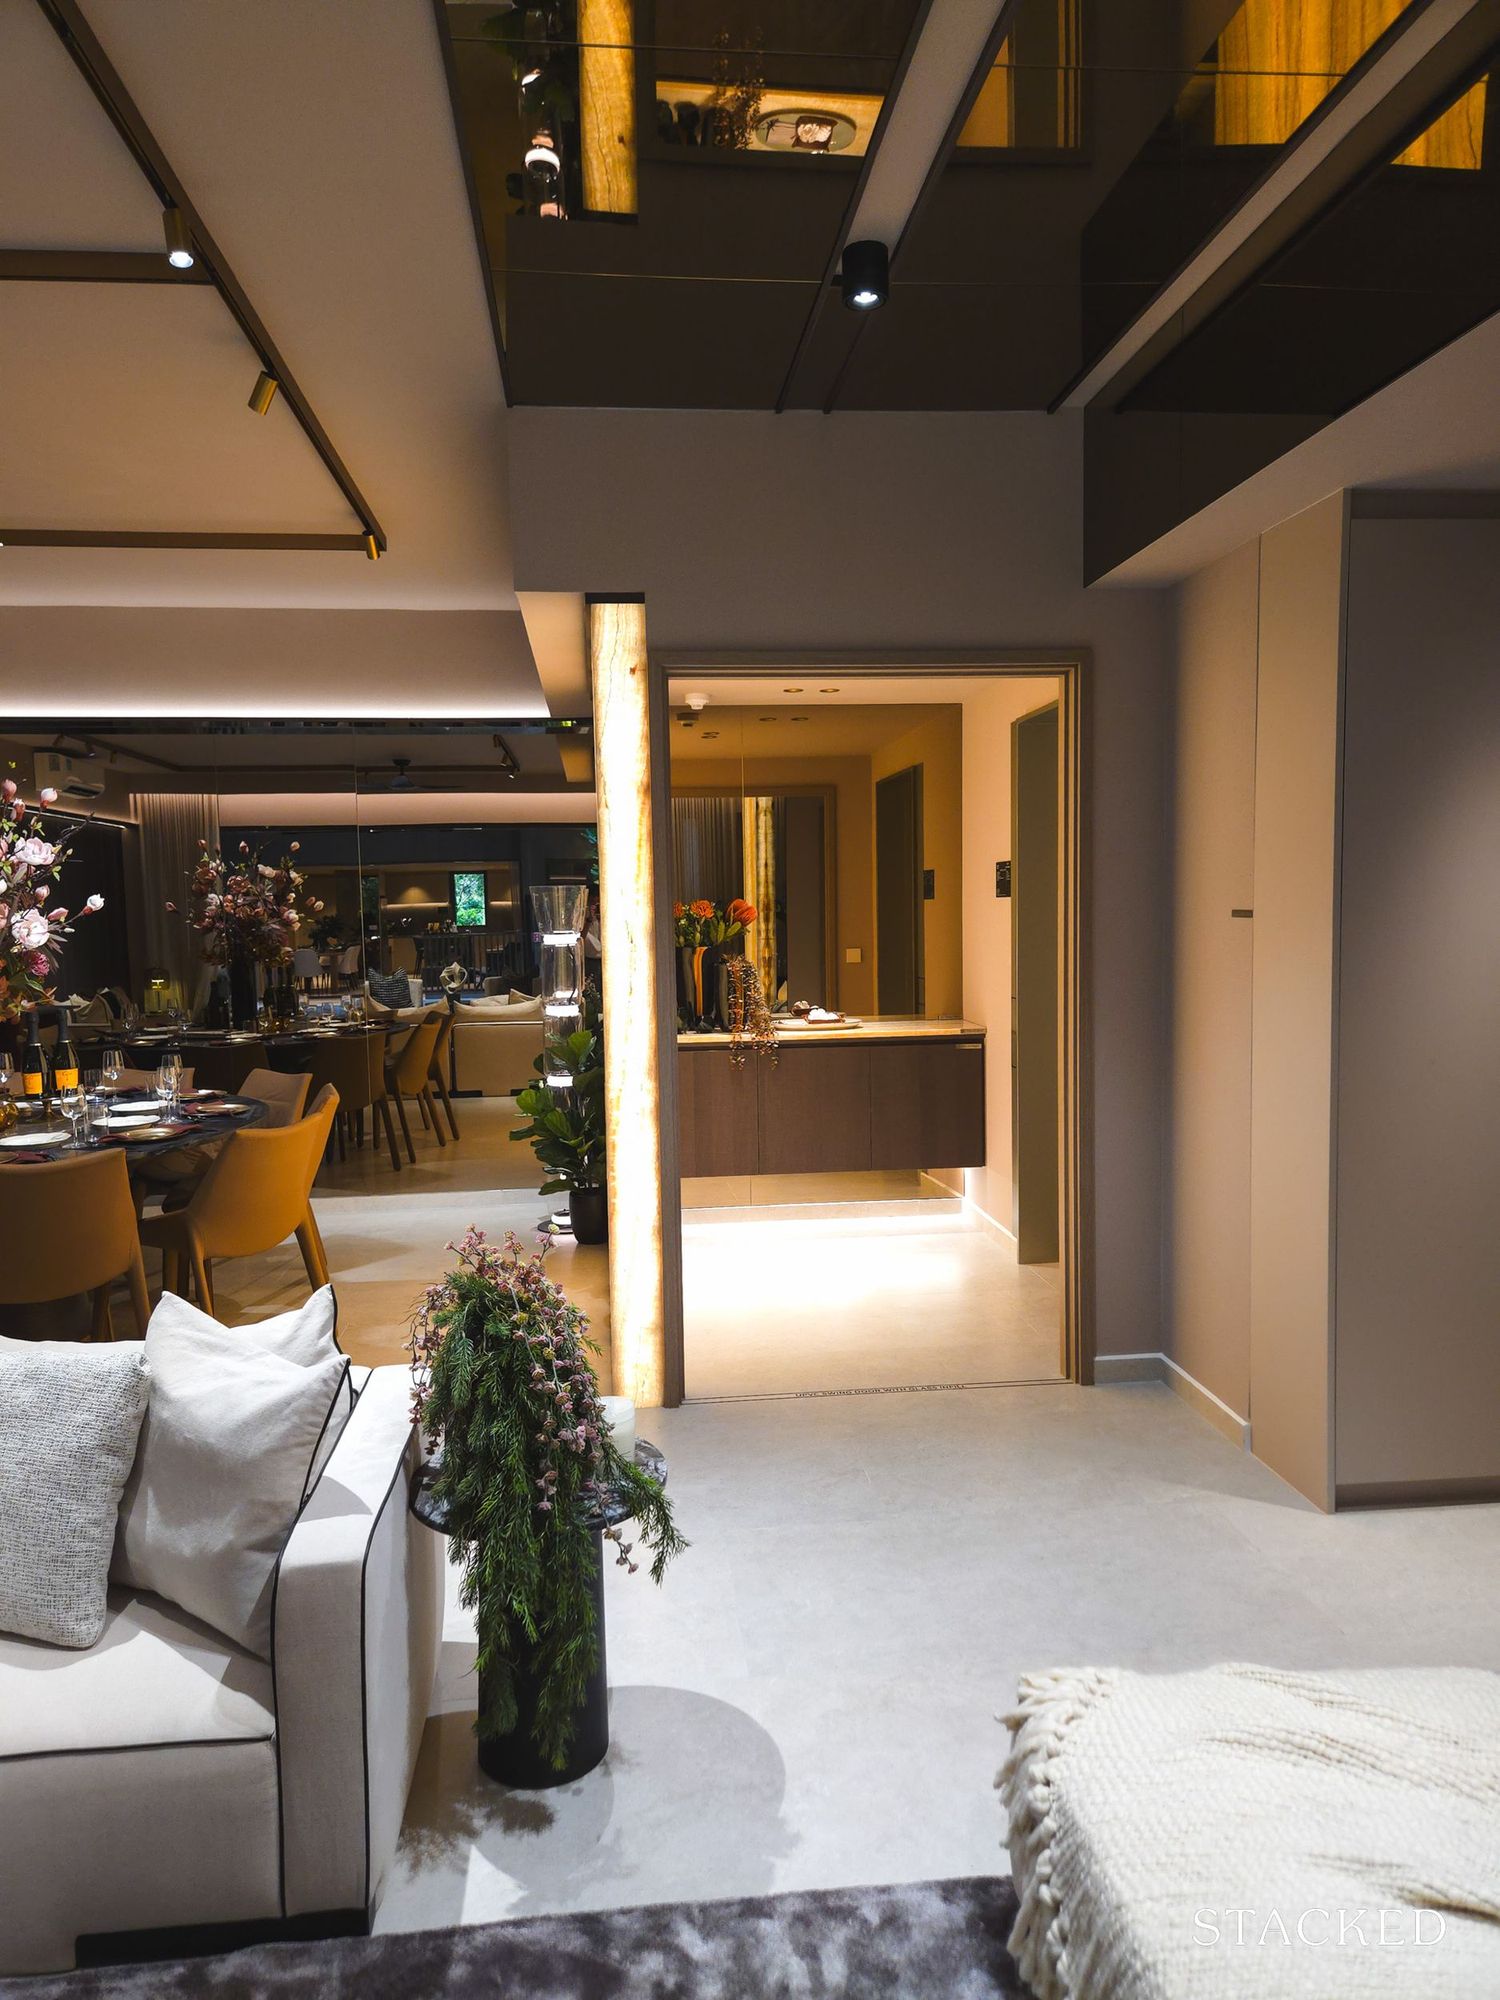
The unit opens into a small foyer, which adds a layer of privacy and space for shoe storage. The powder room sits near the entrance, which is convenient for guests who prefer not to use the shared bathroom. There’s no window here, so it relies on mechanical ventilation.
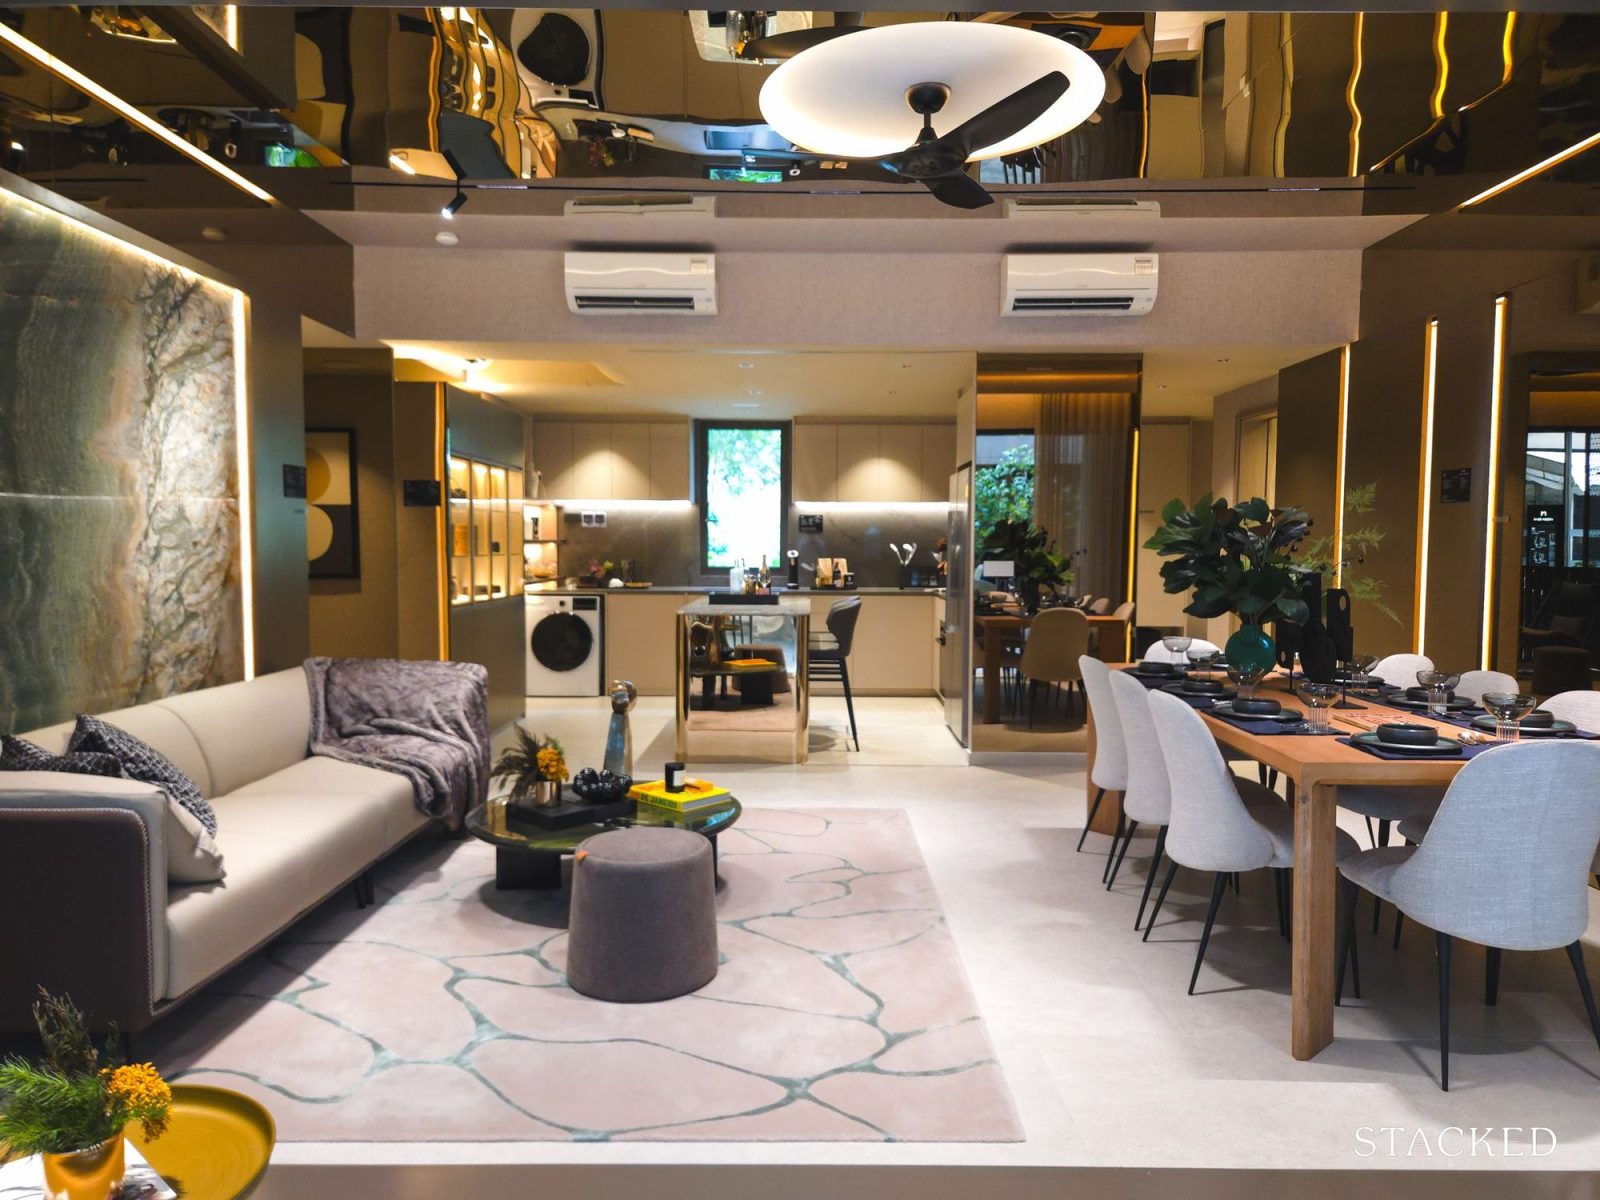
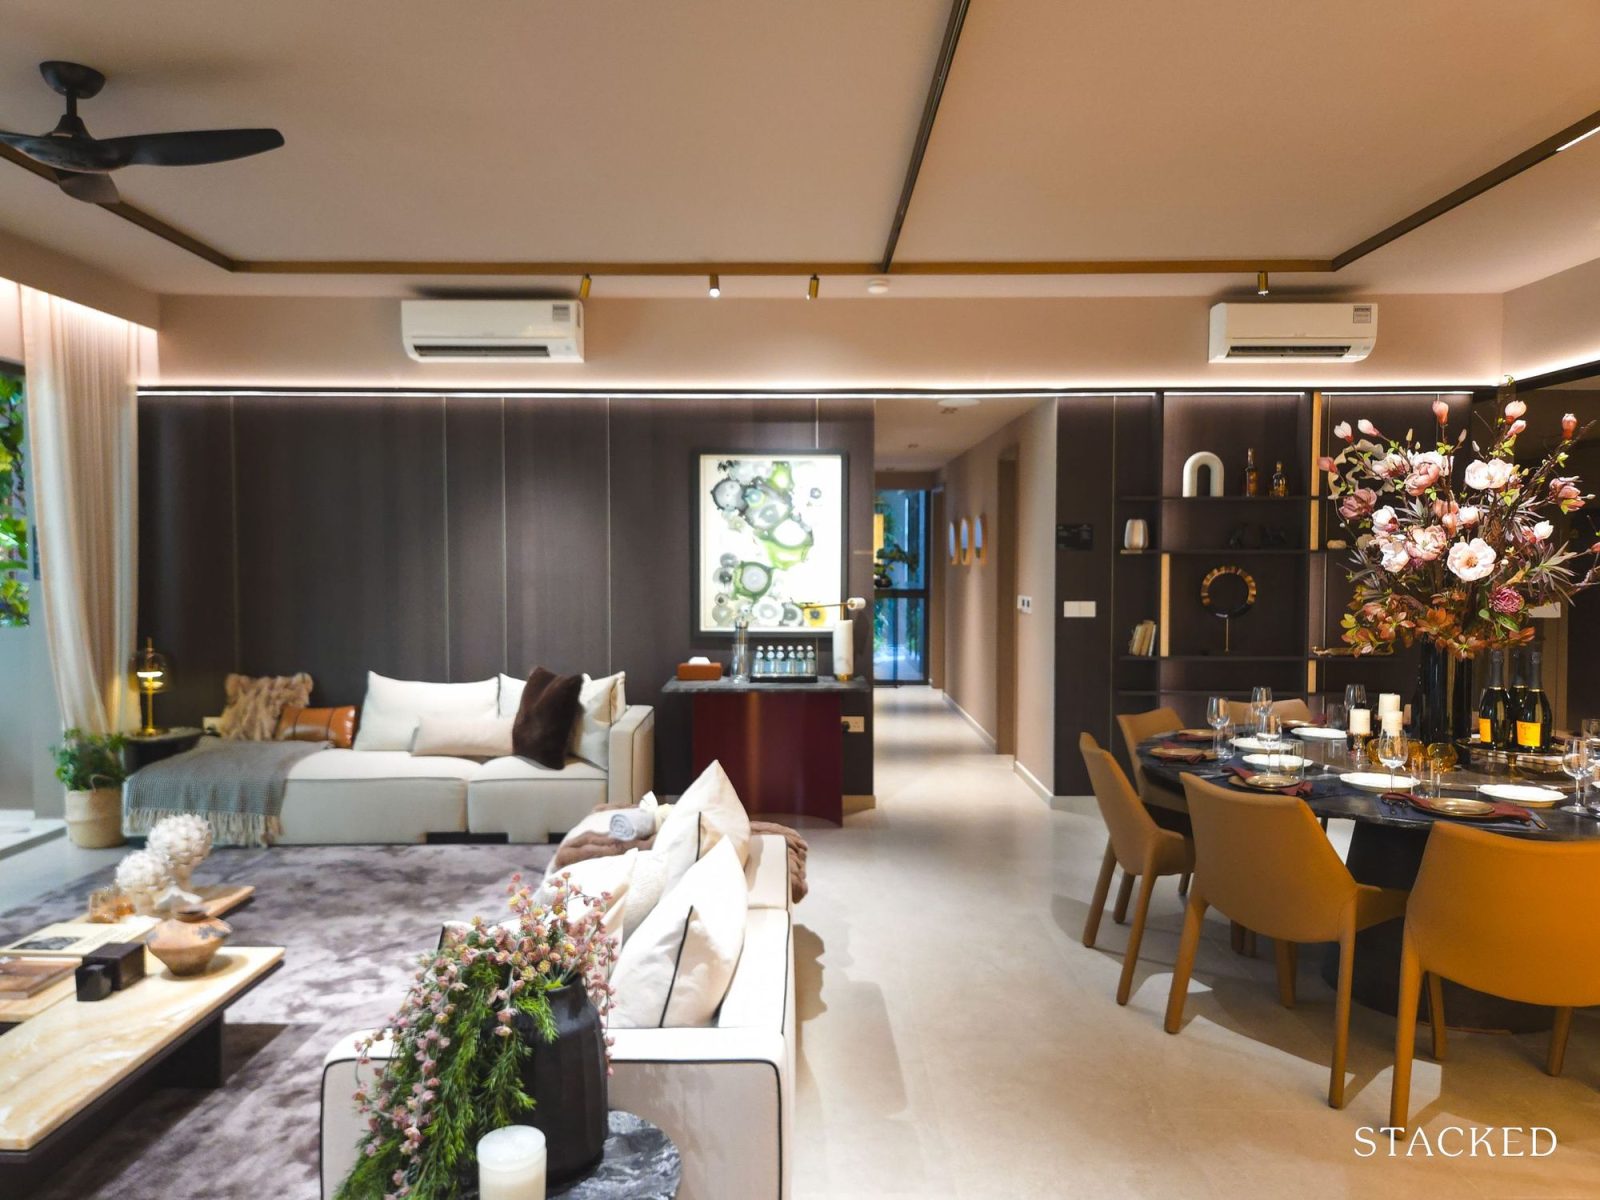
The unit opens directly into the living and dining area. In the showflat configuration, the flexi space has been opened up, and the kitchen has been kept open-concept, which makes the entire frontage feel wider than a typical three-bedroom layout.
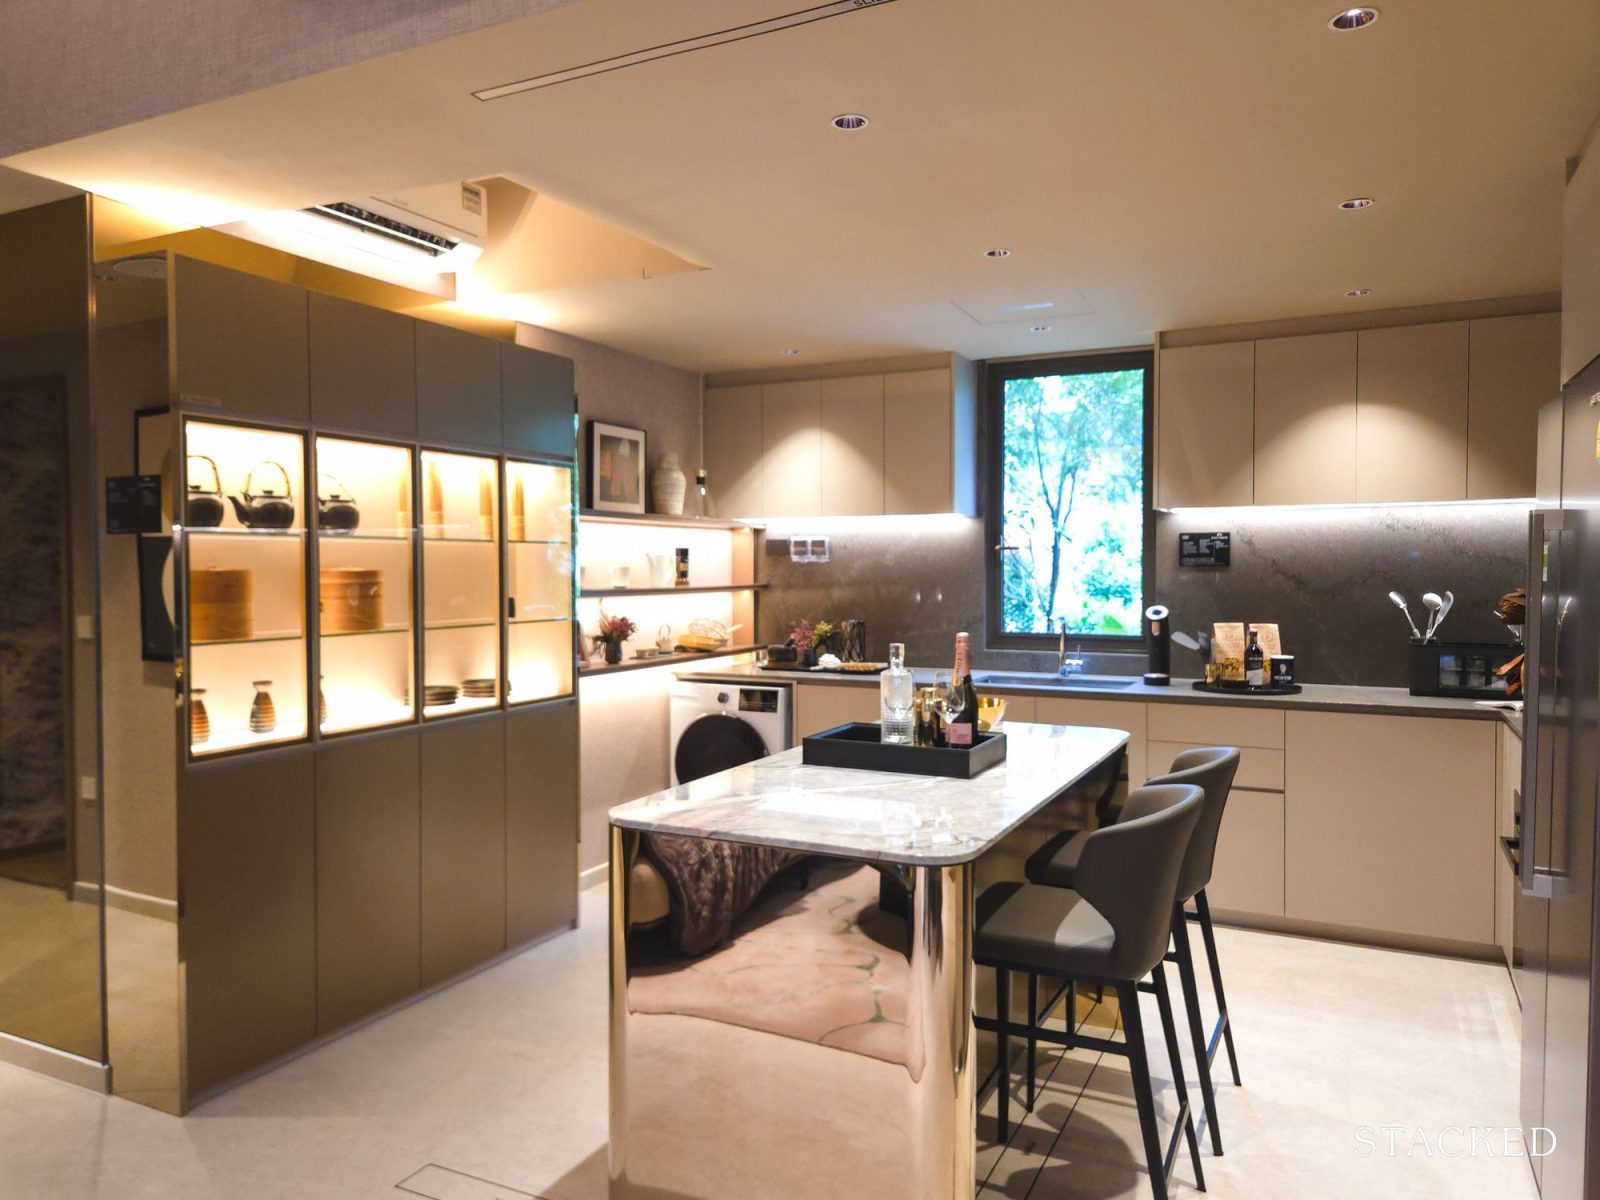
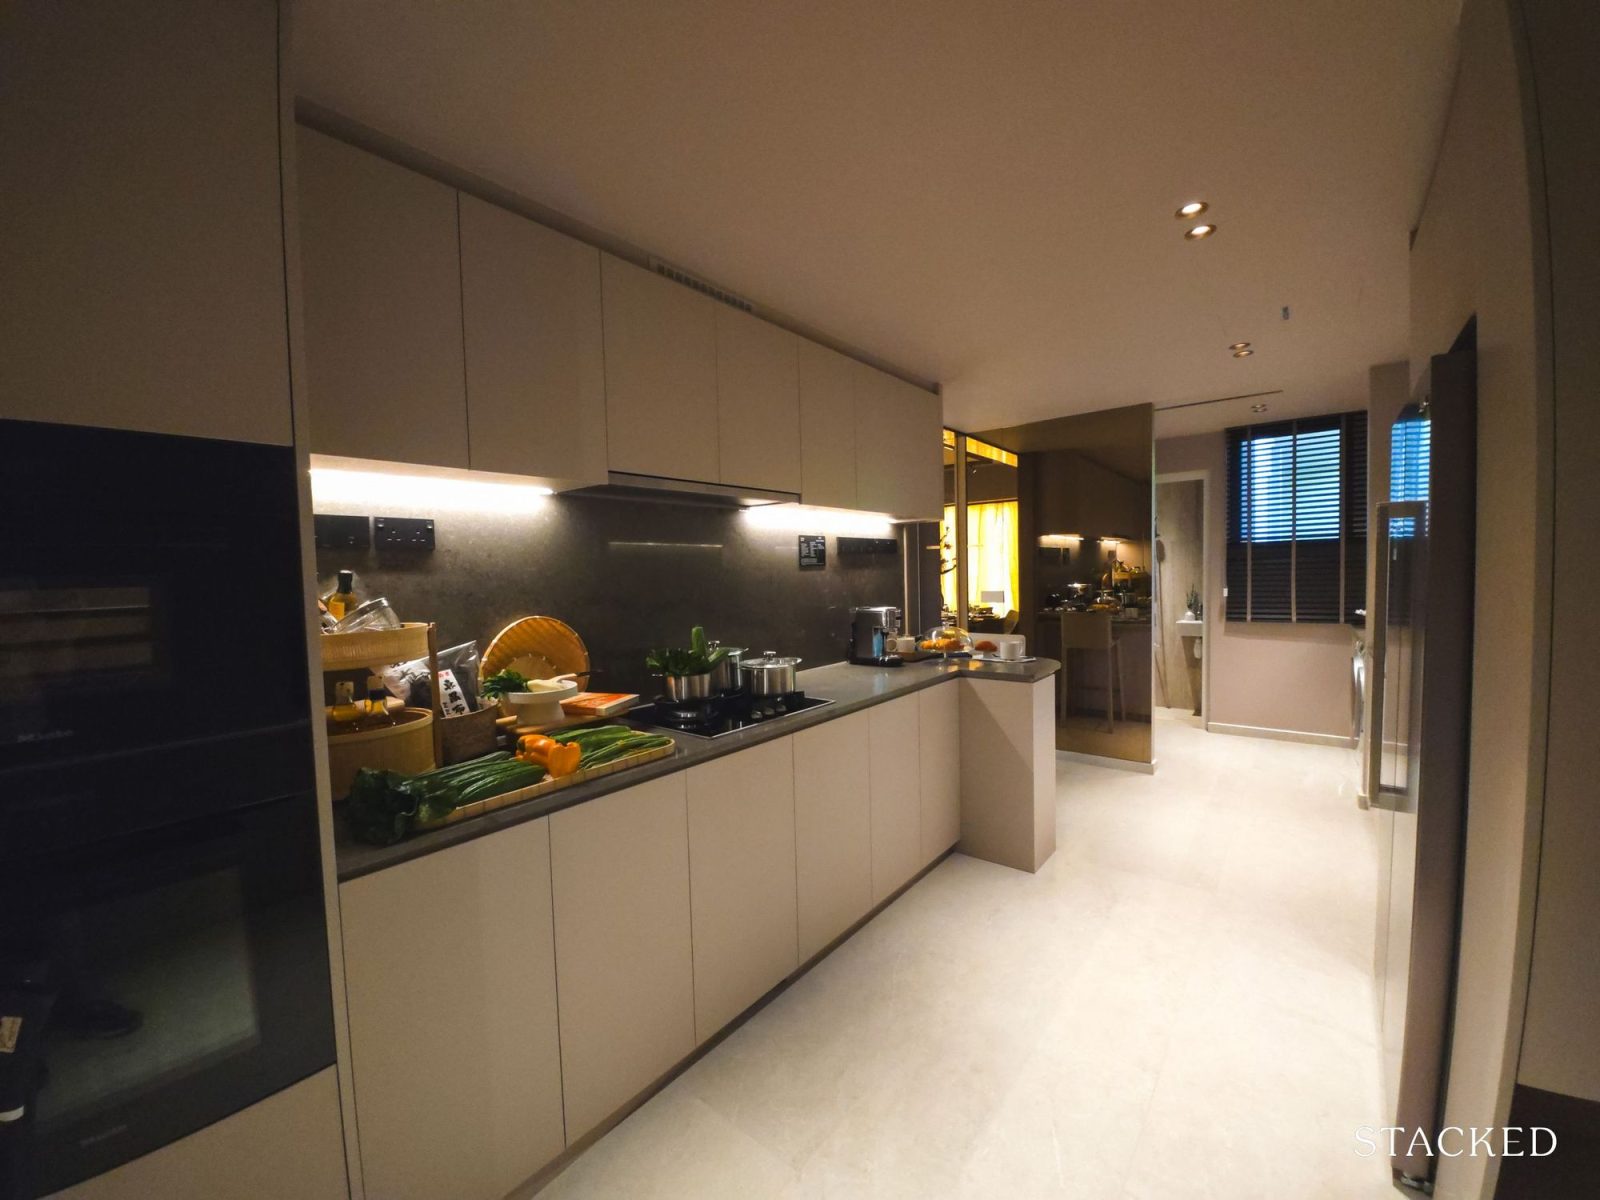
The kitchen adopts an L-shaped configuration. Appliances include a Blanco sink and mixer, Miele oven, gas hob and hood, as well as a Smeg fridge and washer-dryer. There is also provision for a separate washer and dryer if preferred, with space allocated for installation at the owner’s cost. Piping for a water filter has already been included.
One practical highlight is the large window above the sink, which provides natural ventilation and brings in additional light
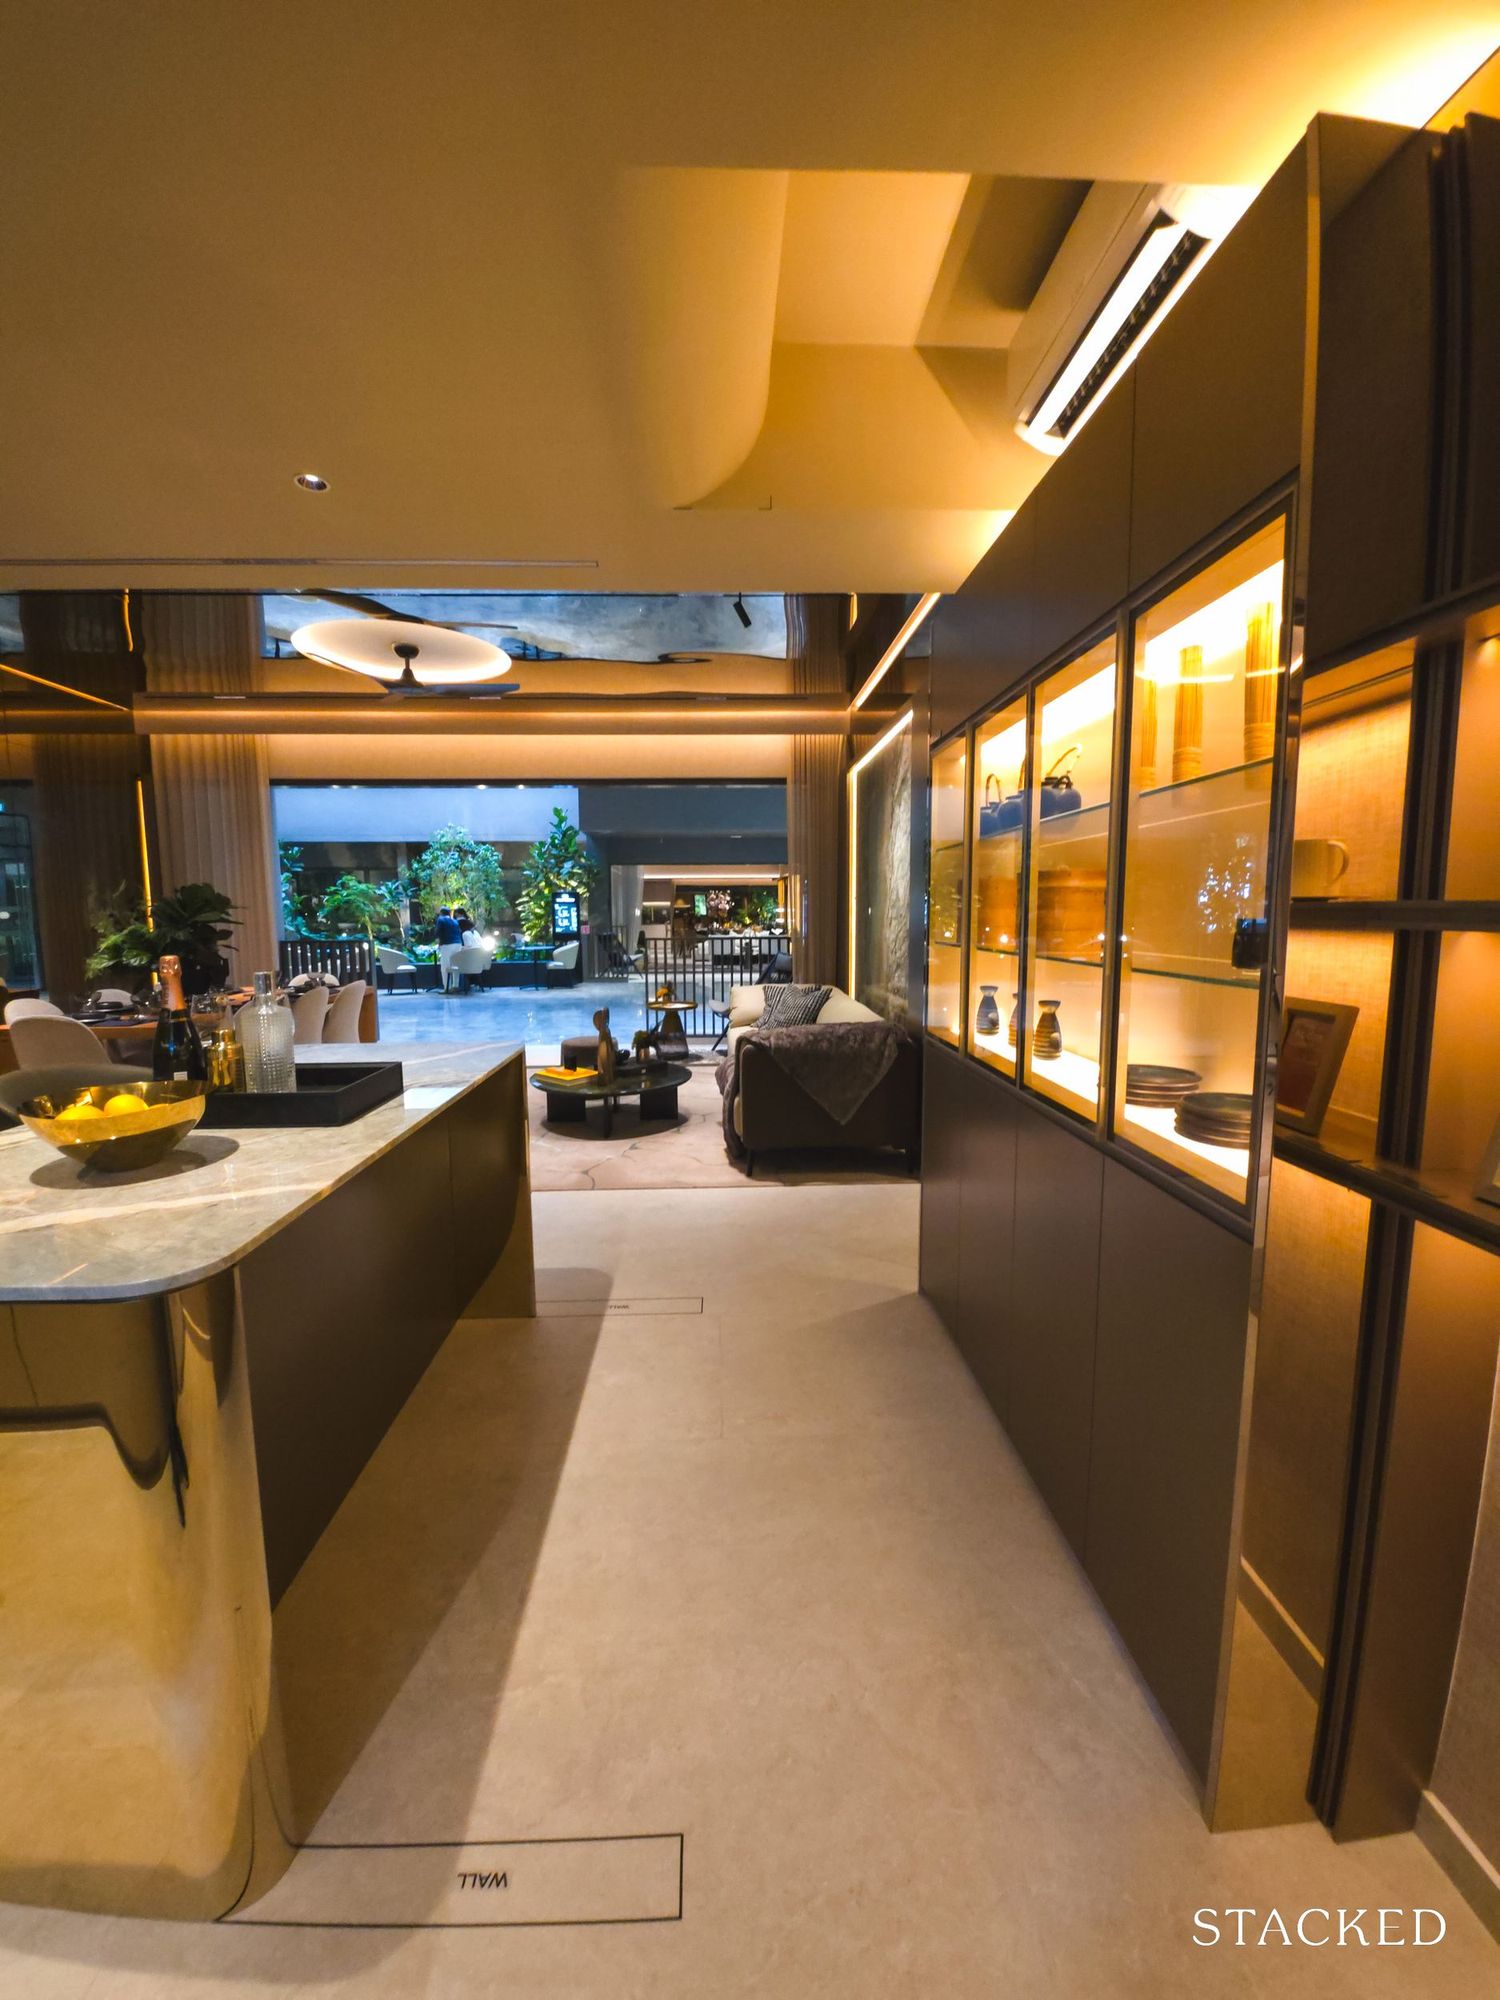
In the showflat, the kitchen is kept open and flows directly from the living area, as the flexi wall has been removed (pictured above). The space can alternatively be enclosed to create a separate flex room, though doing so would make the overall area feel more compact.
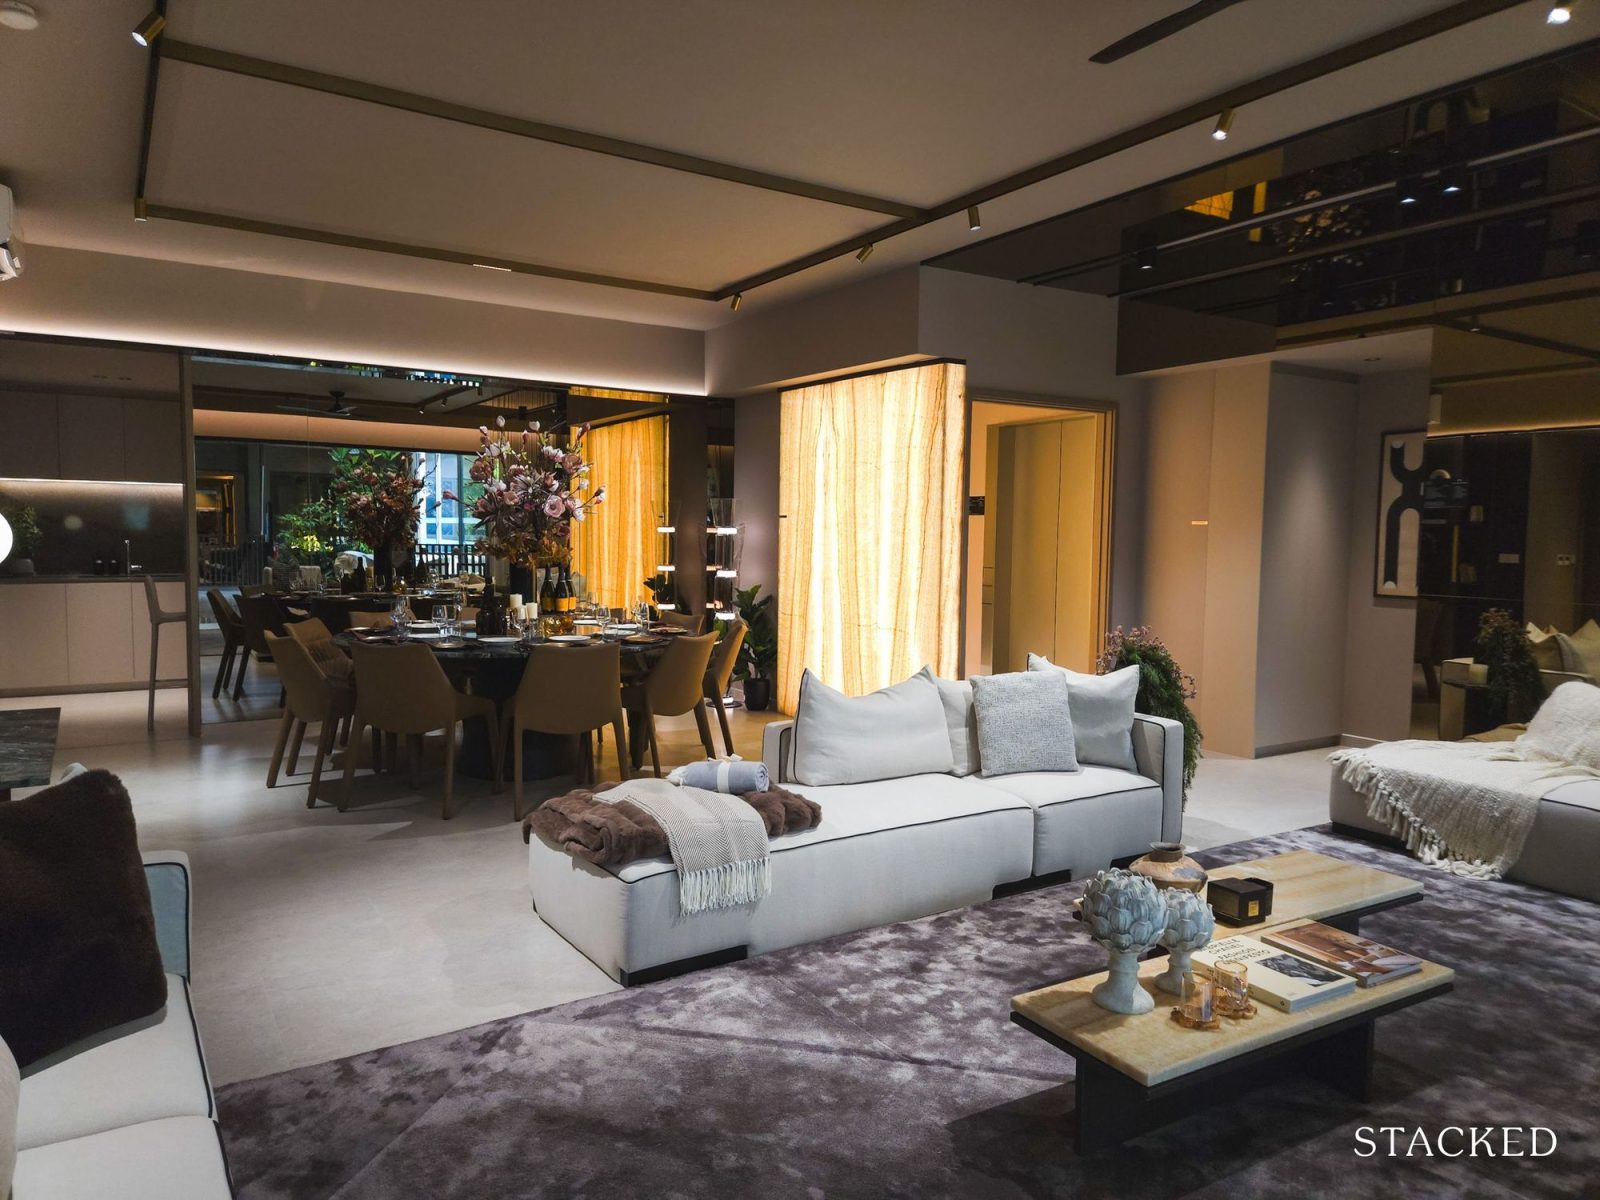
At 5.5m across, the living area is noticeably broader than what we usually see in this size range. An eight-seater dining table fits without issue, and there’s still space for a four-seater sofa. That said, with this orientation, incorporating a conventional TV console alongside both may require some planning.
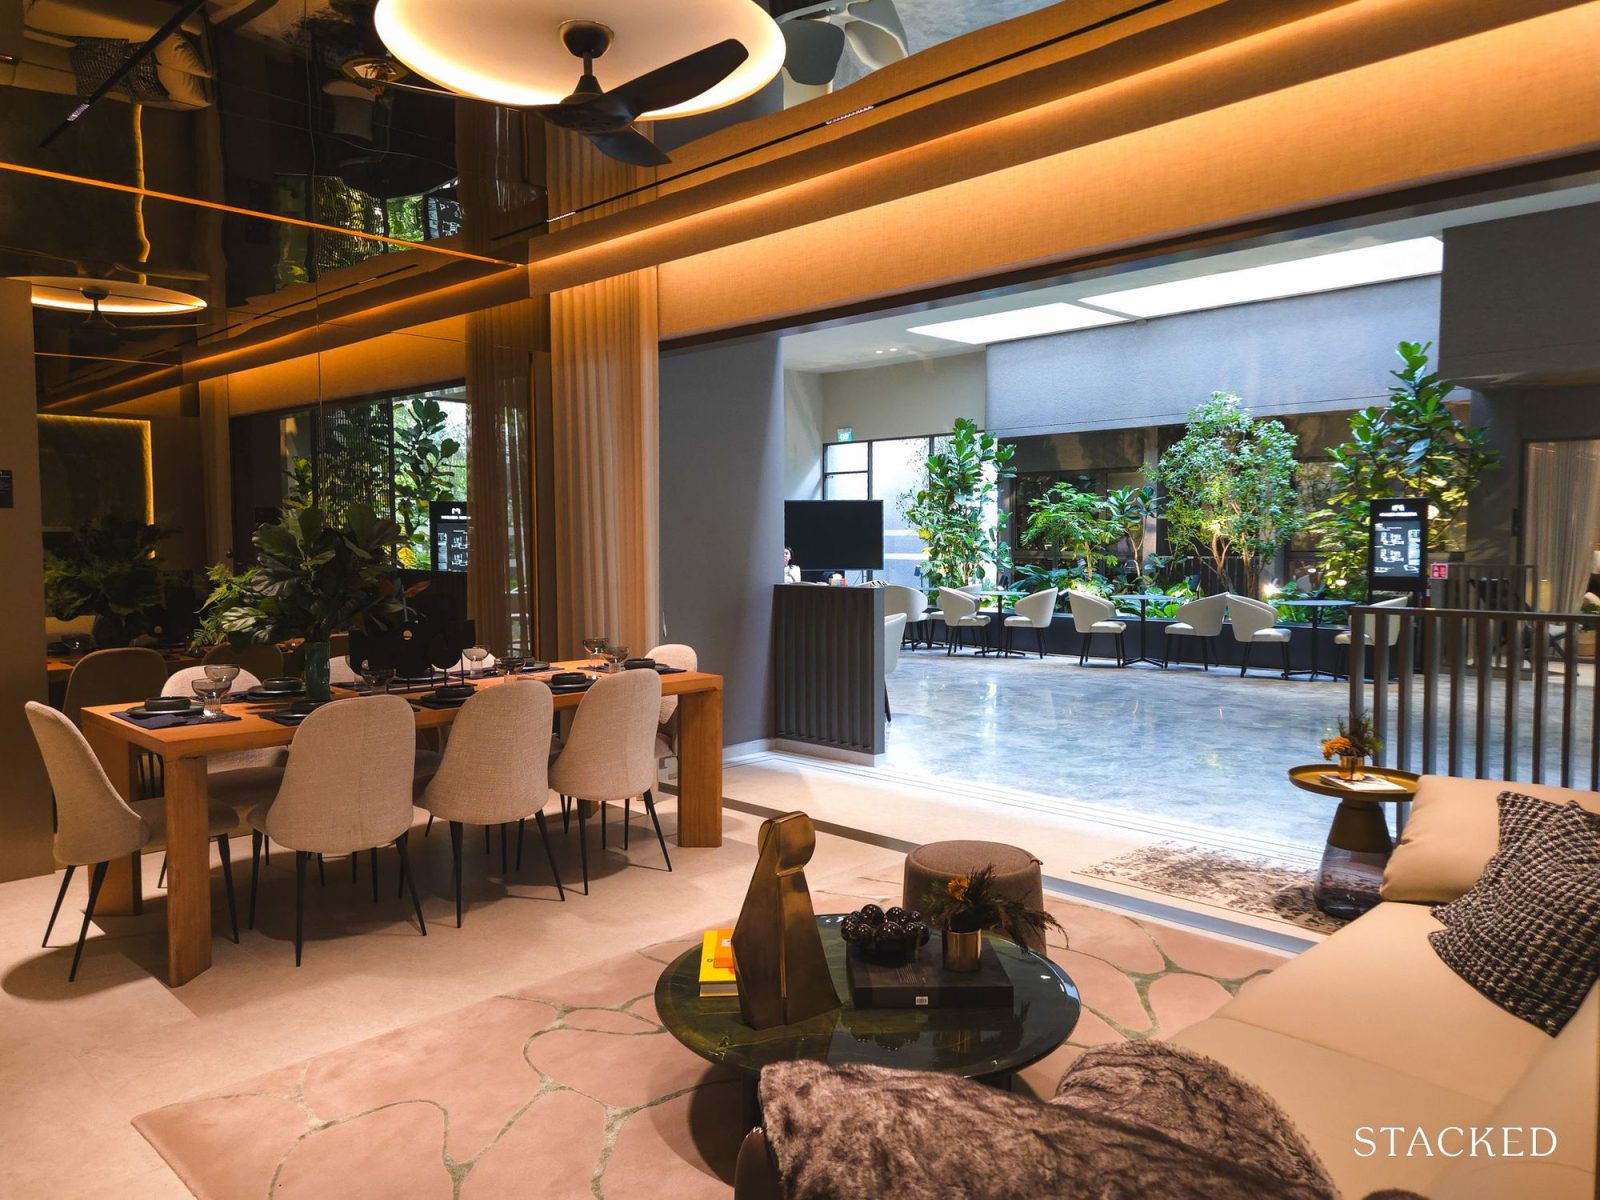
The balcony runs along the width of the living room. While it’s wide, it isn’t particularly deep, so a full alfresco dining set may be tight. For stacks facing Kim Seng Park and the river, it works better as a sit-out space rather than an entertaining one. A water and electrical point is provided.
The two common bedrooms are about the same size and can fit a queen bed comfortably. Both come with full-height windows and built-in wardrobes.
One of the rooms connects directly to the common bathroom through a Jack-and-Jill door, so it almost feels like an ensuite. The other bedroom doesn’t have that, but it gets the better park and river view. So it’s really a choice between the view and bathroom access.
The shared bathroom itself is straightforward (Duravit fittings throughout), and it has a window for natural ventilation, which is something buyers tend to appreciate.
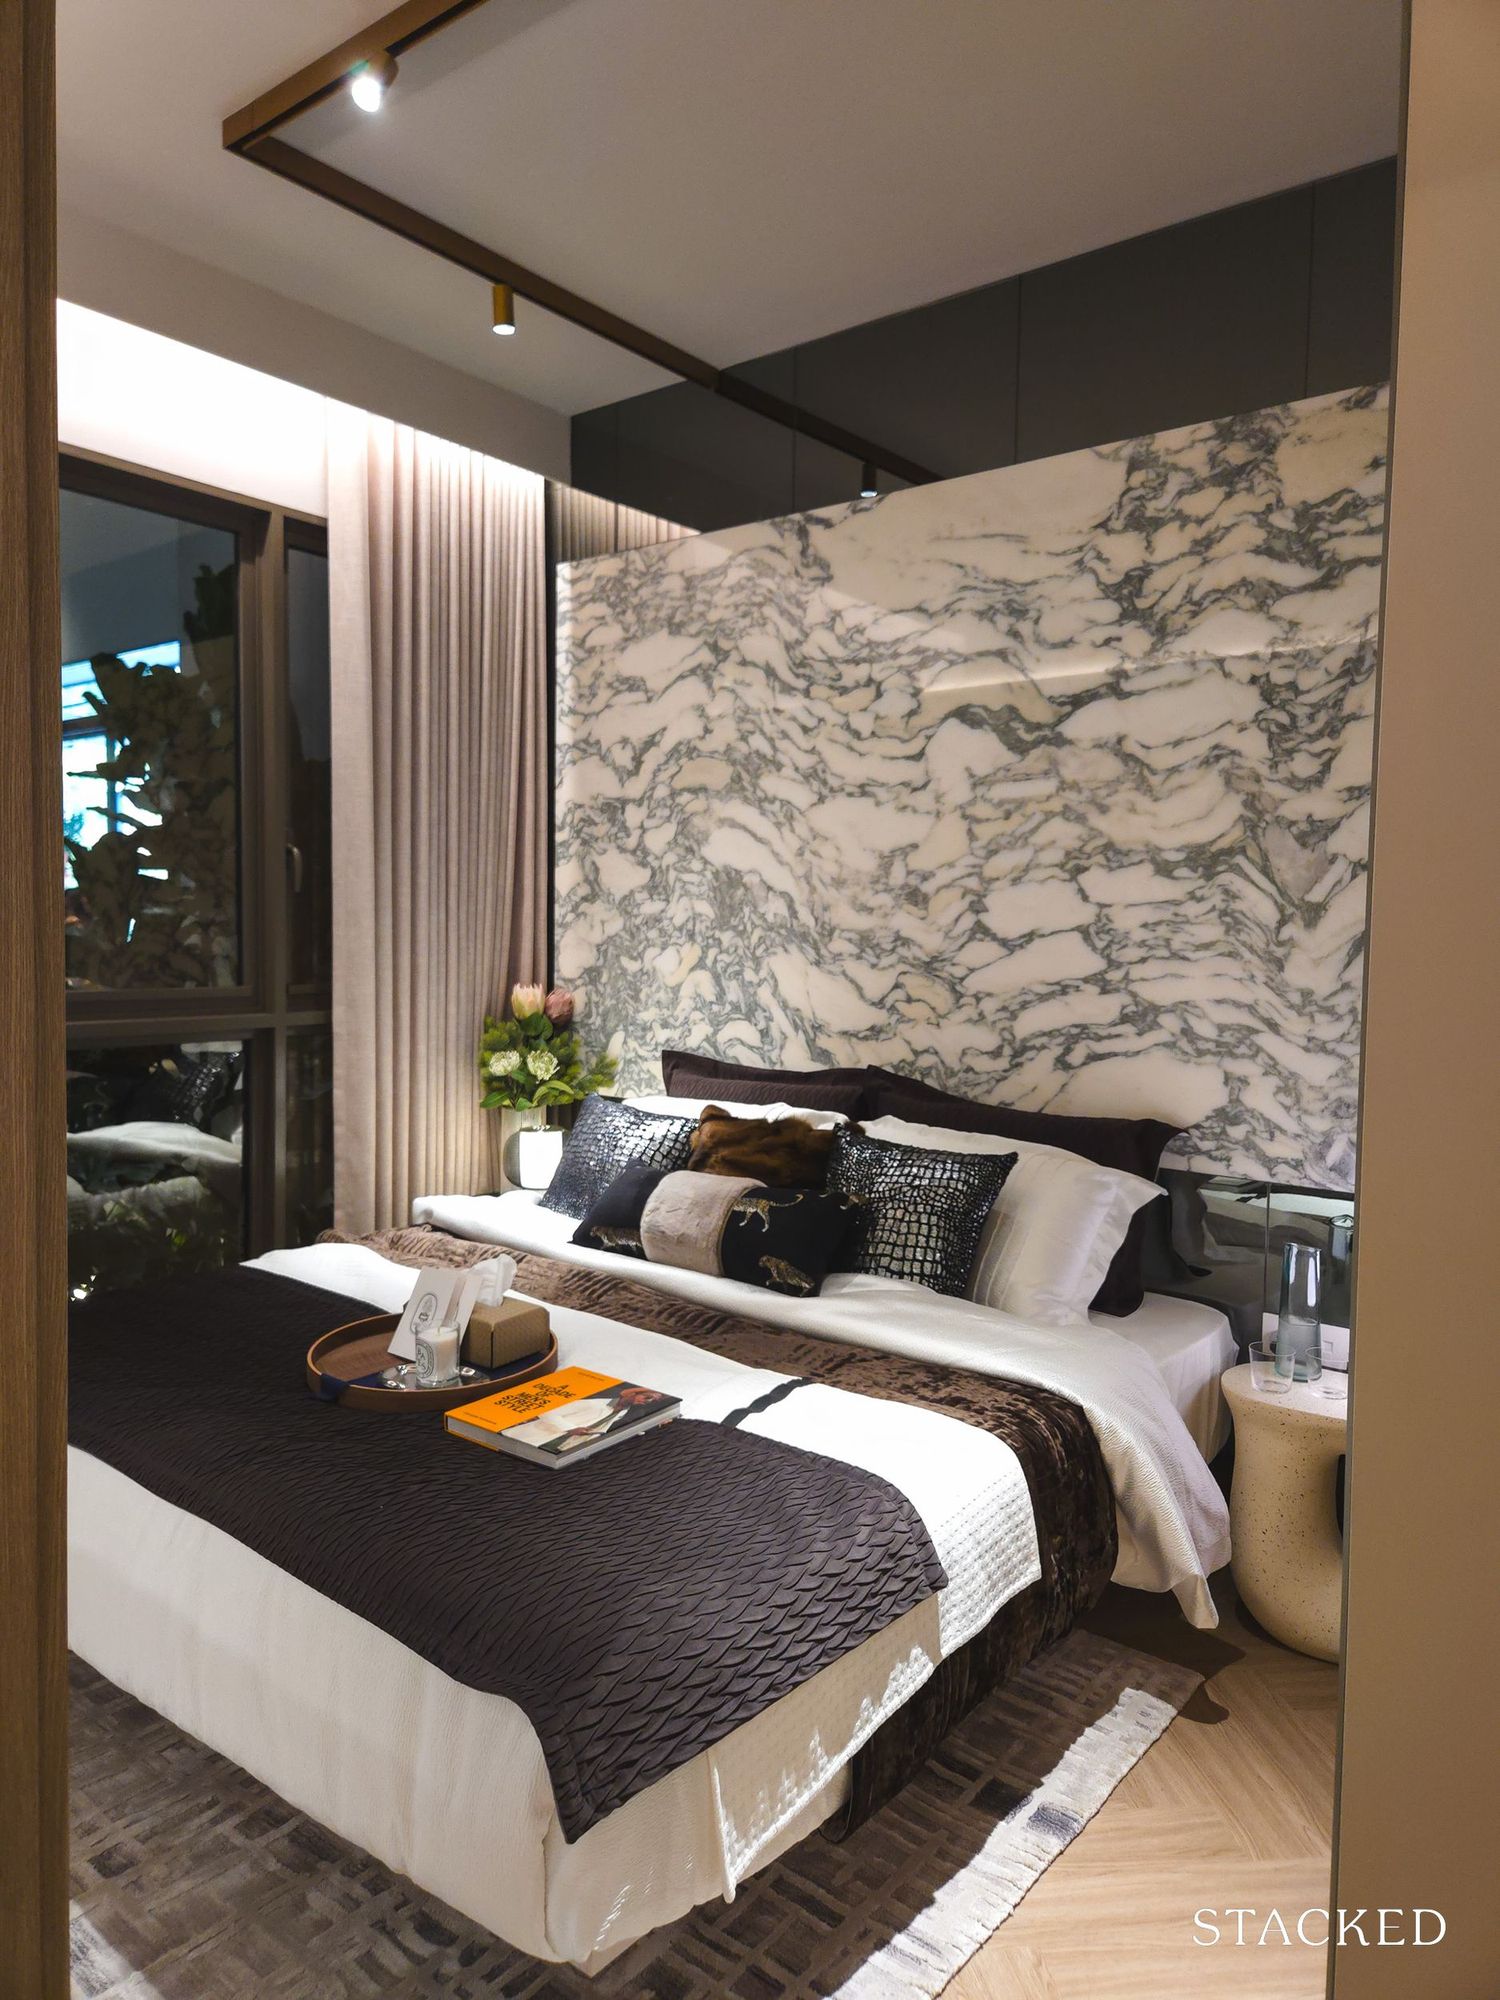
The master bedroom is positioned at the far end of the unit, giving it a greater sense of privacy. There’s a small transition space before entering the sleeping area, and the room comfortably fits a king-sized bed.
It comes with full-height windows and a built-in wardrobe, though some may find the wardrobe slightly modest for a 1,098 sq ft layout.
The master bathroom mirrors the common bathroom in fittings, also from Duravit, with the addition of a rain shower. It also has a window for natural ventilation.
Overall, for a three-bedroom unit, this layout feels relatively generous without being excessive. The frontage is strong, circulation is straightforward, and there isn’t much wasted space. It’s a practical configuration that should appeal to families looking for something functional in District 9.
4 Bedroom Plus Showflat – Type D2 (1,830 sqft)
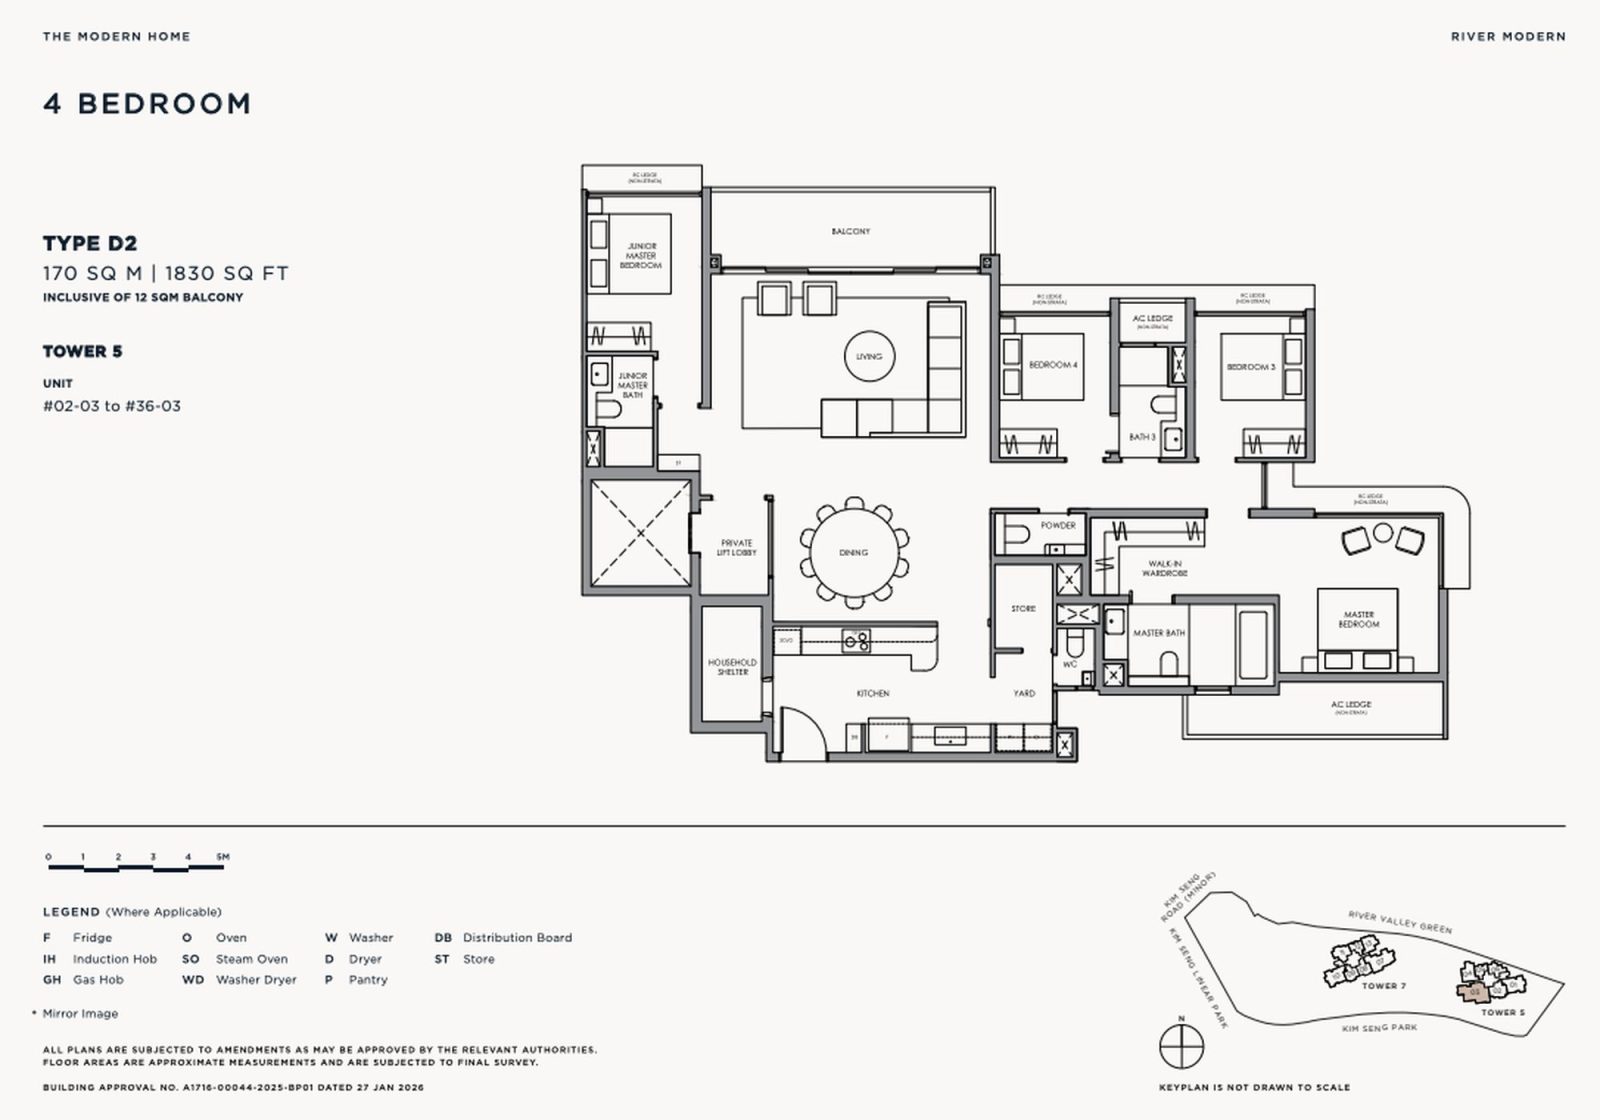
To round off the showflat tour, the largest unit on display is the 1,830 sq ft four-bedroom. Like some of the smaller units, it adopts a dumbbell-style layout.
You get a private lift lobby, four bedrooms, three bathrooms, a powder room, and a generous living area. The kitchen comes with a yard, household shelter and an additional store, so it’s clearly designed with practical family living in mind.
In terms of finishes, it’s consistent with the rest of the project: porcelain tiles in the living areas, herringbone vinyl flooring in the bedrooms, and ceiling heights of about 2.825m.
The rooms are regular in shape, circulation is straightforward, and there isn’t much wasted space. It’s a layout that’s easy to plan around, which is really what most families would be looking for at this size.
The private lift opens into a small internal landing (pictured above), which gives the unit a clearer sense of arrival before you step into the main space. Interestingly, the built-in shoe cabinet isn’t placed within the lift lobby itself. Instead, it’s positioned along the wall outside the junior master bedroom, which leaves the lift landing more open for homeowners to customise.
Once inside, the living and dining areas feel wide rather than deep. With a 6.3m frontage, the living room reads larger than most typical four-bedders. There’s enough space for a sizeable L-shaped sofa and coffee table, though incorporating a traditional TV console will require some planning.
The dining area is equally generous and can accommodate a ten-seater round table.
The balcony runs the full width of the living area, visually extending the space outwards. Like the smaller unit types, it’s wide but not particularly deep, so a full outdoor dining setup may be tight.
That said, with views towards Kim Seng Park and the river, it works well as a sit-out space. A water point and an electrical point are provided.
This leads into the kitchen (pictured above). Unlike many recent new launches that separate the space into wet and dry kitchens, River Modern opts for a single enclosed kitchen instead. The idea here is straightforward: rather than splitting the area into two smaller zones, you get one larger, more usable kitchen.
Within this space, you’ll find the service door, household shelter, utility room and WC, so there’s proper storage provision and space that can function as a helper’s room if required.
The yard is on the more compact side and does not have windows for natural ventilation. It’s not uncommon in newer high-rise developments, though some buyers may have preferred a window here.
Appliances include a Blanco sink and mixer, along with a Miele oven, gas hob, cooker hood and steam oven. A Smeg fridge is also provided. You’ll also find the cabinetry provided here to be curved, which mimics the same curvature of the river (like its facade).
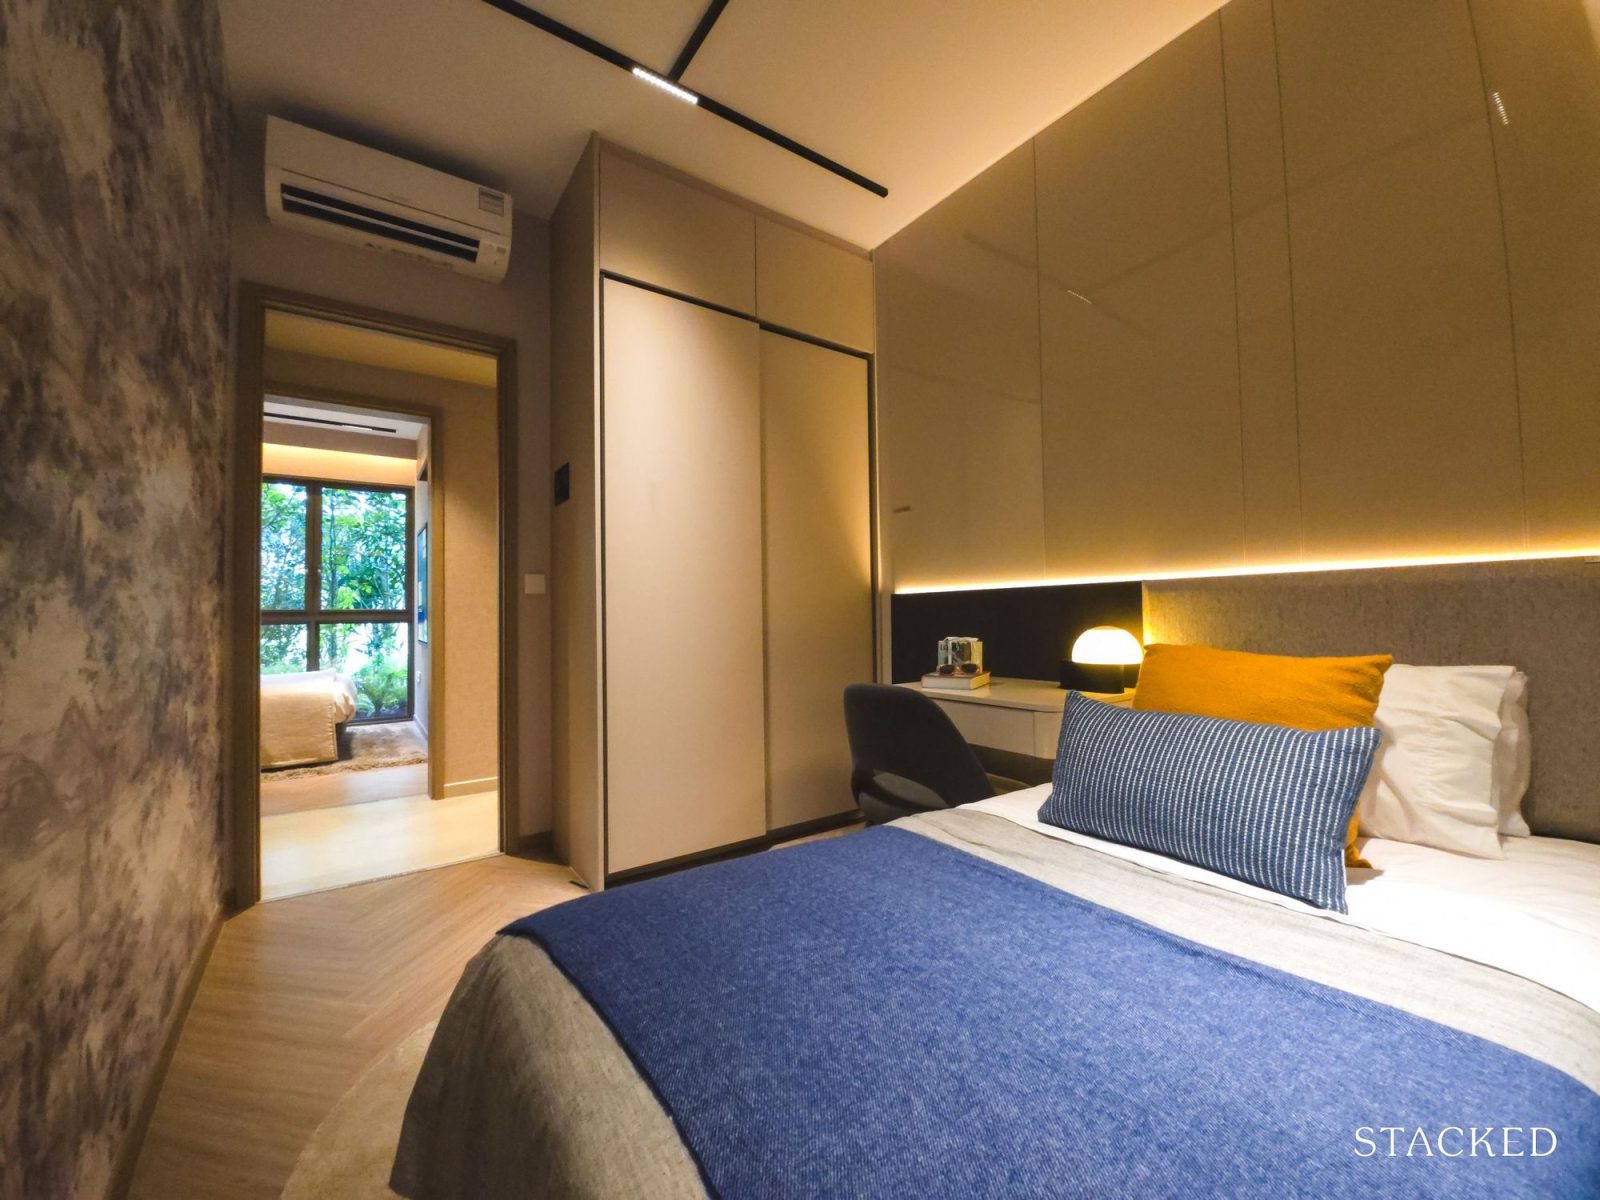
Moving back towards the bedroom wing, the junior master sits on its own to the left of the unit, which gives it a greater sense of privacy. This configuration works well for multi-generational families or households that may want a slightly more separate bedroom.
The room itself can accommodate a king-sized bed and comes with a built-in two-panel wardrobe and full-height windows. It also has its own ensuite bathroom fitted with a wall-hung WC, basin and mixers from Duravit. There are no windows here, so ventilation is mechanical.
On the opposite side of the unit sits the powder room, which is convenient for guests without having them use the family bathrooms. Fittings here, like the rest of the unit, are from Duravit.
The two common bedrooms are similar in size and can accommodate queen-sized beds. Both come with built-in wardrobes and full-height windows. The key difference is that one connects directly to the shared bathroom via a Jack-and-Jill door, so it functions almost like an ensuite. Naturally, that room may be the more popular choice.
The shared bathroom serves both common bedrooms and also features Duravit fittings. There’s no window here, so ventilation is mechanical.
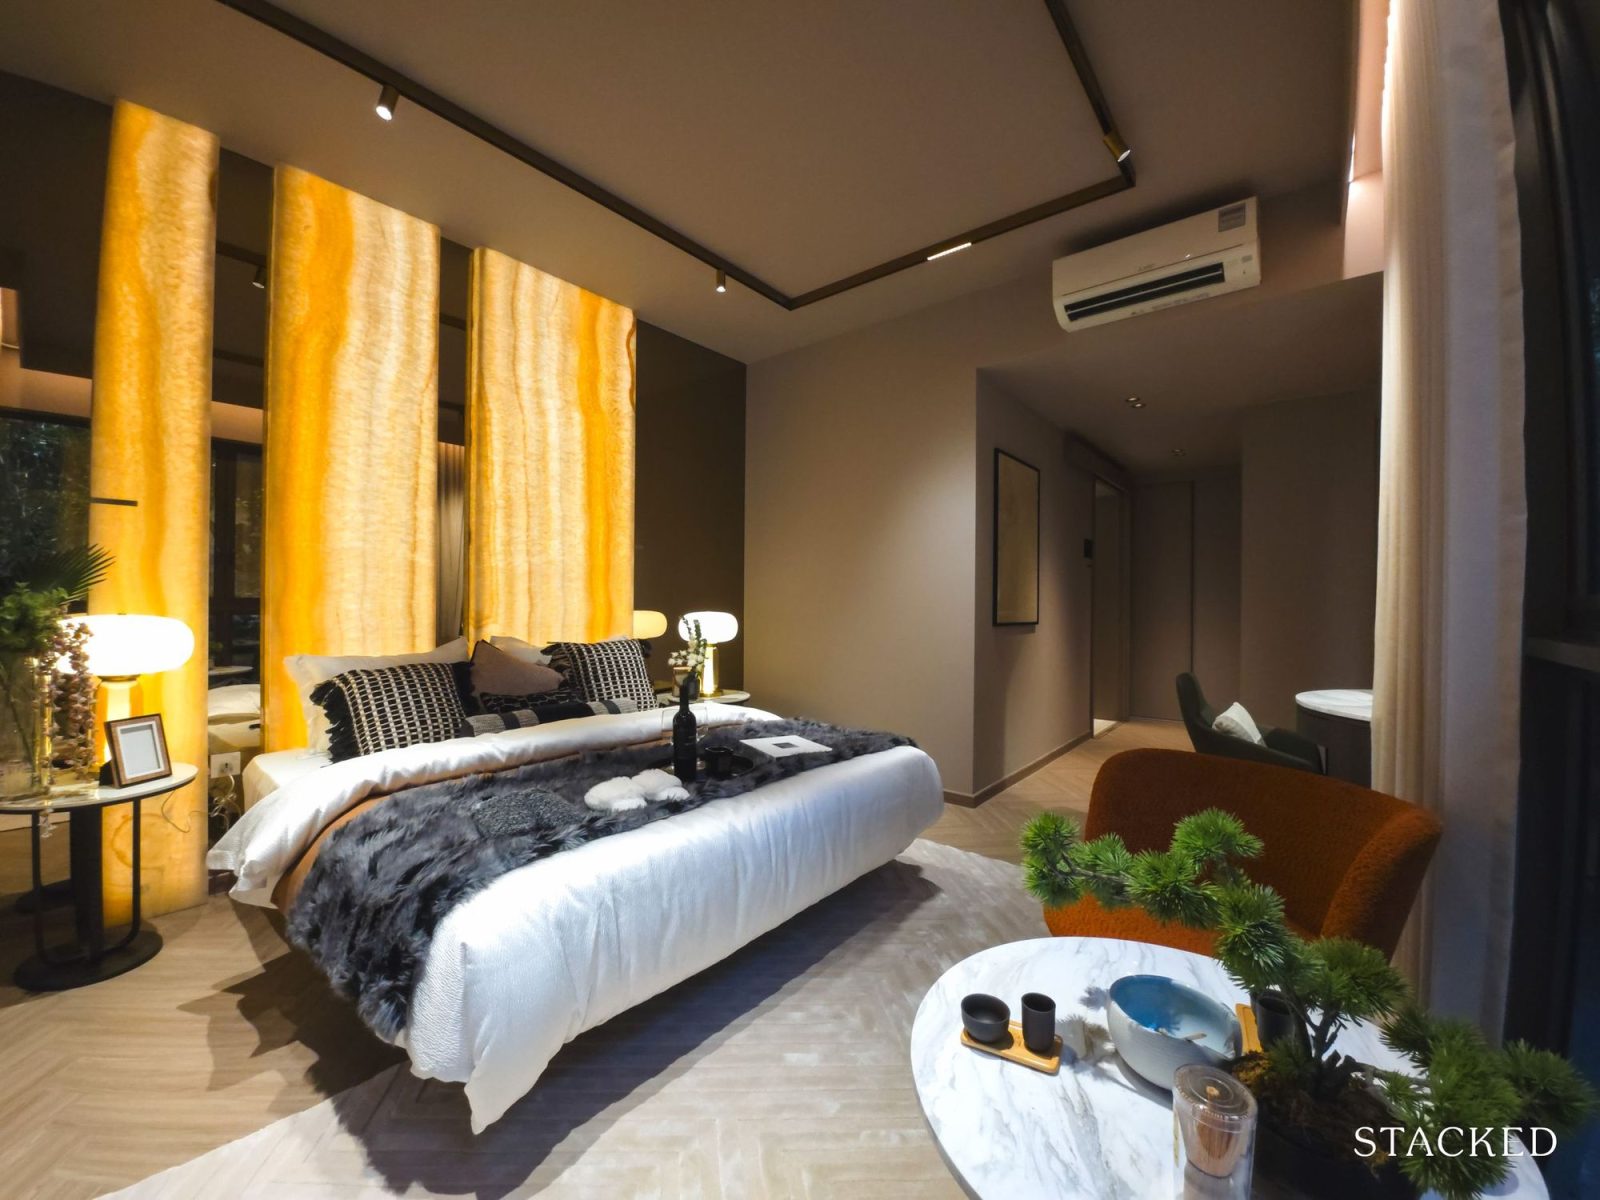
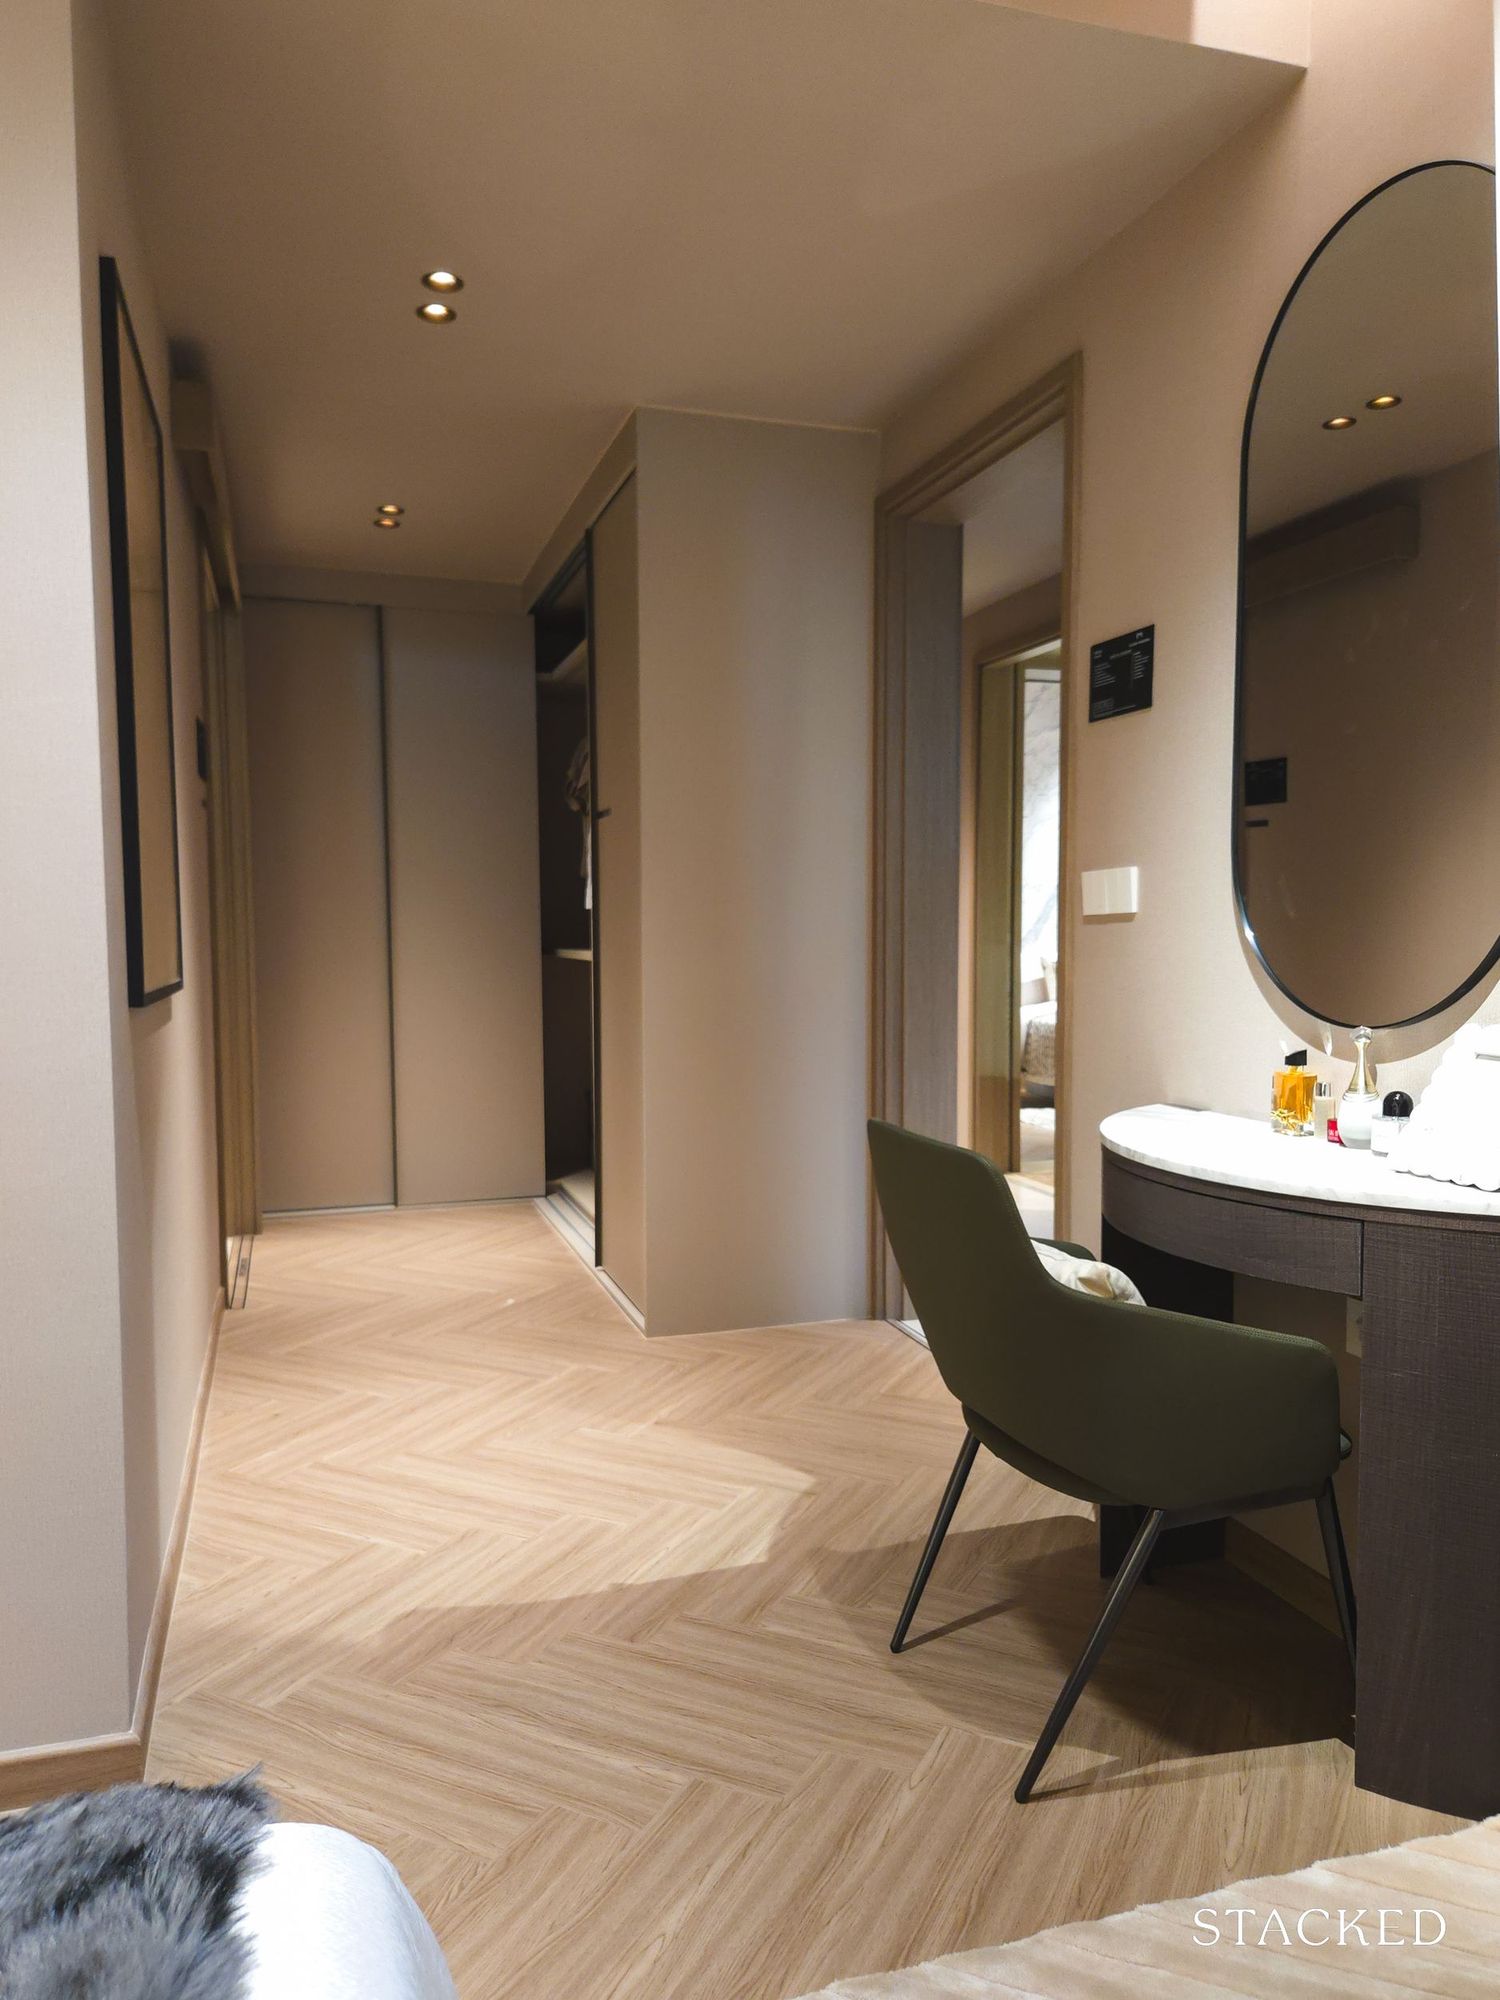
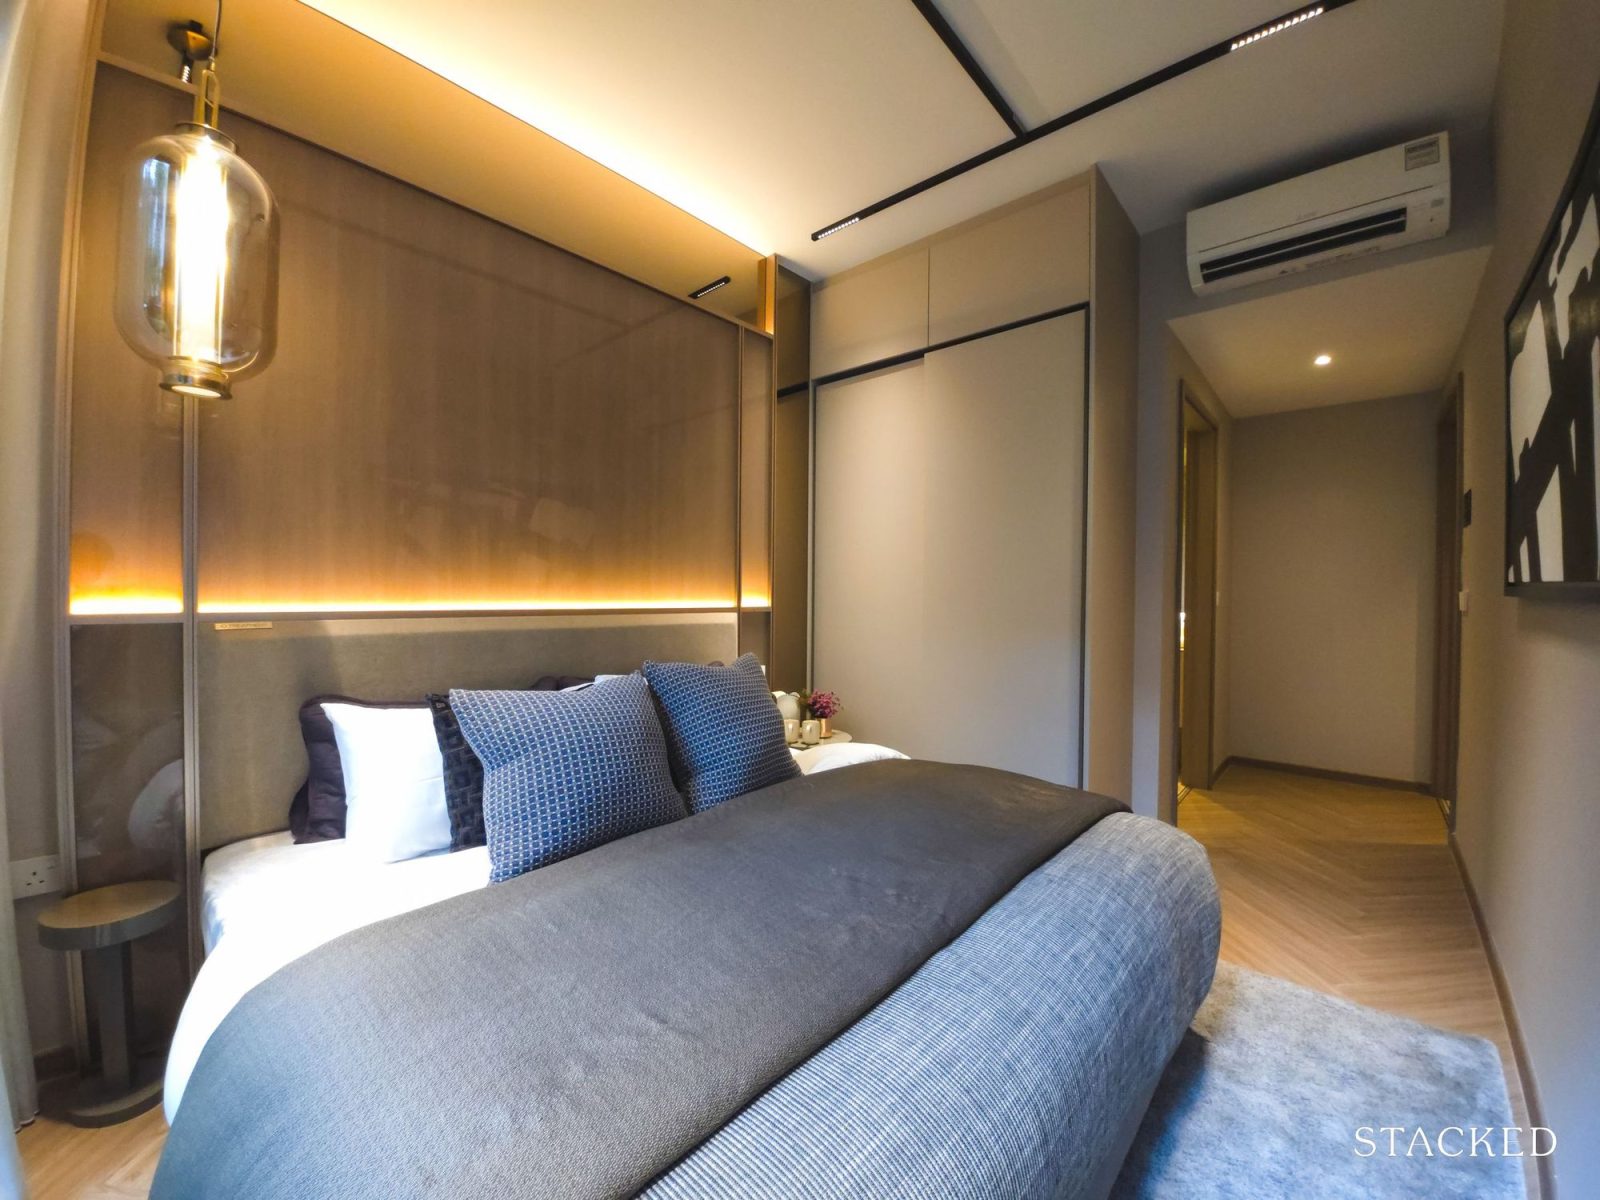
Finally, the master bedroom (pictured above) sits at the far end of the unit, giving it the most privacy. The layout here feels noticeably more generous. Even with a king-sized bed, a walk-in wardrobe and a vanity area, there’s still comfortable space to move around, which is something that isn’t always a given in newer launches.
One detail that stands out is the L-shaped window, which wraps around the corner and draws in more light while framing the river views. The built-in wardrobe is also more substantial here, with five panels instead of the two-panel configuration seen in the smaller unit types.
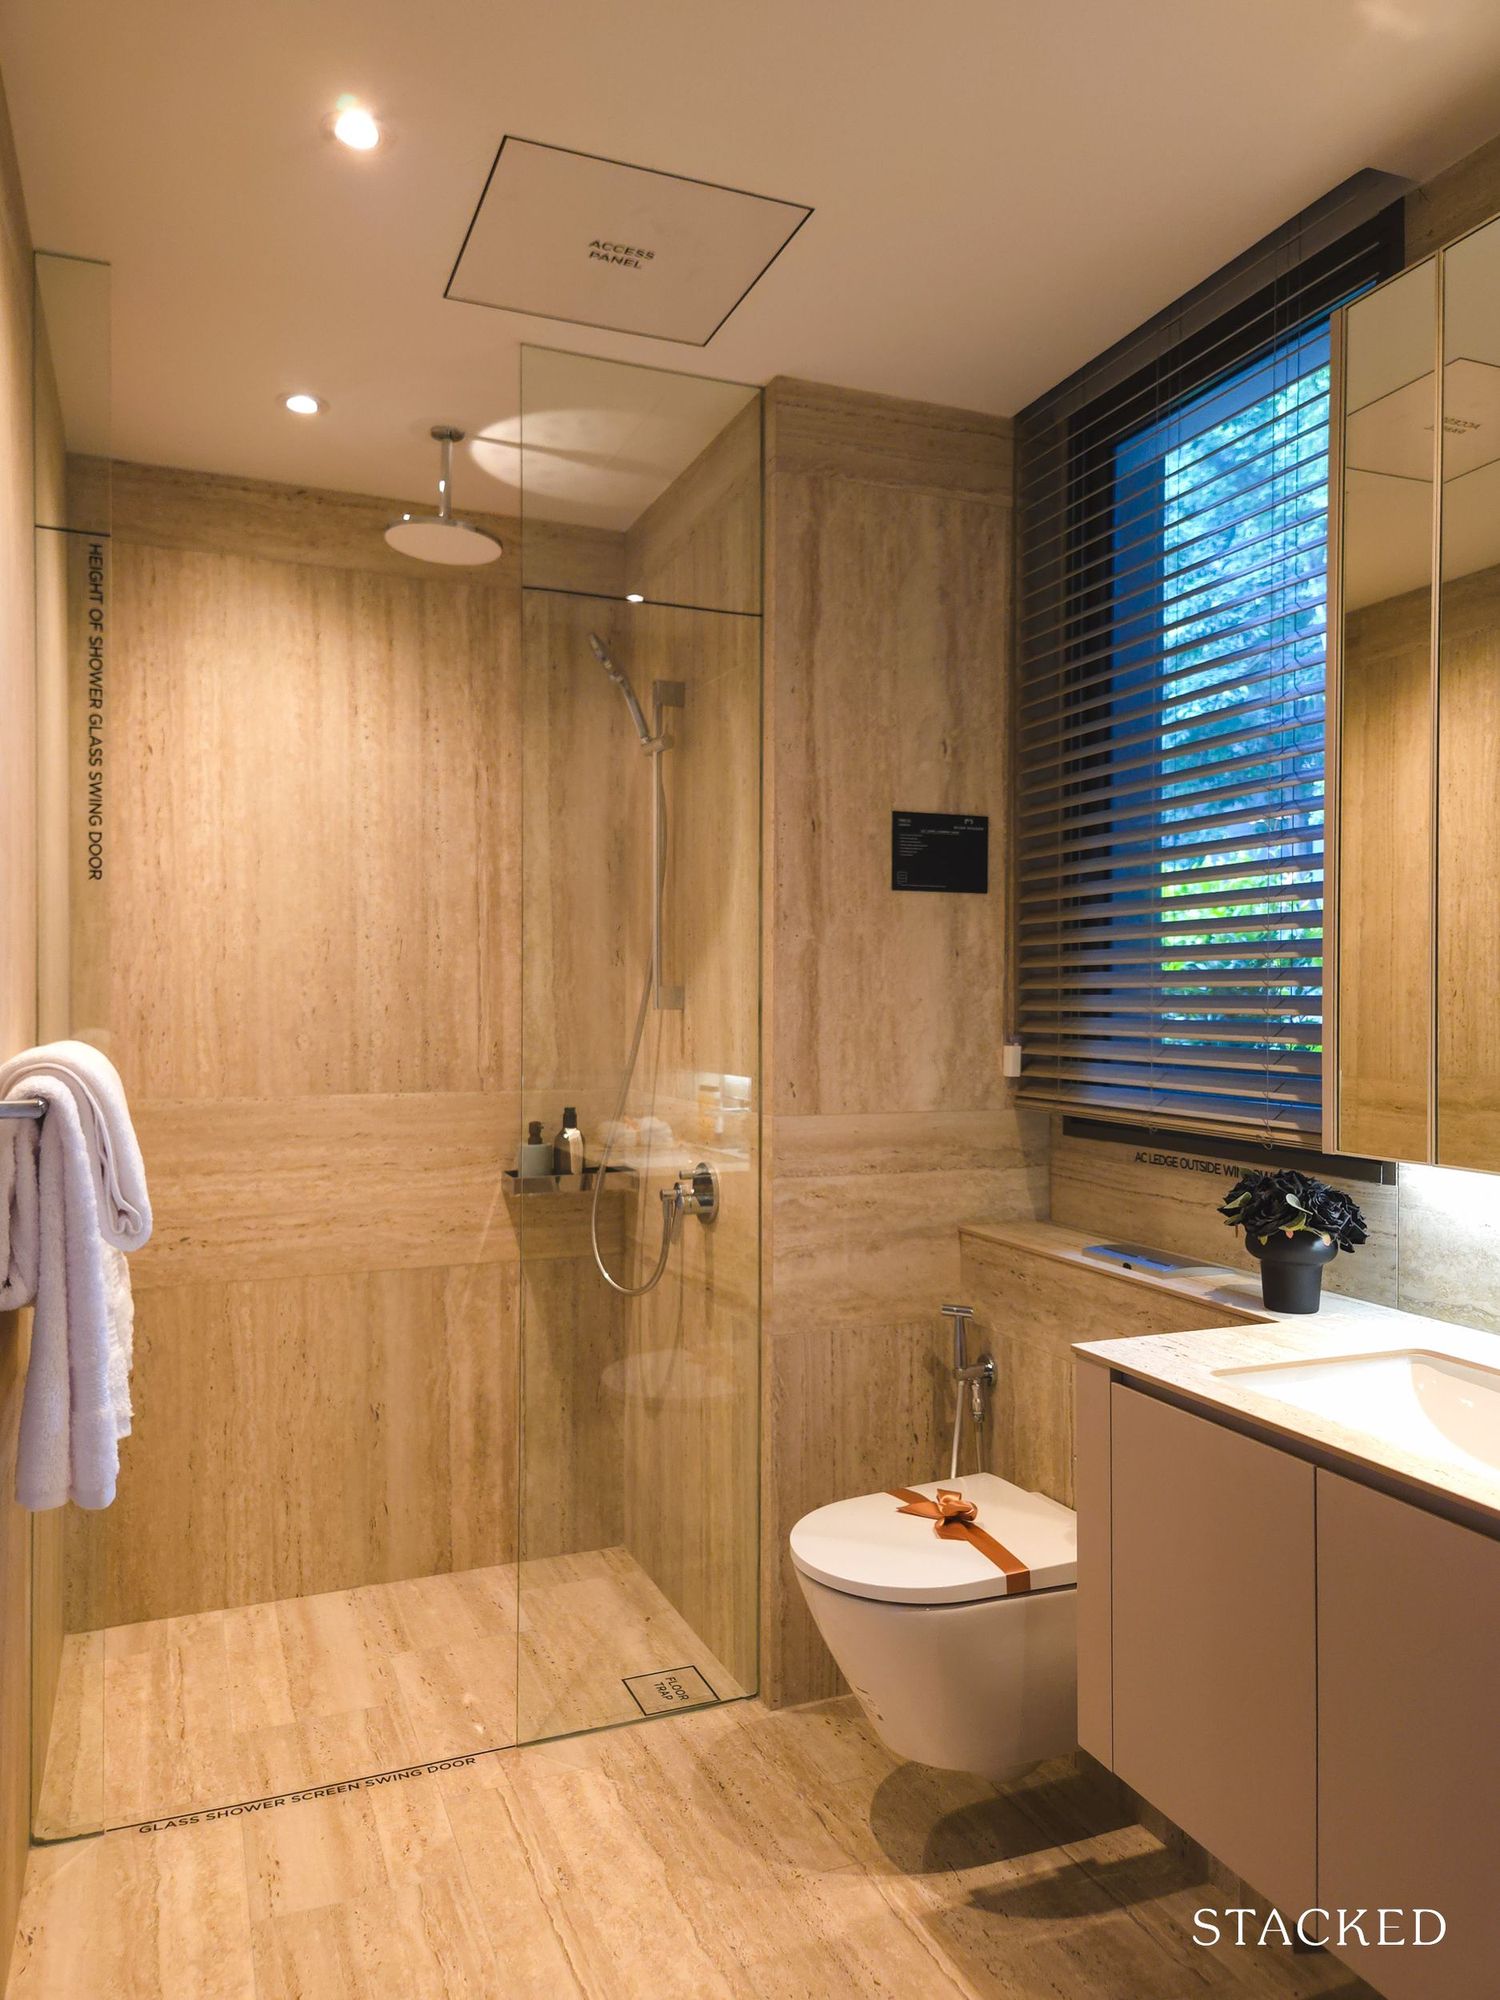
[image: River Modern 4 Bedroom 11]
Caption: Even among some new projects in the CCR, it is rare to find bathrooms with room for a bathtub these days.
The master bathroom reflects the larger scale of the room. In addition to the usual Duravit wall-hung WC, basin and mixers, it includes a bathtub and rain shower. There’s also a window for natural ventilation.
Writer’s Commentary from Cheryl, contributing writer
After spending time looking through River Modern, I don’t see it as a project that’s trying to outdo its neighbours. If anything, it feels like it’s entering at a time when the River Valley story has already been validated. The nearby launches have moved well, so clearly there is still demand for this area of the CCR.
In truth, it’s not radically different from what’s already around it. The riverfront appeal and central convenience have already been established by the surrounding projects. River Modern fits into that same narrative.
I’ve always liked this part of the river, especially near Kim Seng Park. It’s quieter, less touristy, and feels more residential. That balance probably explains why the area continues to draw interest despite the number of recent launches.
At the end of the day, it’s really just riding on what the market already likes and knows the appeal of. And being one of the last river-facing plots in the enclave gives it a certain weight.
Whether it makes sense will likely come down to pricing, but for buyers who already appreciate living along the Singapore River, the appeal is fairly straightforward.
So, keeping this in mind, these are the considerations I would make if I were thinking of buying a unit at River Modern:
- Future CCR Supply and Market Cycle Timing
River Modern is launching after several nearby projects have already entered the market. Zyon Grand, Promenade Peak and River Green have recorded healthy take-up rates, which suggests demand for this stretch of Robertson Quay is still there.
That said, River Modern isn’t arriving in an untested environment. Pricing benchmarks have largely been set by earlier launches, so buyers today are working with fairly clear reference points.
Looking ahead, there are a couple of upcoming GLS parcels to note. River Valley Green (Parcel C) sits within the broader River Valley area and could introduce another residential option nearby. Peck Hay Road, confirmed for 1H2026, is another central site that will keep some activity within the CCR.
Beyond that, however, the bulk of the upcoming GLS pipeline appears to lean towards OCR and RCR locations. In other words, while there may still be one or two new options within the wider central region, the overall supply focus is shifting outward.
For buyers considering River Modern, this suggests two things: competition within the immediate precinct remains relevant in the short term, but longer-term CCR supply (especially along this stretch of the river) is relatively limited compared to other parts of the island.
- River-Facing Premium and internal Stack Differences
Around 70% of the units face the river, which is a big part of the appeal here. Naturally, those stacks (especially on the higher floors), are priced accordingly.
The gap between a low-floor inward-facing unit and a high-floor river-facing one can be quite significant. So the real question is what you’re paying for. Is it the view, or simply the location?
For some buyers, the inward-facing stacks may make more sense. You still get the same MRT connection and access to the neighbourhood, just without the river premium attached.
- How Might River Modern Sit in the Future Resale Market?
Five to ten years down the road, River Modern won’t exist in a vacuum. It’ll be sitting alongside older freehold projects that already have an established presence in Robertson Quay.
Some of those developments offer larger layouts. Others don’t have direct MRT access. So the comparison won’t be straightforward.
If you’re thinking long term, it’s worth asking yourself what buyers in the future will prioritise: newer design and connectivity, or larger freehold space. Entry price today will likely play a big role in how comfortable that comparison feels later.
That said, there are a couple of considerations worth keeping in mind.
- Proximity to River Valley Primary School
Being within 1km of River Valley Primary is a clear plus for families. But it also means living near a very popular school.
The reality is, on weekday mornings, that usually translates to more cars on the road, more parents doing drop-offs, and generally heavier traffic in the immediate area. It’s part and parcel of being close to a well-regarded primary school in a central location.
For some buyers, that’s a worthwhile trade-off. For others who prefer a quieter start to the day, it’s something to think about.
- Price gaps between the lowest- and the highest-floor units
With two 36-storey towers and a strong emphasis on river views, pricing within the project isn’t going to be flat.
The difference between a lower-floor inward-facing unit and a higher-floor river-facing one can be quite wide. In practical terms, you’re almost looking at two different price brackets within the same development.
That’s not unusual for high-rise projects, but it does mean buyers need to be clear about what they’re paying for. If the view is important, the premium will reflect that. If not, some of the lower stacks may feel more sensible from a value standpoint.
At Stacked, we like to look beyond the headlines and surface-level numbers, and focus on how things play out in the real world.
If you’d like to discuss how this applies to your own circumstances, you can reach out for a one-to-one consultation here.
And if you simply have a question or want to share a thought, feel free to write to us at stories@stackedhomes.com — we read every message.
Frequently asked questions
What is the location and main features of River Modern condo?
River Modern is located along River Valley Green in District 9, Singapore. It features two 36-storey towers with river-facing views, direct access to Great World MRT Station, and a mix of two- to four-bedroom units starting from 538 sq ft.
When will River Modern be available for sale and what are the starting prices?
River Modern preview started on Feb 20, with sales booking expected on March 7. The indicative starting prices are from $2,877 psf, approximately $1.548 million for a 538 sq ft two-bedroom unit.
How does the demand for new condos in River Valley look based on recent launches?
Recent launches like River Green, Promenade Peak, and Zyon Grand have sold a significant number of units, indicating strong demand for private homes in the area despite frequent new launches.
What makes River Modern's location appealing to homeowners?
River Modern benefits from a prime location with river views, direct access to Great World MRT Station, proximity to River Valley Primary School, and nearby lifestyle amenities along the Singapore River.
How does River Modern compare architecturally and in terms of design to other projects in the area?
Designed by ipli Architects and P&T Architects, River Modern features river-inspired architecture with sleek, contemporary design, curved crown detailing, and a focus on integrating with the riverfront environment.
Join our Telegram group for instant notifications
Join Now

1 Comments
looks expensive and high supply, price suppression for5-10 years imo.