


Would you surrender your comfortable but old flat, for the sake of your children?
Or would you call that an overreaction? This past week, I met a pair of older Singaporeans who are considering selling off their 40+ year old flat. My first question was “upgrading or rightsizing?”
And I was caught off guard when I was told “Maybe try to ballot for BTO again? Or buy a newer resale flat?”
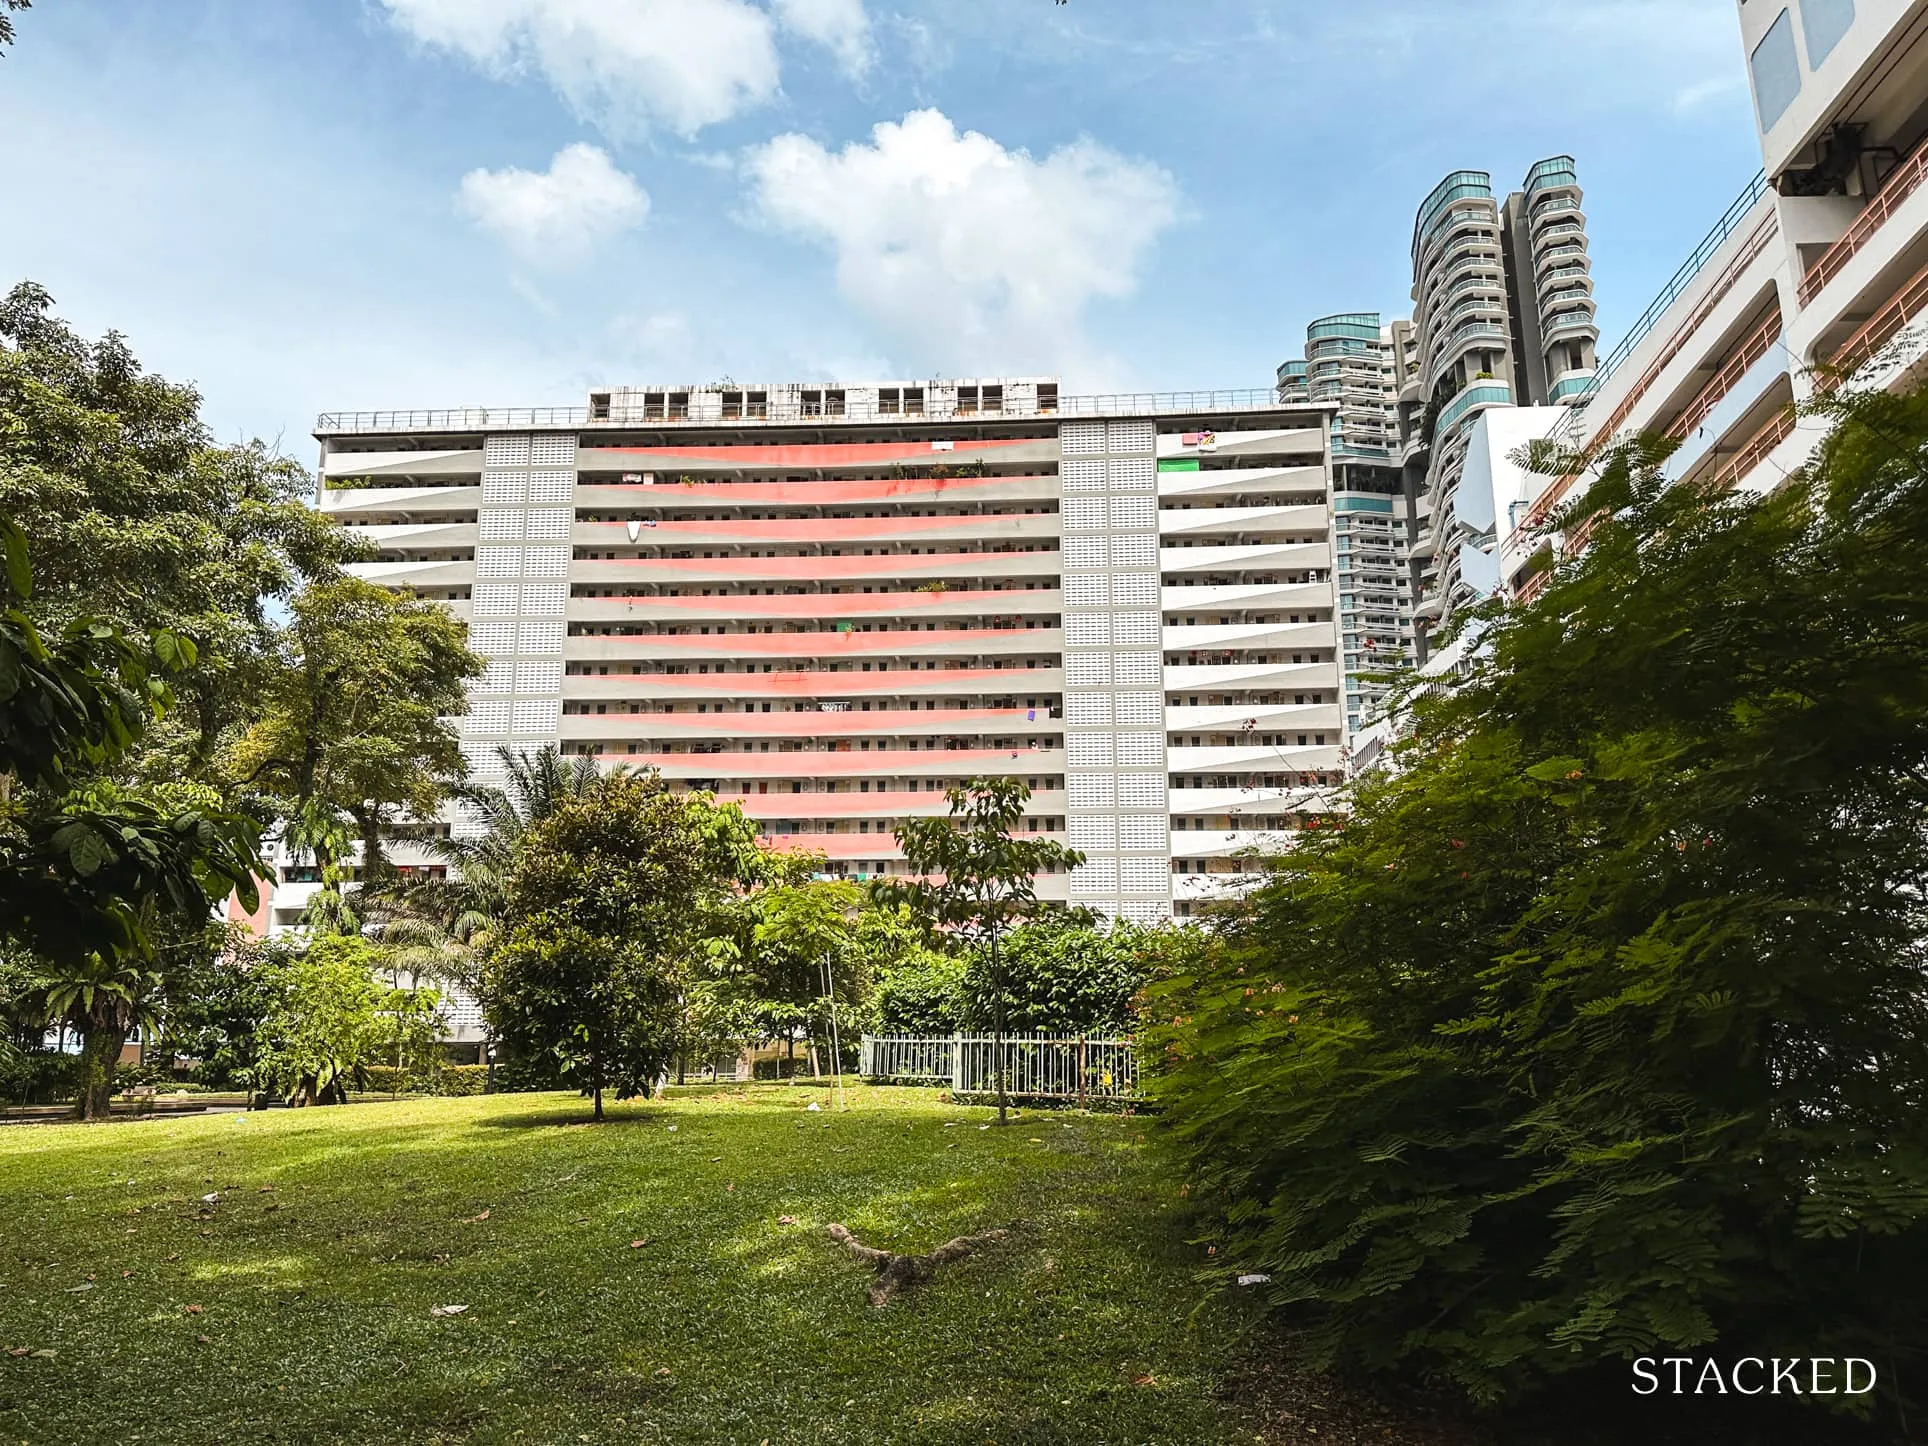
Now this couple have an older (read: bigger-than-today’s model) 4-room flat, in the highly desirable Ang Mo Kio area. And yet they were willing to surrender this, to try and find a newer flat; even if that meant a smaller 3-room flat, or living in a more “ulu” location. The reason, it turns out, wasn’t even for themselves.
It was due to a conversation with some relatives, on how much said relatives’ children had paid for their flat. It was close to $1 million (although I subsequently found out it was a pricier DBSS project). This set of further inquiries on their part, among neighbours, friends, etc.
What unsettled them wasn’t just the prices they were hearing, although that was pretty bad in itself. It was how normal those numbers now seemed to everyone else. I can attest to that being true in the property industry as well, where professionals no longer ask where the next million-dollar flat will be, but where the next $1.5 million flats will be.
This convinced them that their children – who are still older and unmarried – needed urgent help. Their flat was too old to provide for their offspring (or so they felt), and hence the urgency of wanting a newer flat. It wasn’t for themselves, it was so the subsequent generation would be spared the ever rising prices.
This set me off on my own set of inquiries.
After that conversation, I started asking around. Not in a survey sense, but casually: friends’ parents, older couples I’d met before, people I know who lived in older flats. The responses varied, but the worry was familiar.
It most came down to the fact that, for many, they hadn’t seriously looked at the housing market in years. Some hadn’t checked prices since the time NS was still 2.5 years, or when we still had Primary School streaming. So when something snapped their attention back to the market, especially near the post-Covid years, the reaction was a mix of disbelief and shock.
As a quick reminder: it was only little over a decade ago, when the news media was crowing about how we’d controlled flat prices. In 2014, for example, we often read about how Cash Over Valuation (COV) had fallen to zero. After the government implemented the Mortgage Servicing Ratio (MSR), and stopped publishing HDB prices, resale flats were in a tailspin almost all the way until 2018.
So if this was the last point at which you were in the property market then 2026 – or the years right after Covid – would probably come across as a jaw-dropping shock.
But are some of these parents now overreacting, by scrambling for a newer flat?
There isn’t a universal yes or no here, as it’s of course situational.
If their children aren’t doing well for whatever reason, or they have lifelong dependents, then their reaction is plausibly correct. It might make sense to lock in a home for their dependents now, rather than risk serious hardship for said dependents in the future; because they’re almost certainly right that prices will be higher.
On the other hand, these parents are often shocked by the resale market, where prices are shaped by demand, scarcity, etc. BTO flats operate under a very different logic. Their prices are subsidised as needed. While they’re not immune to broader market pressures, they can’t be viewed with the same lens either.
But if there’s no trust that HDB can keep flat prices affordable, or there’s limited understanding of the mechanisms involved, then it’s easy to trip the panic button. And at that point, the parents who do overreact might end up doing themselves some harm.
This is rarely dramatic, but it comes through in quiet ways and becomes obvious much later. Take, for example, older Singaporeans surrendering a home in a mature hub, to live somewhere with worse accessibility.
When you’re 20, 30, 40, etc., it’s a minor annoyance at worst, to need a bus to get to the MRT station. When you’re 70 and using a walker, you’ll fully understand how much harder a “simple bus connection to the MRT” becomes.
The same goes for social networks. Older folks are best served by environments where they know the local coffee shop operators by name, have friends that come by to check on them, and have neighbours who know where they live. That last one is quite important for dementia patients.
Parents may be making big housing decisions to address problems they can imagine (children being unable to afford homes) while overlooking problems that aren’t yet obvious: declining mobility, reduced independence, loss of support structures etc. that only become critical with age.
We shouldn’t overlook the fact that, even if our children enter the housing market later in life than their parents, housing prices are moving up.
Buyers who become homeowners a little bit later may also have higher incomes, are sooner to become dual-income households, or are further along in their careers. Just because a child hasn’t yet become a homeowner by age 35 may not, in itself, be a sign to panic.
Many will still start in the BTO system, where prices are more controlled as mentioned. Others will buy smaller homes, buy later, or have more tempered aspirations. For some, this may not come easy; but it doesn’t mean that a million-dollar resale flat is some kind of baseline for all of them.
I’m not saying that parents are wrong to worry, just that life is more complex than the worst-case scenarios we often play in our heads. There’s a real risk in flattening that complexity into the assumption that – unless we take action right now – our children will be priced out and living under that bridge at Clarke Quay.
Perhaps the most useful takeaway, especially for those who haven’t been in the housing market for a long time, is this: focus on the median.
When people re-enter the conversation through headlines, they tend to fixate on extremes. The million-dollar flat. The record-breaking transaction.
Which is odd, because you know not to focus on, say, the all-time cheapest 5-room flat in Bishan right? That never even makes the news, usually. We ignore that because we know it’s at the far end of the probability curve, and not likely to be within our – or our children’s – lived experience. The same logic should be applied to the top.
For most households, the mortgage numbers they deal with live around the median. This is where policy interventions ultimately land, and the part of the market you and your children will probably deal with.
And to be sure, you’ll still find that housing is more expensive at the median than it was 10 or 20 years ago. But it at least means you’’ be reacting to the most probable outcomes, rather than the extreme and imaginary ones; and you may find that – while your children are paying more than you did – it’s not yet at the point where you have to liquidate a home you love.
Meanwhile in other property news
- River Modern is a new launch that just snagged the absolute last parcel of riverfront land in River Valley. Check out our review of this surprisingly low-quantum District 9 property.
- Did you have any luck with the $12 million Toto draw? If you did, here’s a look at what we’d do with it.
- Cheap 5-room HDB flats near an MRT station? They do exist, as we reveal on Units of the Week.
- Previously, we examined ARTRA as an unusual case of a condo that started out competitively priced, but ended up becoming one of the priciest in its area. This week on Stacked Pro we found out who actually made or lost money off this, and what happens now that it’s no longer “cheap.”
Weekly Sales Roundup (09 – 15 February)
Top 5 Most Expensive New Sales (By Project)
| PROJECT NAME | PRICE S$ | AREA (SQFT) | $PSF | TENURE |
| WATTEN HOUSE | $7,706,000 | 2368 | $3,254 | FH |
| ZYON GRAND | $5,424,000 | 1615 | $3,359 | 99 yrs (2024) |
| NEWPORT RESIDENCES | $4,469,000 | 1227 | $3,642 | FH |
| PINETREE HILL | $4,418,000 | 1733 | $2,549 | 99 yrs (2022) |
| SKYE AT HOLLAND | $4,063,000 | 1238 | $3,282 | 99 yrs (2024) |
Top 5 Cheapest New Sales (By Project)
| PROJECT NAME | PRICE S$ | AREA (SQFT) | $PSF | TENURE |
| NEWPORT RESIDENCES | $1,380,000 | 452 | $3,053 | FH |
| THE LAKEGARDEN RESIDENCES | $1,593,000 | 678 | $2,349 | 99 yrs (2023) |
| COASTAL CABANA | $1,633,000 | 915 | $1,785 | 99 yrs |
| NARRA RESIDENCES | $1,651,000 | 818 | $2,018 | 99 yrs |
| BLOOMSBURY RESIDENCES | $1,721,000 | 689 | $2,498 | 99 yrs (2024) |
Top 5 Most Expensive Resale
| PROJECT NAME | PRICE S$ | AREA (SQFT) | $PSF | TENURE |
| LEEDON RESIDENCE | $16,300,000 | 6125 | $2,661 | FH |
| YONG AN PARK | $7,000,000 | 3229 | $2,168 | FH |
| SOUTH BEACH RESIDENCES | $6,980,000 | 1916 | $3,643 | 99 yrs (2007) |
| THE TATE RESIDENCES | $6,928,000 | 2185 | $3,171 | FH |
| THE TOMLINSON | $6,300,000 | 2347 | $2,685 | FH |
Top 5 Cheapest Resale
| PROJECT NAME | PRICE S$ | AREA (SQFT) | $PSF | TENURE |
| URBAN VISTA | $728,000 | 441 | $1,650 | 99 yrs (2012) |
| LAKE GRANDE | $785,000 | 517 | $1,519 | 99 yrs (2015) |
| MIDWOOD | $806,888 | 484 | $1,666 | 99 yrs (2018) |
| CAVAN SUITES | $815,000 | 452 | $1,803 | FH |
| HILLION RESIDENCES | $815,000 | 463 | $1,761 | 99 yrs (2013) |
Top 5 Biggest Winners
| PROJECT NAME | PRICE S$ | AREA (SQFT) | $PSF | RETURNS | HOLDING PERIOD |
| LEEDON RESIDENCE | $16,300,000 | 6125 | $2,661 | $3,500,000 | 8 Years |
| BOTANIC GARDENS VIEW | $4,200,000 | 1755 | $2,394 | $3,100,000 | 21 Years |
| MONTVIEW | $3,534,000 | 1701 | $2,078 | $2,331,000 | 20 Years |
| ISLAND VIEW | $4,880,000 | 3595 | $1,357 | $2,080,000 | 18 Years |
| BISHAN LOFT | $2,398,888 | 1378 | $1,741 | $1,779,684 | 25 Years |
Top 5 Biggest Losers
| PROJECT NAME | PRICE S$ | AREA (SQFT) | $PSF | RETURNS | HOLDING PERIOD |
| MARINA ONE RESIDENCES | $2,240,000 | 1109 | $2,020 | -$370,900 | 11 Years |
| IRWELL HILL RESIDENCES | $995,000 | 398 | $2,498 | -$159,000 | 4 Years |
| THE COAST AT SENTOSA COVE | $3,025,000 | 2024 | $1,495 | -$125,000 | 5 Years |
| STELLAR RV | $1,030,000 | 538 | $1,914 | -$107,600 | 14 Years |
| CORALS AT KEPPEL BAY | $1,780,000 | 990 | $1,797 | -$96,000 | 9 Years |
Top 5 Biggest Winners (ROI%)
| PROJECT NAME | PRICE S$ | AREA (SQFT) | $PSF | ROI (%) | HOLDING PERIOD |
| BISHAN LOFT | $2,398,888 | 1378 | $1,741 | 287% | 25 Years |
| BOTANIC GARDENS VIEW | $4,200,000 | 1755 | $2,394 | 282% | 21 Years |
| LEGENDA AT JOO CHIAT | $2,300,000 | 1948 | $1,181 | 259% | 22 Years |
| THE CENTRIS | $2,285,000 | 1324 | $1,726 | 235% | 19 Years |
| THE DEW | $1,500,000 | 1206 | $1,244 | 223% | 25 Years |
Top 5 Biggest Losers (ROI%)
| PROJECT NAME | PRICE S$ | AREA (SQFT) | $PSF | ROI (%) | HOLDING PERIOD |
| MARINA ONE RESIDENCES | $2,240,000 | 1109 | $2,020 | -14% | 11 Years |
| IRWELL HILL RESIDENCES | $995,000 | 398 | $2,498 | -14% | 4 Years |
| STELLAR RV | $1,030,000 | 538 | $1,914 | -9% | 14 Years |
| CORALS AT KEPPEL BAY | $1,780,000 | 990 | $1,797 | -5% | 9 Years |
| THE COAST AT SENTOSA COVE | $3,025,000 | 2024 | $1,495 | -4% | 5 Years |
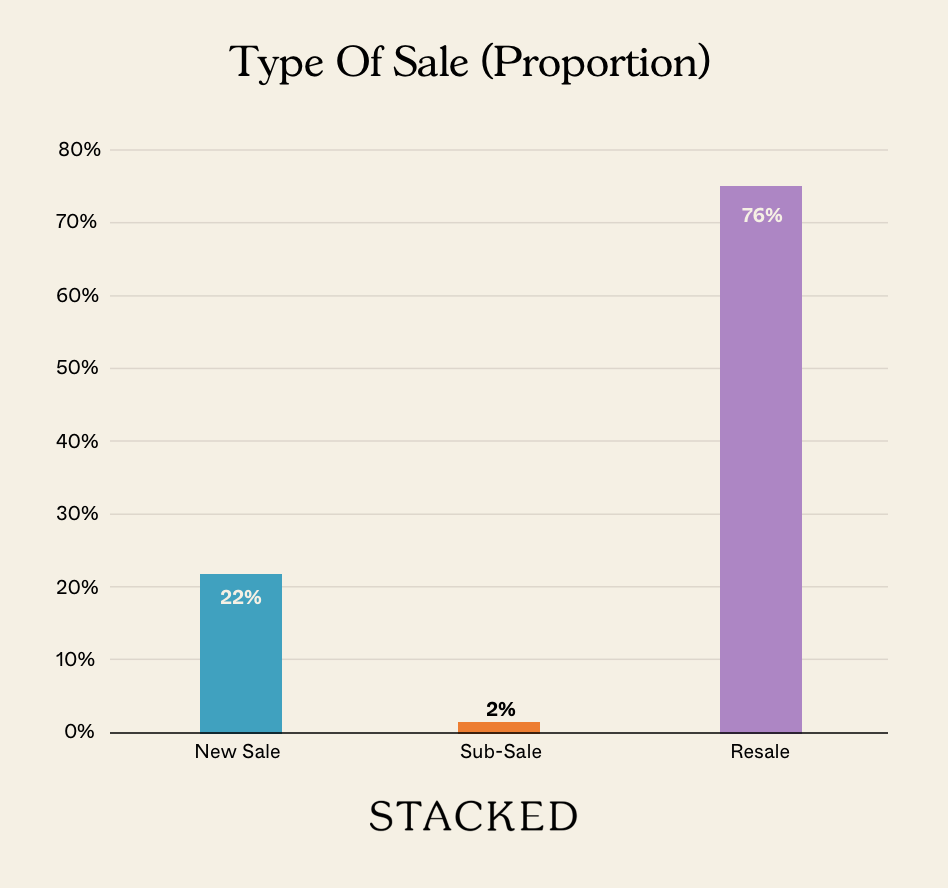
Transaction Breakdown
Follow us on Stacked for news and insights on the Singapore property market.
At Stacked, we like to look beyond the headlines and surface-level numbers, and focus on how things play out in the real world.
If you’d like to discuss how this applies to your own circumstances, you can reach out for a one-to-one consultation here.
And if you simply have a question or want to share a thought, feel free to write to us at stories@stackedhomes.com — we read every message.

0 Comments