How A Clement Canopy Condo Buyer Made $700K More Than Their Neighbours: A Data Breakdown On Timing


A seasoned content strategist with over 17 years in the real estate and financial journalism sectors, Ryan has built a reputation for transforming complex industry jargon into accessible knowledge. With a track record of writing and editing for leading financial platforms and publications, Ryan's expertise has been recognised across various media outlets. His role as a former content editor for 99.co and a co-host for CNA 938's Open House programme underscores his commitment to providing valuable insights into the property market.
In this Stacked Pro breakdown:
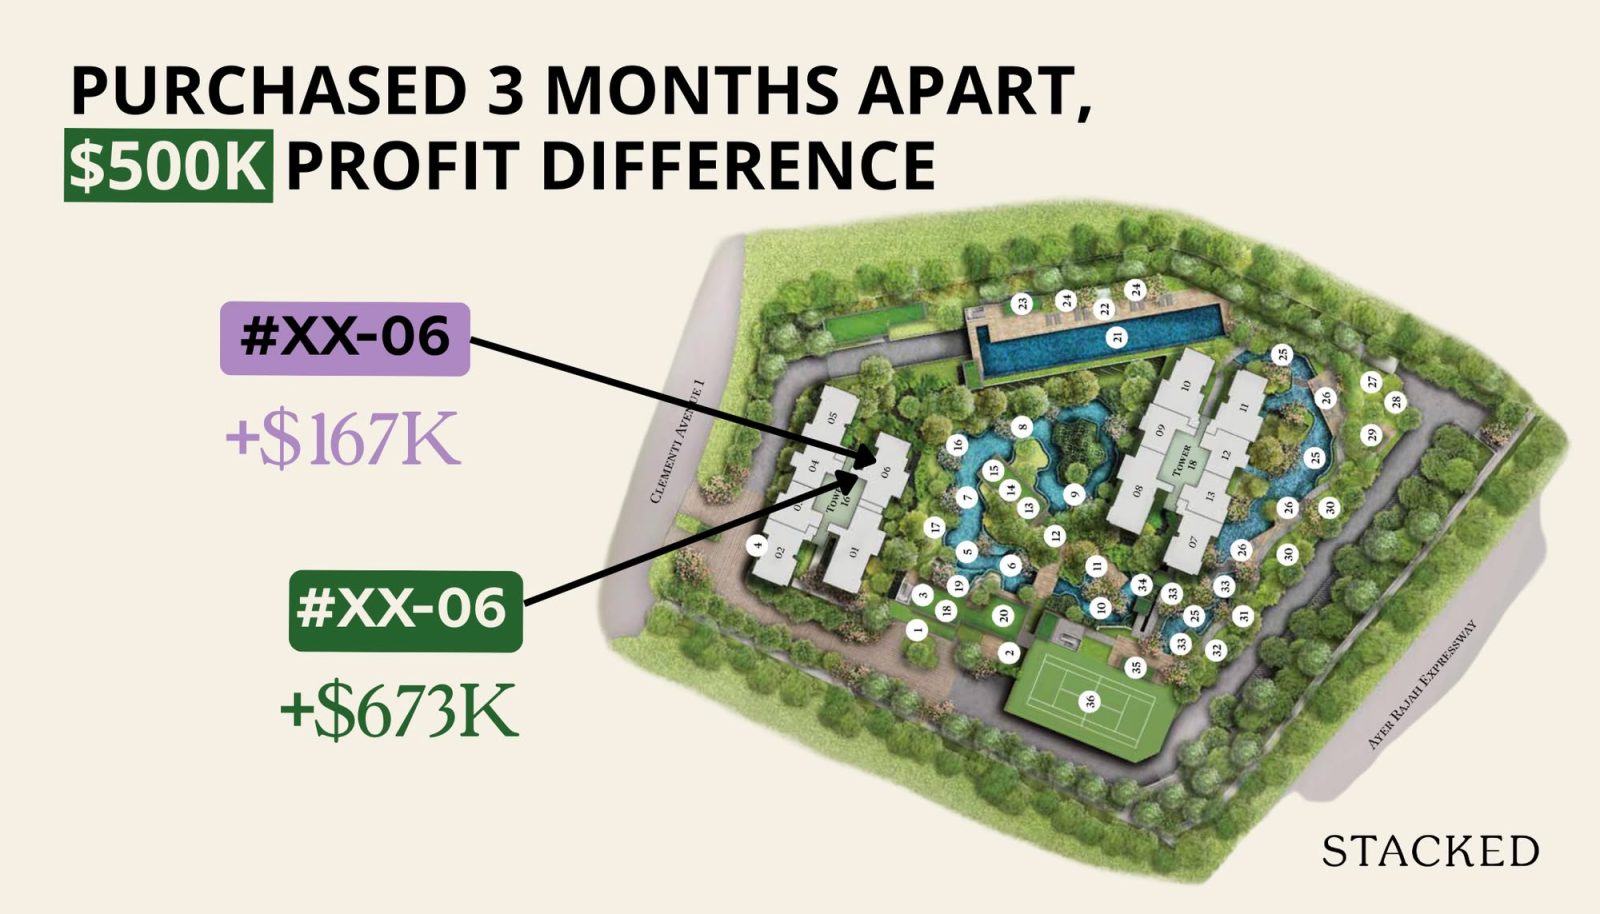
- We tracked resale outcomes across all 2- to 4-bedders at Clement Canopy to find out if early birds really did better
- One standout buyer made over $700K in gains, while others who bought months later paid up to 18% more for similar stacks and saw smaller returns
- We break down how small differences in floor levels, timing, and layout add up to big differences in profit
Already a subscriber? Log in here.
In this series, we examine the outcomes of those who purchased their units earlier in a new launch, versus those who purchased their units later. This week, we’ll explore this concept in the Clementi-area project of Clement Canopy, which launched back in February 2017. Let’s see if the earliest, or latest, buyers of Clement Canopy at launch fared better:
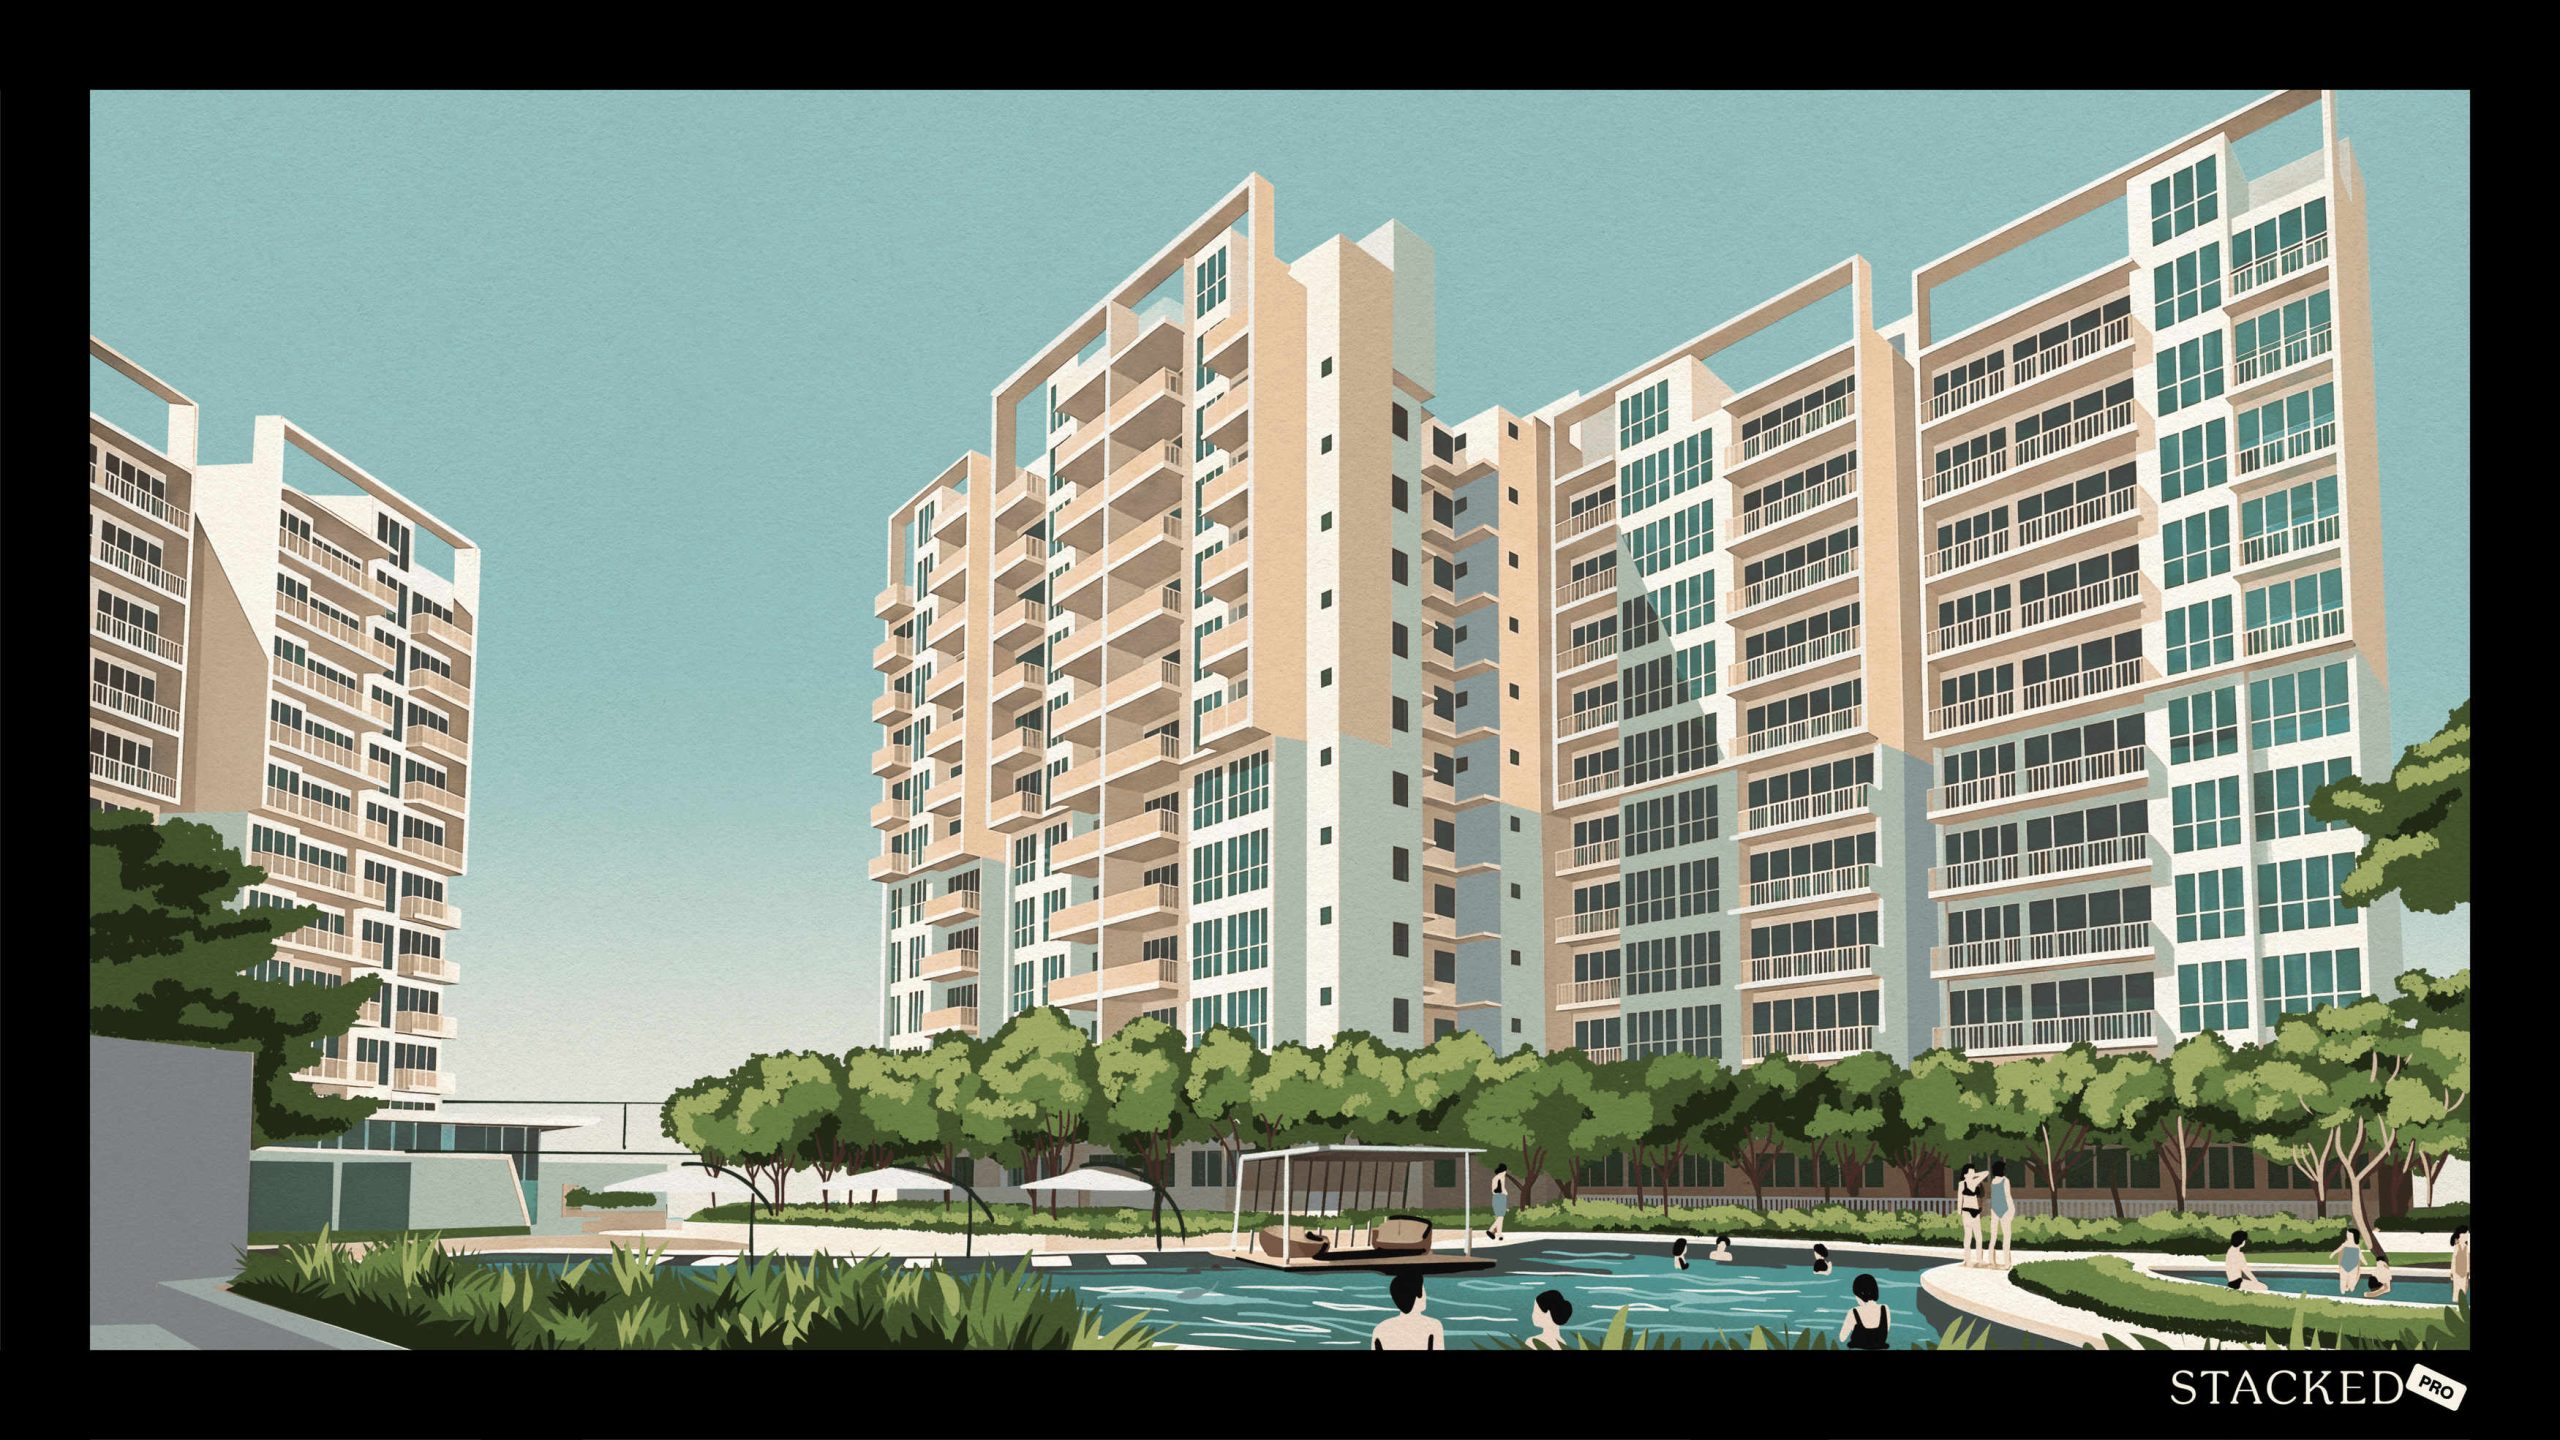
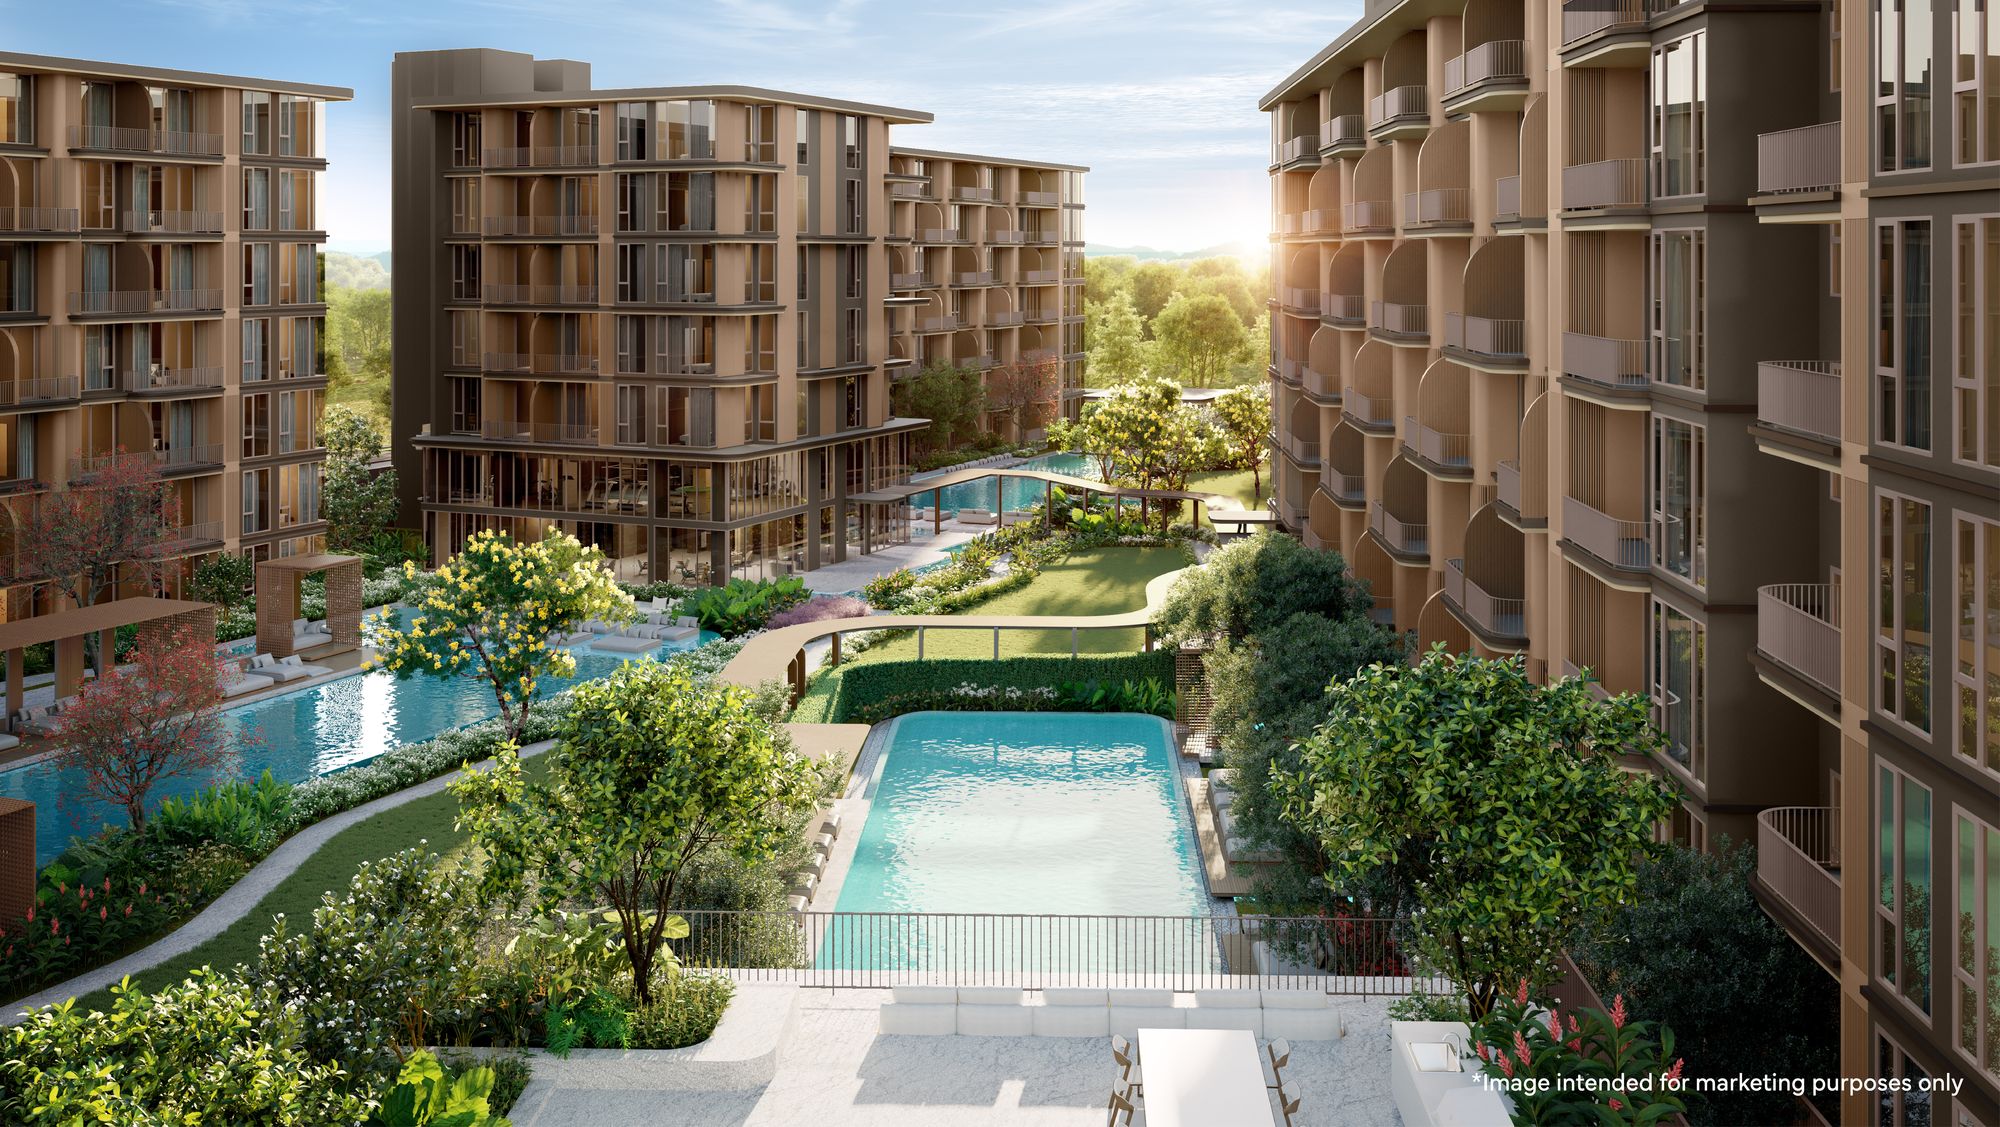
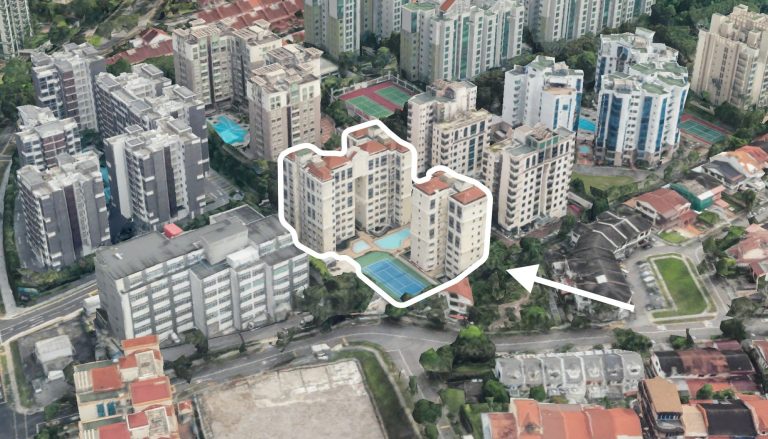
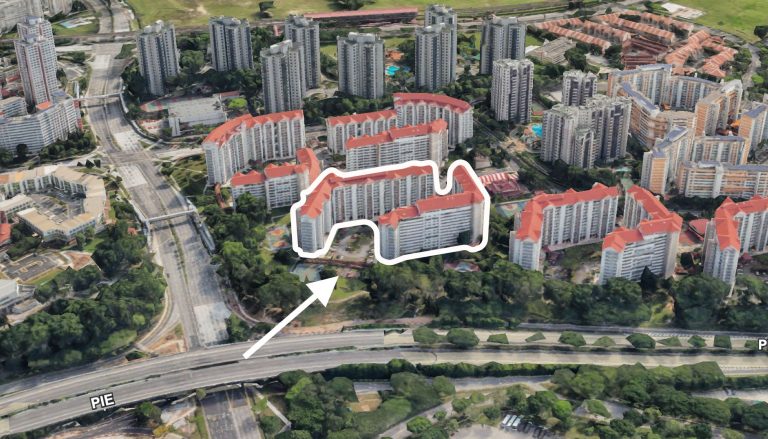
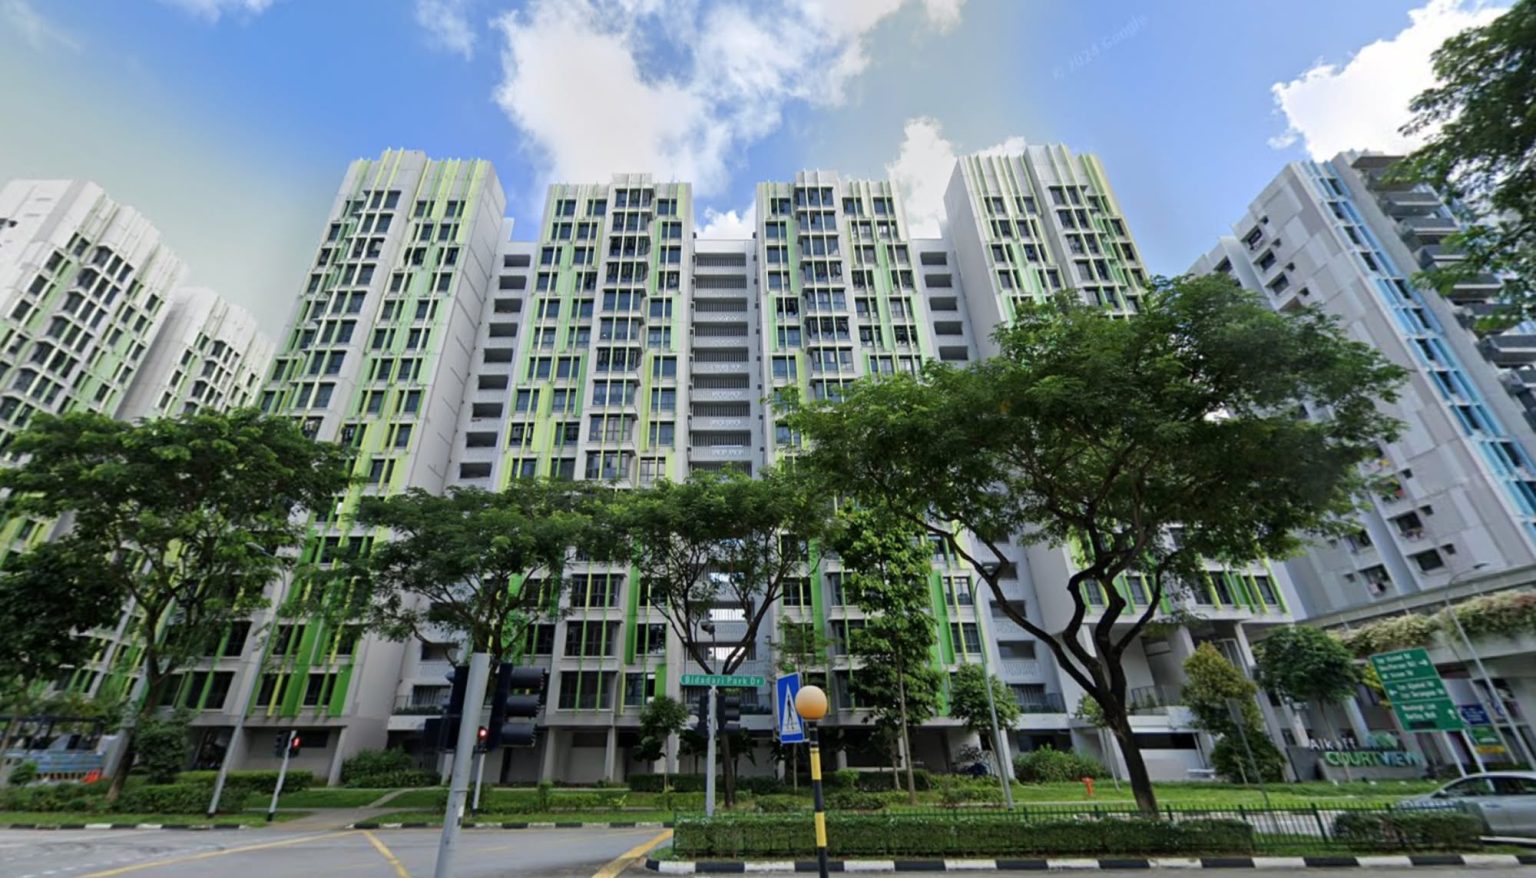
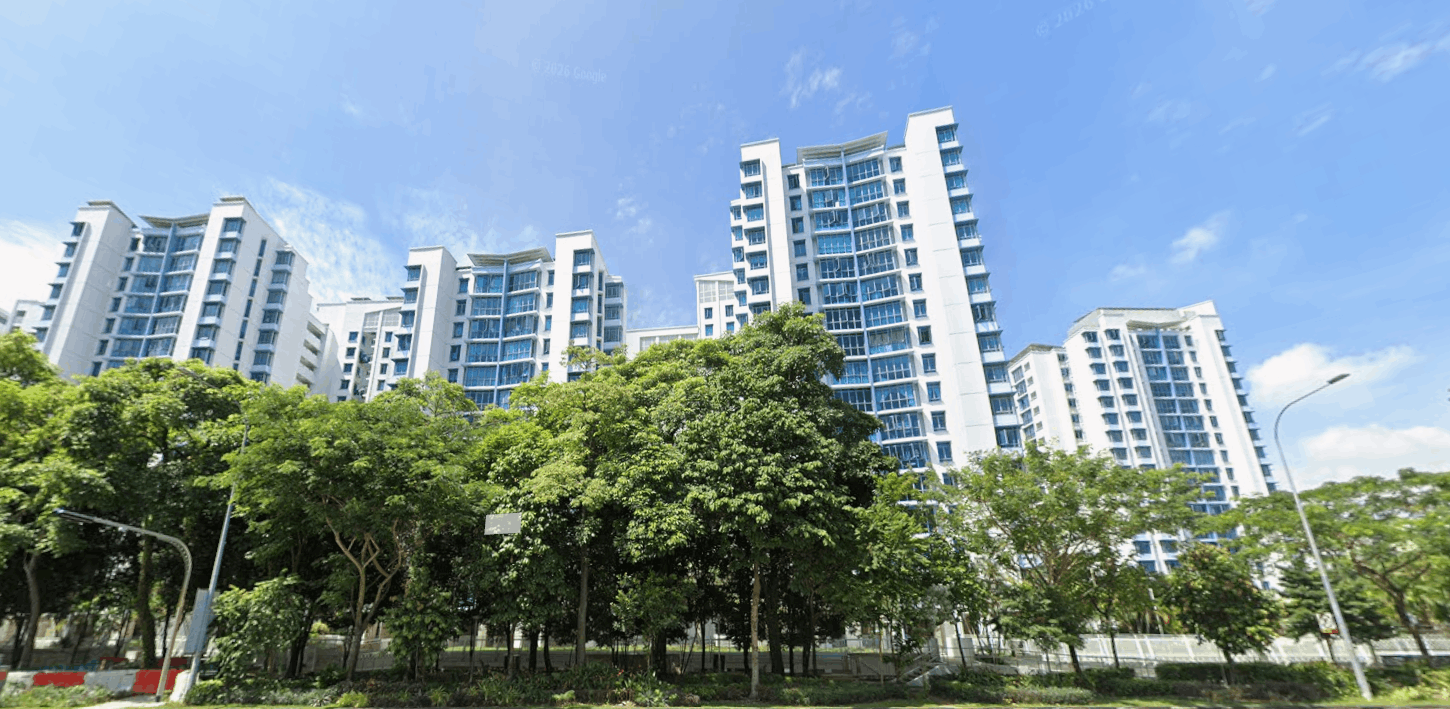
A rundown on Clement Canopy
Clement Canopy is a leasehold, 505-unit condo in District 5, which was launched in February 2017 and completed in 2019. The average annualised return seen for this project is 4.2 per cent, with an average holding period of just over five years. Do note that the year of Clement Canopy’s launch, 2017, was a lower point for the property market, which had been cooled by repeated measures since 2013.
To examine whether earlier or later buyers did better, we’re analysing all the new to sub-sale and resale transactions since the launch. We’ll also break it down by unit sizes, as these can show a notable difference in performance.
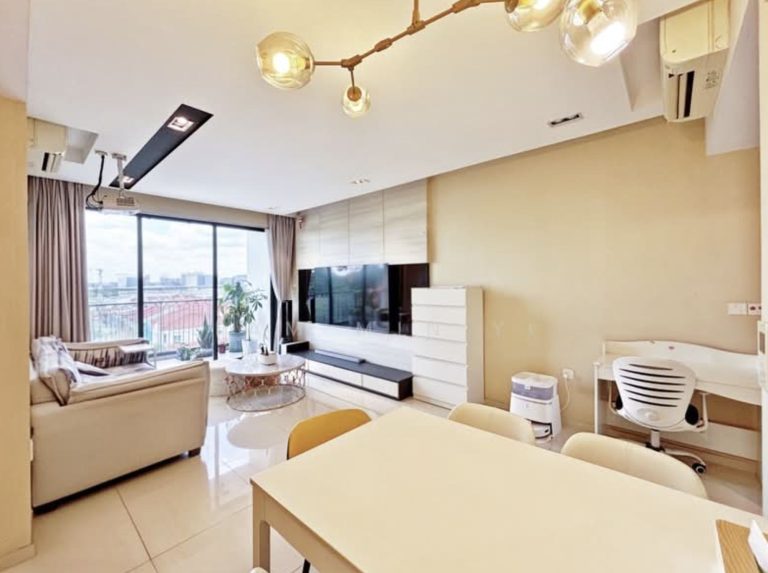
Looking at 2-bedroom transactions (Type A1 layout)

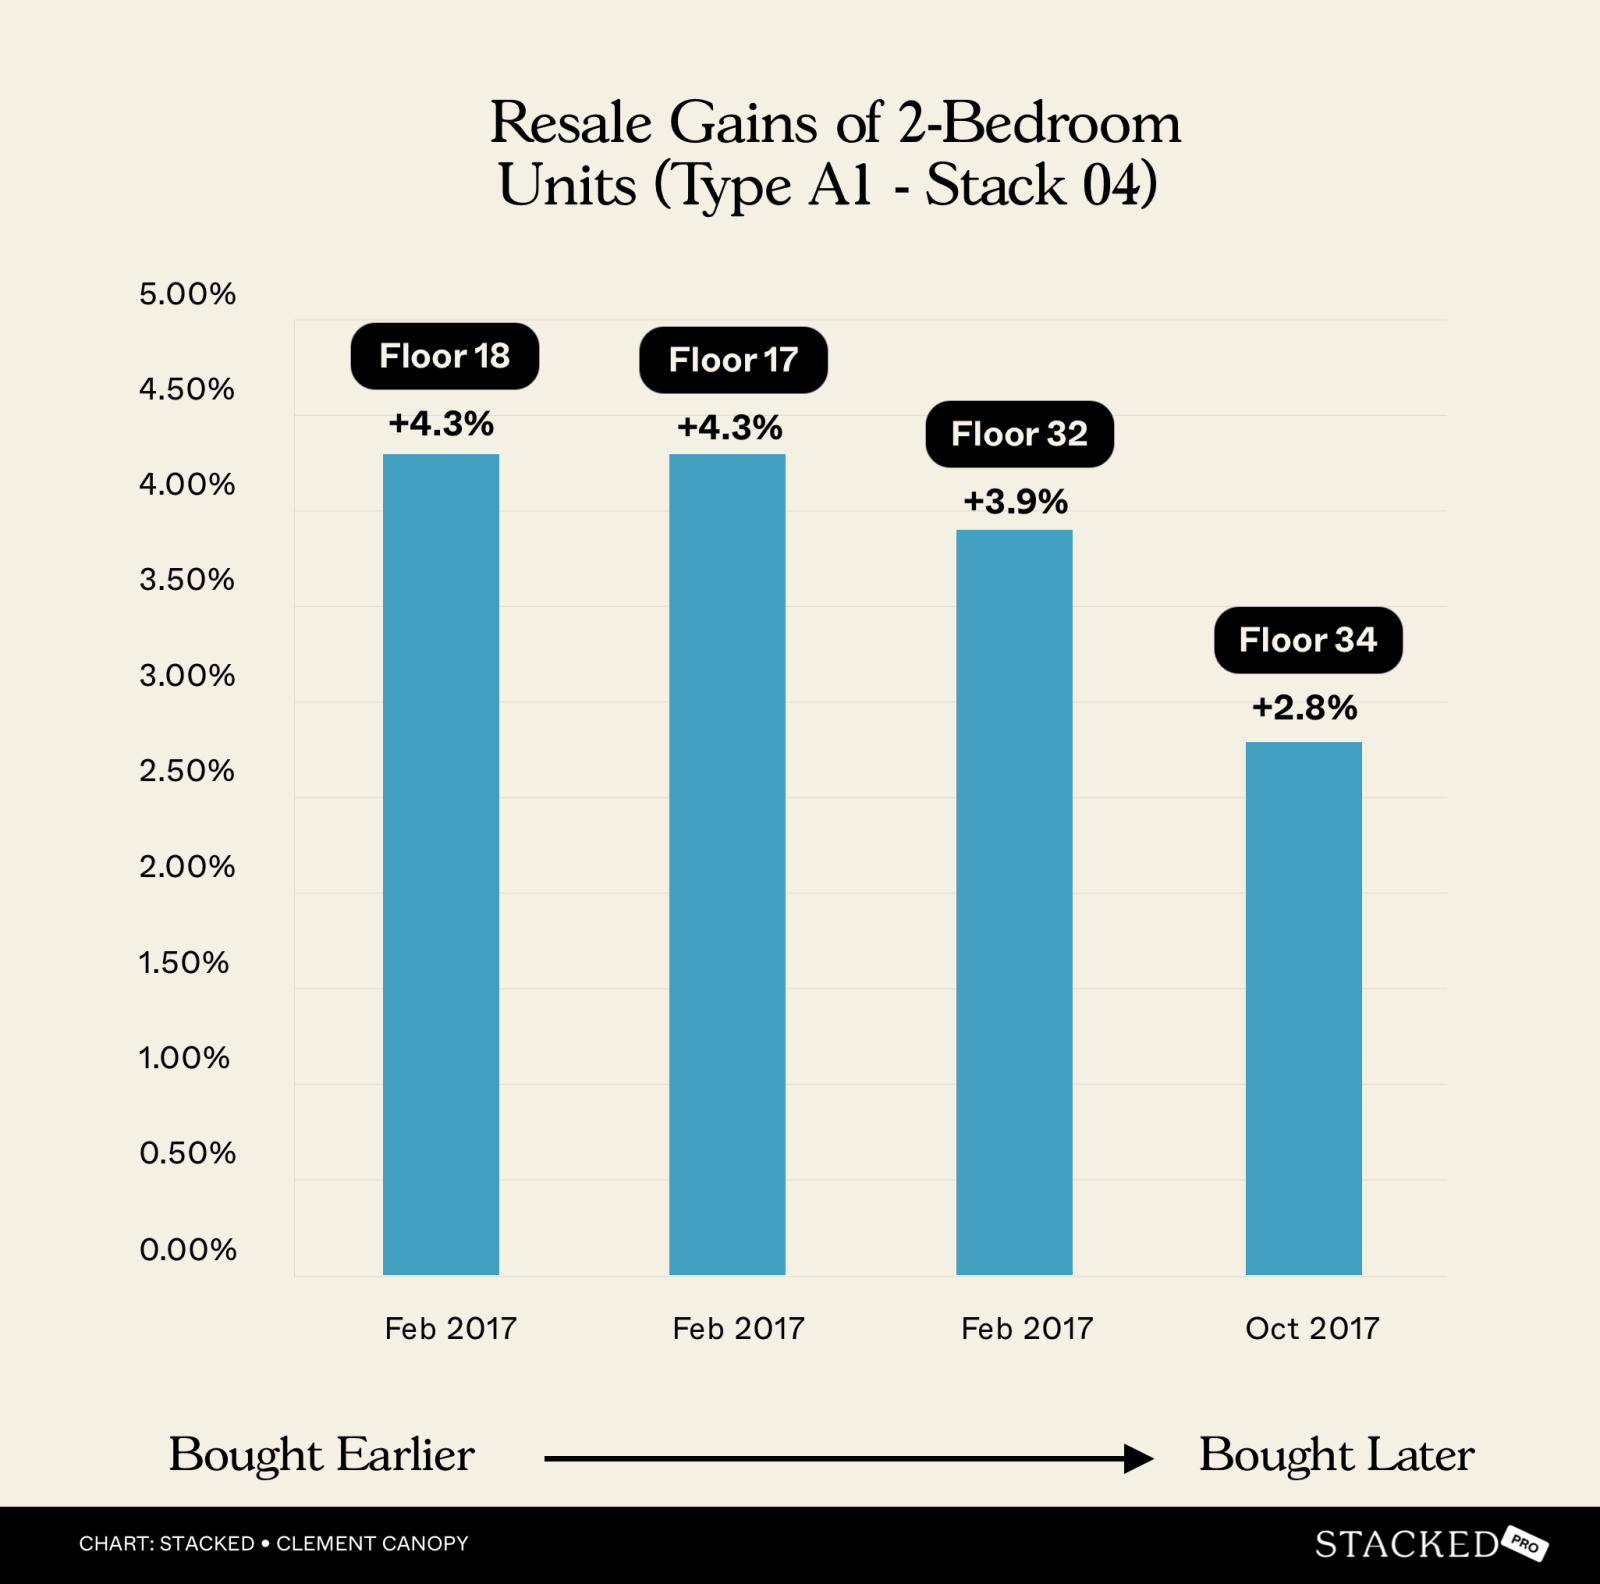
Note: There are different types of 2-bedder layouts, so we’ll examine them separately.
Sold on | Address | Size | Bedrooms | Sale PSF | Profit/loss | Purchase PSF | Purchase date | Days | Years | Annualised (%) |
31 Jul 2023 | 16 Clementi Avenue 1 #18-04 | 635 | 2 | 1,823 | 274,000 | 1,392 | 24 Feb 2017 | 2,348 | 6.4 | 4.3 |
18 Mar 2024 | 16 Clementi Avenue 1 #17-04 | 635 | 2 | 1,871 | 306,000 | 1,389 | 25 Feb 2017 | 2,578 | 7.1 | 4.3 |
3 Oct 2023 | 16 Clementi Avenue 1 #32-04 | 635 | 2 | 1,871 | 263,000 | 1,457 | 25 Feb 2017 | 2,411 | 6.6 | 3.9 |
29 Sep 2022 | 16 Clementi Avenue 1 #34-04 | 635 | 2 | 1,858 | 153,000 | 1,617 | 18 Oct 2017 | 1,807 | 5.0 | 2.8 |
At first glance, those who bought earlier in the launch (February 2017) saw better returns than those who bought at a later stage (October 2017). This can be seen in the annualised returns of around 4.3 per cent for the earlier buyers, versus returns of around 2.8 per cent for later buyers.
You can see that, in the earliest launch phases, the price differences between units on different floors were smaller: #18-04 was priced at just 0.2 per cent higher than #17-04.
But, in later stages of the launch, the price difference became more significant: #32-04 (bought in February 2017) versus #34-04 (bought in October 2017) had a price difference of around 11 per cent, far wider than the previous pair.
But note that despite #32-04 being bought later, it still managed to outperform #34-04. This may be partly due to #32-04 having a longer holding period of 6.6 years.
Looking at 2-bedroom transactions (Type A2 layout)

Sold on | Address | Size | Bedrooms | Sale PSF | Profit/loss | Purchase PSF | Purchase date | Days | Years | Annualised (%) |
29 Apr 2022 | 18 Clementi Avenue 1 #28-09 | 657 | 2 | 1,767 | 214,000 | 1,441 | 25 Feb 2017 | 1,889 | 5.2 | 4 |
28 Dec 2021 | 18 Clementi Avenue 1 #26-09 | 657 | 2 | 1,599 | 111,000 | 1,430 | 5 Mar 2017 | 1,759 | 4.8 | 2.3 |
11 Aug 2022 | 18 Clementi Avenue 1 #33-09 | 657 | 2 | 1,843 | 198,000 | 1,541 | 25 Aug 2017 | 1,812 | 5.0 | 3.7 |
3 Jan 2023 | 18 Clementi Avenue 1 #34-09 | 657 | 2 | 1,858 | 102,000 | 1,703 | 24 Feb 2018 | 1,774 | 4.9 | 1.8 |
We can see units purchased earlier, such as #28-09, generally saw higher annualised returns than later purchases like #34-09. It’s especially noteworthy that when we compare #33-09 (August 2017) and #34-09 (February 2018), we can see the earlier purchase saw almost double the profit. This is despite the two units having an almost similar holding period.
Similar to the A1 layout 2-bedders, we also noticed the price differences between floors started out small, then increased substantially in later sales:
In February to March 2017, #28-09 was priced just 0.2 per cent above #26-09.
But around a year later, #34-09 (bought in February 2018) was priced at 10.5 per cent higher than #33-09 (bought in August 2017).
If we compare #34-09 to #28-09, the price difference is a dramatic 18 per cent increase; a difference of three per cent per storey, versus a mere 0.8 per cent difference for a two-storey difference, earlier in the sales.
Next, we look at the Type B1 2-bedders, which also have an added bathroom

Sold on | Address | Size | Bedrooms | Sale PSF | Profit/loss | Purchase PSF | Purchase date | Days | Years | Annualised (%) |
26 Mar 2024 | 18 Clementi Avenue 1 #38-12 | 710 | 2 | 1,971 | 337,000 | 1,496 | 25 Feb 2017 | 2,586 | 7.1 | 4 |
3 May 2021 | 18 Clementi Avenue 1 #22-12 | 710 | 2 | 1,672 | 176,000 | 1,425 | 25 Feb 2017 | 1,528 | 4.2 | 3.9 |
1 Oct 2021 | 18 Clementi Avenue 1 #40-12 | 710 | 2 | 1,813 | 173,000 | 1,569 | 9 Aug 2017 | 1,514 | 4.1 | 3.5 |
20 Aug 2024 | 18 Clementi Avenue 1 #24-12 | 710 | 2 | 1,900 | 268,000 | 1,523 | 10 Sep 2017 | 2,536 | 6.9 | 3.2 |
Earlier purchases show better returns here. This is easily seen if we compare #38-12 and #24-12. The former, which was bought earlier in February, saw gains of about $70,000 more than the latter, which was bought in September. Note that the two units had roughly similar holding periods, so we can eliminate that as a factor.
Again, we see a similar trend where the price difference during early stages was small, but widened in later sales.
#40-12 was sold at just around five per cent higher than #38-12 in February, with a two-storey difference between them. But if we compare #24-12 (sold in September) with #22-12 (sold in February), the gap for the same two-storey difference has widened to seven per cent.
Now let’s compare the Type C1 3-bedder units

Sold on | Address | Size | Bedrooms | Sale PSF | Profit/loss | Purchase PSF | Purchase date | Days | Years | Annualised (%) |
24 Jul 2024 | 16 Clementi Avenue 1 #18-05 | 990 | 3 | 1,909 | 574,000 | 1,329 | 24 Feb 2017 | 2,707 | 7.4 | 5 |
27 Aug 2021 | 16 Clementi Avenue 1 #38-05 | 990 | 3 | 1,705 | 310,000 | 1,392 | 22 Apr 2017 | 1,588 | 4.4 | 4.8 |
3 May 2023 | 16 Clementi Avenue 1 #37-05 | 990 | 3 | 1,843 | 424,000 | 1,415 | 3 Jun 2017 | 2,160 | 5.9 | 4.6 |
7 Mar 2023 | 16 Clementi Avenue 1 #02-05 | 990 | 3 | 1,676 | 298,000 | 1,375 | 29 Jul 2018 | 1,682 | 4.6 | 4.4 |
Earlier buyers won out in this batch. Earlier purchases (February to April) benefited from relatively lower purchase prices, and the unit with the highest annualised return – #18-05 – was also the earliest to be bought. That said, it also had the longest holding period among the bunch.
Another clear example is #37-05 versus #38-05:
#37-05 costs 1.65 per cent more than #38-05, despite being on a lower floor, which shows how much of a difference buying in June versus April could make. The price difference was even more dramatic toward the end of the launch: by that point, #02-05 was sold at 3.5 per cent more than #18-05, despite being 16 storeys lower!
Next, we’ll compare 3-bedders with the D1 layout, which includes a +1

Sold on | Address | Size | Bedrooms | Sale PSF | Profit/loss | Purchase PSF | Purchase date | Days | Years | Annualised (%) |
24 Jun 2021 | 18 Clementi Avenue 1 #22-11 | 1,109 | 3 | 1,578 | 309,000 | 1,300 | 25 Feb 2017 | 1,580 | 4.3 | 4.6 |
5 Oct 2021 | 18 Clementi Avenue 1 #28-11 | 1,109 | 3 | 1,586 | 254,000 | 1,357 | 4 Jun 2017 | 1,584 | 4.3 | 3.7 |
18 May 2023 | 18 Clementi Avenue 1 #25-11 | 1,109 | 3 | 1,821 | 389,888 | 1,469 | 25 Apr 2018 | 1,849 | 5.1 | 4.3 |
19 Jan 2024 | 18 Clementi Avenue 1 #06-11 | 1,109 | 3 | 1,804 | 427,000 | 1,419 | 21 May 2018 | 2,069 | 5.7 | 4.3 |
Again, we see the best returns came from the earliest purchase: this was #22-11, which was bought in February and showed a 4.6 per cent return.
As with the Type C1 three-bedders, we can also see the price difference between levels increasing as sales went on. For example, #06-11, which was sold toward the end of the launch in May 2018, was priced at 9.2 per cent higher than #22-11, despite being 16 floors lower. As a result, despite its longer holding period and selling in a hotter property market, it made about the same annualised returns as #22-11.
Earlier, unit #28-11 only cost 4.4 per cent more than #22-11, despite being six storeys higher. But these two units were only purchased four months apart, showing a lower difference at the time.
Now let’s look at the largest type of 3-bedders in this project, type D2

Sold on | Address | Size | Bedrooms | Sale PSF | Profit/loss | Purchase PSF | Purchase date | Days | Years | Annualised (%) |
18 Oct 2024 | 16 Clementi Avenue 1 #10-06 | 1,141 | 3 | 1,884 | 673,000 | 1,294 | 25 Feb 2017 | 2,792 | 7.6 | 5 |
16 Sep 2019 | 16 Clementi Avenue 1 #38-06 | 1,141 | 3 | 1,551 | 167,000 | 1,405 | 21 May 2017 | 848 | 2.3 | 4.4 |
3 Nov 2022 | 16 Clementi Avenue 1 #35-06 | 1,141 | 3 | 1,779 | 423,000 | 1,408 | 18 Aug 2017 | 1,903 | 5.2 | 4.6 |
16 May 2023 | 16 Clementi Avenue 1 #01-06 | 1,141 | 3 | 1,823 | 478,000 | 1,404 | 31 Oct 2017 | 2,023 | 5.5 | 4.8 |
Again, the top performer (#10-06) was the unit bought earliest, which backs the argument that buying earlier is generally better. However, it’s worth noting again that it also had the longest holding period.
That being said, take note of #35-06 and #01-06. These two units were purchased in August and October, respectively, but both have very similar holding periods; that makes them good for comparison. And we can see that, despite #01-06 being bought later (and being a ground floor unit), it made $55,000 more than #35-06. There is an unusual element to this transaction though, as despite #35-06 being a higher floor unit, it was only $4 more psf than the ground floor unit. The buyer could likely have made a lot more if they had held on a little longer.
The price difference between floors was also smaller in the early stages versus later. Despite there being a significant 28-storey difference between #38-06 and #10-06, the price of #38-06 was only 8.6 per cent higher than #10-06. That would have made it a remarkable value buy at the time.
Finally, let’s look at the 4-bedders

Sold on | Address | Size | Bedrooms | Sale PSF | Profit/loss | Purchase PSF | Purchase date | Days | Years | Annualised (%) |
28 Feb 2023 | 18 Clementi Avenue 1 #23-08 | 1,346 | 4 | 1,821 | 743,000 | 1,269 | 25 Feb 2017 | 2,194 | 6.0 | 6.2 |
10 Nov 2020 | 18 Clementi Avenue 1 #11-08 | 1,346 | 4 | 1,491 | 354,000 | 1,228 | 25 Feb 2017 | 1,354 | 3.7 | 5.4 |
10 Jan 2024 | 18 Clementi Avenue 1 #20-08 | 1,346 | 4 | 1,895 | 806,000 | 1,296 | 10 May 2017 | 2,436 | 6.7 | 5.9 |
4 Apr 2022 | 18 Clementi Avenue 1 #14-08 | 1,346 | 4 | 1,590 | 423,000 | 1,276 | 21 May 2017 | 1,779 | 4.9 | 4.6 |
The highest returns were from #23-08, which tied with #11-08 for the purchase date. While #11-08 didn’t seem to perform as well despite the early purchase, do take note of the holding period:
#11-08 had a very competitive entry price of $1,228 psf, the lowest on the 4-bedder list. What brought down its performance is its much shorter holding period of 3.7 years. If it had been held as long as #23-08 (i.e., six years), the return could well have been similar or even higher.
A quirk of the 4-bedders is that they have a smaller price difference between them. This is partly due to the nature of the large units, which move more slowly and are more catered to family buyers.
We still see the pattern of lower floor units eventually costing more than higher floor units if they’re bought later. However, the difference is less dramatic compared to smaller 2 and 3-bedders. For example: #14-08, which was bought the latest in May, sold at 0.55 per cent higher than #23-08 (the earliest purchase) despite being nine floors lower.
But half a percentage point rarely draws more than a shrug.
What Clement Canopy taught us about launch timing
Clement Canopy is a very clear argument in favour of buying early, as in most cases, the earliest purchases were better value. They were priced lower, had more room for price appreciation, and substantial gains were evident for the early birds.
That said, we also saw that it’s not just about “value buy” units, as some units that were bought higher still managed to see better returns. This underscores the importance of holding power and the timing of the exit in determining eventual gains.
There are two other interesting lessons to note here:
First, it throws into question the expectation of lower-floor units being poorer performers. We can see that in some cases, lower-floor units transacted at a significantly higher price psf, compared to higher-floor units that were bought earlier.
For these lower floor units, the point of exit was a bigger factor than their floor level; or even their time of purchase. They did well because they were sold during the buoyant post-COVID recovery.
Second, given the slower selling pace of large 4-bedder units (and the buyer demographic), we may see a smaller difference in performance here, whether you bought earlier or later.
Follow us on Stacked as we take further deep dives into the Singapore property market, and look at more case studies of various condos. If you’d like to get in touch for a more in-depth consultation, you can do so here.
Ryan J
A seasoned content strategist with over 17 years in the real estate and financial journalism sectors, Ryan has built a reputation for transforming complex industry jargon into accessible knowledge. With a track record of writing and editing for leading financial platforms and publications, Ryan's expertise has been recognised across various media outlets. His role as a former content editor for 99.co and a co-host for CNA 938's Open House programme underscores his commitment to providing valuable insights into the property market.Read next from Property Investment Insights

Property Investment Insights Watertown Condo’s 10-Year Case Study: When Holding Period And Exit Timing Mattered More Than Buying Early

Property Investment Insights Same Condo, Same Layout — But A $1M Profit Gap: A Data-Driven Study On Martin Modern

Property Investment Insights How Purchase Timing Affects Returns In Mega Developments: A Case Study Of Treasure At Tampines

Property Investment Insights Is Buying Early At A New Launch Condo Always Better? Here’s What The Data Shows
Latest Posts

Property Picks Where To Find The Cheapest 2 Bedroom Resale Units In Central Singapore (From $1.2m)

Property Picks 19 Cheaper New Launch Condos Priced At $1.5m Or Less. Here’s Where To Look

Property Advice The Ultimate Work From Home Homebuyer Checklist (That Most People Still Overlook)

Landed Home Tours These $4m Freehold Landed Homes In Joo Chiat Have A 1.4 Plot Ratio: What Buyers Should Know

Singapore Property News Now That GE2025 Is Over, Let’s Talk About The Housing Proposals That Didn’t Get Enough Scrutiny

Property Advice When ‘Bad’ Property Traits Can Be A Bargain For Homebuyers In Singapore

Property Picks Here’s Where You Can Find The Biggest Two-Bedder Condos Under $1.8 Million In 2025

Property Market Commentary Why Do Property Agents Always Recommend New Launch Condos? Is It Really About The Money?

On The Market 5 Affordable Condos With Unblocked Views Priced Under $1 Million

Singapore Property News GE2025: Who’s Got the Better Housing Plan? We Break Down PAP, WP, RDU, PSP And SDP Proposals

Editor's Pick Why No Property Developers Bid For Media Circle Parcel B (And What It Means For One-North)

Homeowner Stories Buying A Walk-Up Apartment In Singapore? Don’t Overlook The Shops Below – Here’s Why

Property Market Commentary Is It Still Safe To Buy A Home In 2025? Why Singapore Property Buyers Shouldn’t Panic

Editor's Pick This Beautiful Japanese-Inspired 5-Room HDB Home Features an Indoor Gravel Garden

Singapore Property News Can The CCR Convince Singaporeans To pay $3M For ‘Prime’ Again?
