

Recently, a reader wrote in to ask about HDB flat valuations, and it’s a question that’s surprisingly tough to answer:
How is the market value of an HDB resale flat derived? And how is that related to the Cash Over Valuation (COV) and other factors?
Agents’ responses can be tough to decipher; and to be fair, a good number of them respond with the classic “It’s based on recent transactions.” That could be because (1) you have a less experienced agent struggling to answer it, or (2) you have a very experienced agent, whose answer would fill the final year syllabus of a Real Estate course; so they’re trying to sidestep it because the full answer will confuse you even more.
But I can get how it’s frustrating, as the standard answer doesn’t explain why one flat sells for $950,000 while a near-identical one on the same floor matches to breach $1 million. It also doesn’t explain why prices sometimes lurch upward or downward in a given year, or why the bank or HDB’s valuation can be way off the asking price.
So here’s the thing…
There was a time when Cash Over Valuation (COV) was clearer, but that clarity, unfortunately, made flats more expensive
Consider it one of the ironies of the free market. This was all over a decade ago now, sometime around 2015. Prior to this period, you would know HDB’s valuation of a resale flat, and HDB even published information on the COV.
(For those who don’t know, COV refers to the sale price above the actual valuation. So if the HDB valuation on a flat is $700,000, and you paid $730,000, then the COV would be $30,000. COV isn’t covered by the home loan, so it always has to be paid in cash. Ouch.)
On the upside, all of this made transactions much clearer in that era. It was normal for buyers and sellers to know the valuation beforehand, and then just haggle over the COV. But if you’re really sharp, you’ll catch the problem there:
It was normal for buyers and sellers to haggle over the COV.
Due to this system, it was almost impossible for any flat to sell at its actual valuation - it became expected that a buyer would pay above valuation. This became one of the reasons that flat prices were spiralling higher and higher.
So in 2014, HDB stopped publishing COV data altogether. From then till now, you have to agree on the price with the seller first; and only then will HDB reveal the actual valuation. So if you agreed on a price that’s too high, you’ll pay COV. Otherwise, you might pay no COV (which is not likely to happen today).
Now, when coupled with other measures (like the Mortgage Servicing Ratio), this actually sent resale flat prices into a tailspin for a really long time. Resale flat prices only started to stabilise again in 2018, and it was really COVID in 2020 that finally caused them to spike.
So today, COV is normal again, even though COV data is not publicised. And now, the lack of COV information feels like a pure drawback; about as useful as a blindfold in a tennis match. You’re still playing with less information, but also unlikely to benefit from lower price outcomes.
It’s annoying and feels arbitrary, but it came from the best of intentions.
The challenge for many buyers today isn't access to information.
It's interpreting that information in a way that makes sense for their finances, goals, and stage of life.
Over time, that's also why we decided to work with agents who shared the same data-driven and advisory-led approach behind our editorial, consultants who could help readers think through decisions more objectively, rather than simply push transactions.
Today, the team has worked with more than 2,000 clients across over $5B in property transactions.
But COV is just part of the question; the other component is usually “How is the valuation even determined?”
The shorthand answer (it’s based on nearby transactions) is correct; it’s just lacking in nuance. While only HDB knows how it determines its valuation, it is more complex than just looking at the area’s transactions.
Valuers don’t pull numbers from thin air. The main input is comparable transactions:
- Same flat type and size,
- Same block (or nearby blocks if data is thin),
- Same floor range,
- Sold within the past 12 months.
Following this, there are adjustments for issues like lease decay or transformations in the surroundings (e.g., whether a mall or MRT station emerged that wasn’t there before).
If there aren’t enough sales to use as benchmarks (say you own a unique flat type like a jumbo flat, where transaction volumes are usually not high), valuers may widen the search radius; but that’s when it gets a bit more unpredictable - and one more reason why rare and older flat types can be a bit more volatile.
Then there are external spillovers as well - policy shifts, such as imposing 15-month waiting periods for right-sizers younger than 55, curbs on maximum loan amounts, or higher interest rates (which affects those taking bank rather than HDB loans), also factor into price movements. COVID is the most glaring and obvious example, with prices spiking after 2020 mainly because of supply issues - but as I mentioned above, downswings can also happen, such as from 2013 to 2018.
External factors are a bit more indirect; but if they move the needle on average prices in the neighbourhood, your valuation could be affected.
Although interestingly enough, having an outlier - like a sudden million-dollar flat in your vicinity - can matter less than you’d think
Valuations almost always exclude extreme outliers. Most of them would ignore an oddity like a million-dollar transaction where most surrounding flats are at $800,000, just as they would, say, a $600,000 transaction in the same area.
Rather, most will base the valuation on the median. That’s why a neighbour’s freak million-dollar transaction may not mean you can sell for an equal amount; and also why a neighbour’s lower transaction doesn’t always mean ruin for you.
This is often a headache for agents, who then need to explain why clients have to settle for more or less despite the nearby outlier.
At the risk of annoying a lot of industry professionals:
A lot of analysis is like buying a wand and pretending you graduated from Hogwarts, unless you get VERY, VERY specific about the property. Due to the huge range of factors above, it’s almost impossible to answer very large-scale questions - such as “why did 4-room flat prices go up in Hougang?”
But if you can name the 4-room flat in question - and it’s possible to check details like the floor, the maintenance, the distance to the MRT station, and so forth - that’s when the answers become truly tangible.
Wider market movements tend to be more useful to policymakers and developers - and to some extent realtors - than they are to individual HDB owners. And it’s natural to feel frustrated by that disconnect; much like an unemployed person would feel about news that “the job market improved in Q2 2025.”
So don’t get hung up on million-dollar headlines or neighbourhood averages. Until you drill down to your block, your floor, your lease balance, everything else is just background noise.
Meanwhile, in other property news:
- Are heartland condos still the cheap, accessible place to get private properties in Singapore? The answer is not clear-cut anymore, and here’s why.
- A dual-key layout has its pros and cons, but here’s a homeowner with some unexpected insights into making your unit a dual-key.
- Families buying two-bedders? It’s not as unusual as it used to be in today’s market; and here’s why.
- Join our Stacked Pro readers, as we look up new launch and resale price gaps for two-bedders in District 15 - all to see if it’s worth going new in today’s market.
Weekly Sales Roundup (01 - 07 September)
Top 5 Most Expensive New Sales (By Project)
| PROJECT NAME | PRICE S$ | AREA (SQFT) | $PSF | TENURE |
| 21 ANDERSON | $24,000,000 | 4489 | $5,347 | FH |
| CANNINGHILL PIERS | $7,604,000 | 2788 | $2,728 | 99 yrs (2021) |
| TERRA HILL | $5,290,000 | 1894 | $2,792 | FH |
| PINETREE HILL | $4,651,000 | 1733 | $2,684 | 99 yrs (2022) |
| TEMBUSU GRAND | $4,220,000 | 1711 | $2,466 | 99 yrs (2022) |
Top 5 Cheapest New Sales (By Project)
| PROJECT NAME | PRICE S$ | AREA (SQFT) | $PSF | TENURE |
| CANBERRA CRESCENT RESIDENCES | $1,369,100 | 667 | $2,051 | 99 yrs (2024) |
| RIVER GREEN | $1,459,000 | 452 | $3,227 | 99 yrs (2024) |
| OTTO PLACE | $1,545,000 | 872 | $1,772 | 99 yrs (2024) |
| THE MYST | $1,595,000 | 678 | $2,352 | 99 yrs (2023) |
| HILLOCK GREEN | $1,618,000 | 657 | $2,464 | 99 yrs (2022) |
Top 5 Most Expensive Resale
| PROJECT NAME | PRICE S$ | AREA (SQFT) | $PSF | TENURE |
| THE ARCADIA | $10,523,000 | 6566 | $1,603 | 99 yrs (1979) |
| ST THOMAS SUITES | $6,000,000 | 2605 | $2,303 | FH |
| CARIBBEAN AT KEPPEL BAY | $5,700,000 | 4650 | $1,226 | 99 yrs (1999) |
| REGENCY PARK | $5,300,000 | 2260 | $2,345 | FH |
| PARK INFINIA AT WEE NAM | $4,880,000 | 2002 | $2,437 | FH |
Top 5 Cheapest Resale
| PROJECT NAME | PRICE S$ | AREA (SQFT) | $PSF | TENURE |
| EDENZ SUITES | $648,000 | 474 | $1,368 | FH |
| RIVERSOUND RESIDENCE | $665,000 | 474 | $1,404 | 99 yrs (2011) |
| AIRSTREAM | $720,000 | 474 | $1,520 | FH |
| JOOL SUITES | $724,000 | 398 | $1,818 | FH |
| HILLSTA | $738,000 | 538 | $1,371 | 99 yrs (2011) |
Top 5 Biggest Winners
| PROJECT NAME | PRICE S$ | AREA (SQFT) | $PSF | RETURNS | HOLDING PERIOD |
| THE ARCADIA | $10,523,000 | 6566 | $1,603 | $7,323,000 | 20 Years |
| SOMMERVILLE PARK | $3,160,000 | 1302 | $2,426 | $2,390,000 | 23 Years |
| PARK INFINIA AT WEE NAM | $4,880,000 | 2002 | $2,437 | $2,277,400 | 18 Years |
| DAKOTA RESIDENCES | $3,950,000 | 1830 | $2,159 | $2,007,840 | 15 Years |
| COSTA DEL SOL | $2,880,000 | 1561 | $1,845 | $1,919,520 | 18 Years |
Top 5 Biggest Losers
| PROJECT NAME | PRICE S$ | AREA (SQFT) | $PSF | RETURNS | HOLDING PERIOD |
| MARINA ONE RESIDENCES | $4,260,000 | 2250 | $1,894 | -$1,154,500 | 7 Years |
| OUE TWIN PEAKS | $2,408,888 | 1055 | $2,284 | -$566,112 | 12 Years |
| ELIZABETH HEIGHTS | $4,480,000 | 2530 | $1,771 | -$270,000 | 14 Years |
| 26 NEWTON | $1,380,000 | 614 | $2,249 | -$88,400 | 13 Years |
| CANNINGHILL PIERS | $1,230,000 | 409 | $3,007 | -$75,000 | 4 Years |
Top 5 Biggest Winners (ROI%)
| PROJECT NAME | PRICE S$ | AREA (SQFT) | $PSF | ROI (%) | HOLDING PERIOD |
| SOMMERVILLE PARK | $3,160,000 | 1302 | $2,426 | 310.4% | 23 Years |
| THE ARCADIA | $10,523,000 | 6566 | $1,603 | 228.8% | 20 Years |
| COSTA DEL SOL | $2,880,000 | 1561 | $1,845 | 199.9% | 18 Years |
| PARK GREEN | $1,585,000 | 1346 | $1,178 | 138.3% | 16 Years |
| SOUTHAVEN II | $1,618,000 | 958 | $1,689 | 137.9% | 16 Years |
Top 5 Biggest Losers (ROI%)
| PROJECT NAME | PRICE S$ | AREA (SQFT) | $PSF | ROI (%) | HOLDING PERIOD |
| MARINA ONE RESIDENCES | $4,260,000 | 2250 | $1,894 | -21.3% | 7 Years |
| OUE TWIN PEAKS | $2,408,888 | 1055 | $2,284 | -19.0% | 12 Years |
| 26 NEWTON | $1,380,000 | 614 | $2,249 | -6.0% | 13 Years |
| CANNINGHILL PIERS | $1,230,000 | 409 | $3,007 | -5.7% | 4 Years |
| ELIZABETH HEIGHTS | $4,480,000 | 2530 | $1,771 | -5.7% | 14 Years |
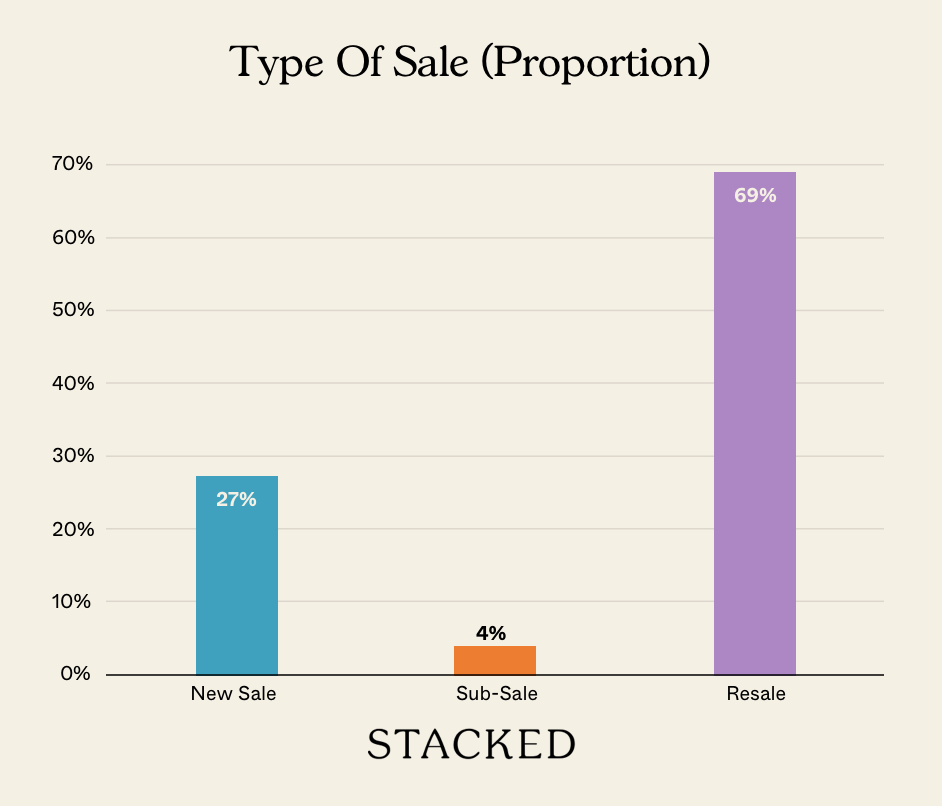
Transaction Breakdown
Follow us on Stacked for news on Singapore’s ever-changing property market.
At Stacked, we like to look beyond the headlines and surface-level numbers, and focus on how things play out in the real world.
If you'd like to discuss how this applies to your own circumstances, you can reach out for a one-to-one consultation here.
And if you simply have a question or want to share a thought, feel free to write to us at stories@stackedhomes.com. We read every message.





0 Comments