Analysing Forest Woods Condo at Serangoon: Did This 2016 Project Hold Up Over Time?

Get The Property Insights Serious Buyers Read First: Join 50,000+ readers who rely on our weekly breakdowns of Singapore’s property market.

A seasoned content strategist with over 17 years in the real estate and financial journalism sectors, Ryan has built a reputation for transforming complex industry jargon into accessible knowledge. With a track record of writing and editing for leading financial platforms and publications, Ryan's expertise has been recognised across various media outlets. His role as a former content editor for 99.co and a co-host for CNA 938's Open House programme underscores his commitment to providing valuable insights into the property market.
In this Stacked Pro breakdown:
Comparison
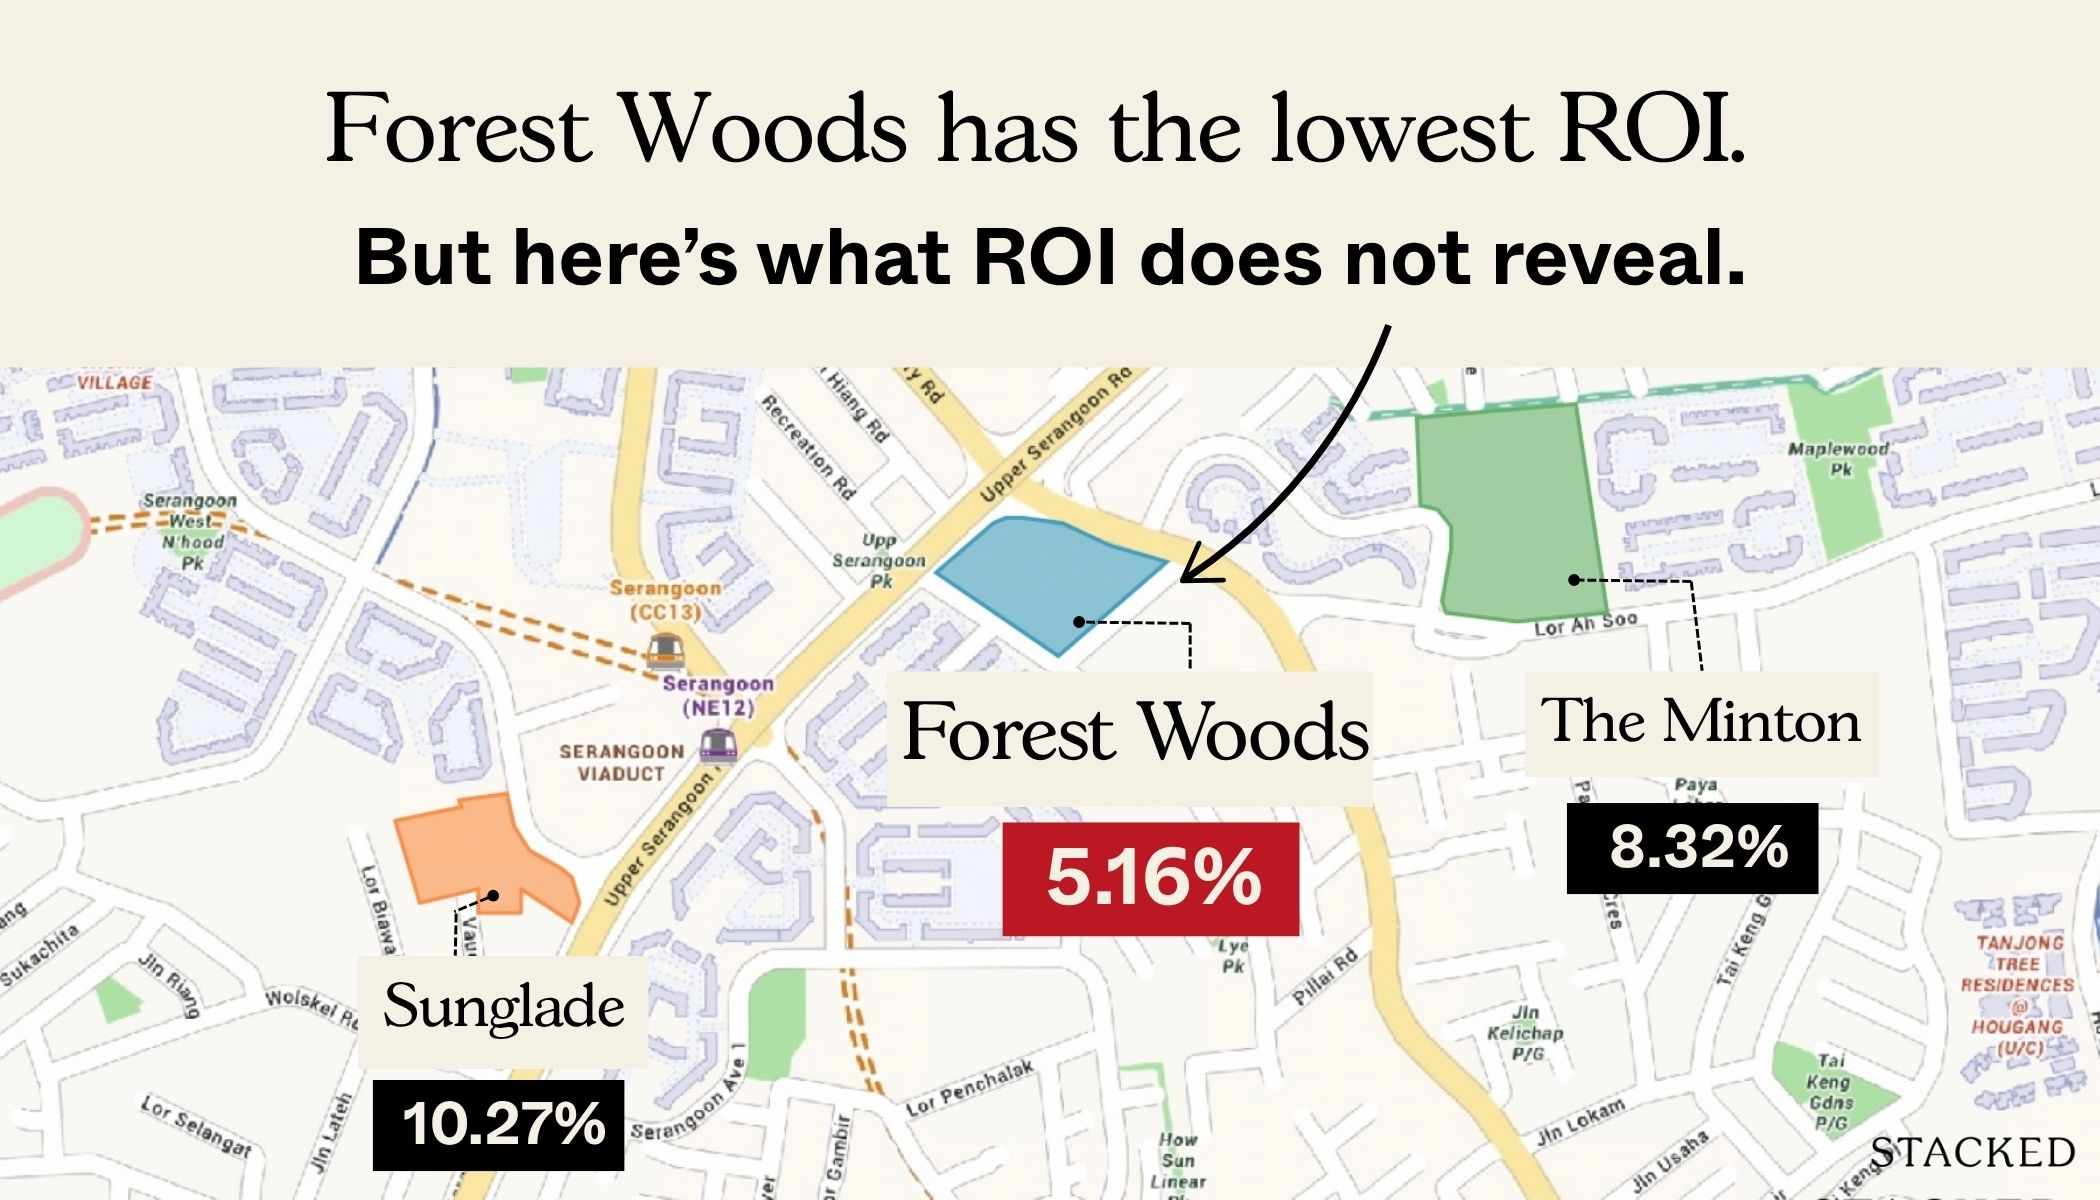
We tracked how Forest Woods has performed from its launch in 2016 to 2024, and compared it to the overall District 19 market, resale counterparts, and similarly launched projects across Singapore. We also broke down unit types to assess where its value truly lies.
Key Insight
Forest Woods may look like an underperformer at first glance, especially when compared to District 19’s fast-rising resale segment. But a closer look reveals a nuanced picture: while ROI lags, layout efficiency, high rental appeal, and strong performance relative to its 2016 launch cohort suggest there’s more beneath the surface.
Why This Matters
Not all growth is created equal. While Forest Woods trails in raw percentage gains, its shown price resilience and solid demand in a competitive neighbourhood. This case highlights why evaluating projects by ROI alone can obscure key advantages.
🔓 Unlock the full analysis — only on Stacked Pro.
Already a subscriber? Log in here.
Why ROI Alone Doesn’t Tell the Full Story: Forest Woods
At first glance, Forest Woods doesn’t stand out. Since its launch in 2016, Forest Woods has delivered consistent price growth, rising from $1,408 psf to $1,985 psf by 2024. That’s an annualised gain of around 4.39 per cent, which is average – nothing to shout about. It’s also lower than the average of District 19 where it’s located.
But look beyond oversimplified ROI numbers, and you’ll find something interesting. Despite lagging on a pure ROI basis, Forest Woods may actually be one of the stronger performers among its launch-year peers; and it shines even more when you consider layout efficiency, pricing psychology, and its newer resale entrants. So let’s take a deeper look at Forest Woods:
A quick summary of Forest Woods
Forest Woods is a 519-unit, 99-year leasehold condo located at Lorong Lew Lian, just a five-minute walk from Serangoon MRT station (NEL, CCL) and NEX mega mall. It was launched in 2016 and completed in 2020.
Unlike older neighbouring condos like Sunglade or The Minton, Forest Woods was built for compact efficiency; this was made clear from the very start as the marketing angle. Units tend to be smaller but compensate with flexible layouts, with a good number of two-bedders coming in 2+Study configurations, and four-bedders featuring dry-wet kitchen setups despite the smaller floor plates.
Now let’s look at the simplified, general ROI of Forest Woods from launch to the present:
Year | Average $PSF |
2016 | $1,408 |
2017 | $1,408 |
2018 | $1,540 |
2019 | $1,559 |
2020 | $1,658 |
2021 | $1,672 |
2022 | $1,795 |
2023 | $1,910 |
2024 | $1,985 |
Annualised | 4.39% |
Forest Woods launched in 2016 at an average price of $1,408 psf. As of 2024, it has reached an average of $1,985 psf. That’s a 4.39 per cent annualised return over eight years.
Now let’s compare this to the overall market, as well as other condominiums in district 19. For a fairer picture, we will only compare Forest Woods to other 99-year leasehold projects (for now we won’t discriminate based on the type of transaction, we’ll just use all transaction types)

Year | Forest Woods | D19 condos | All 99-year leasehold condos |
2016 | $1,408 | $990 | $1,166 |
2017 | $1,408 | $1,035 | $1,230 |
2018 | $1,540 | $1,182 | $1,359 |
2019 | $1,559 | $1,291 | $1,474 |
2020 | $1,658 | $1,276 | $1,453 |
2021 | $1,672 | $1,262 | $1,517 |
2022 | $1,795 | $1,340 | $1,595 |
2023 | $1,910 | $1,460 | $1,783 |
2024 | $1,985 | $1,807 | $1,854 |
Annualised | 4.39% | 7.81% | 5.97% |
Forest Woods has appreciated at a slower pace than both district 19’s average, and the national average for 99-year leasehold condos.
We can see this isn’t a fluke as over an eight-year window, Forest Woods consistently trailed behind. While Forest Woods gained about $577 psf since launch, the average district 19 leasehold condo gained about $817 psf, despite starting at a much lower base. It’s a good example of how high entry prices can limit your upside, even when the project itself is well-located and popular.
Still, there’s something to be said for Forest Woods’ consistency. From the table, we can see this is a development that has consistently grown in value every year since launch. While this was somewhat helped by the post-Covid surge (2020 and beyond), it does show that owners can expect consistent performance.
While the all-transactions view gives us a general idea of growth, it’s important to isolate resale data.
This is to exclude the distortions caused by developer pricing, such as early-bird discounts. Forest Woods’ first resale transactions only began in 2022, so we’ll use that as the starting point for this analysis.
Year | Forest Woods | D19 condos | All 99-year leasehold condos |
2022 | $1,795 | $1,256 | $1,337 |
2023 | $1,910 | $1,376 | $1,465 |
2024 | $1,985 | $1,477 | $1,574 |
Annualised | 5.16% | 8.44% | 8.53% |
The result is still not in Forest Wood’s favour. Resale units in D19 overall grew at 8.44 per cent per annum, and the national average for 99-year leasehold condos came in at 8.53 per cent; a clear indication that the market has been moving faster than Forest Woods.
So what’s holding Forest Woods back? So far, we have two opinions provided by realtors on the ground. The first is the high base price: Forest Woods was simply one of the pricier developments from the start, leaving less room for capital gains. The second is competition within district 19 – we were told that a surge in new launches like The Florence Residences and Affinity at Serangoon put pressure on resale values, by offering newer alternatives.
But we still think there’s something deeper going on. Forest Wood’s 5.16 per cent annualised return is still decent, especially for a project with zero unprofitable transactions to date. Even though Forest Woods is not leading, its transaction patterns are not characteristic of a project with deep problems.
Our next question then, is how does Forest Woods compare to immediate neighbours?
To see if Forest Woods is truly underperforming, or simply a victim of high expectations, we compared it to several nearby condos with at least 150 units. These include:
- Sunglade (99-year leasehold, completed 2003)
- The Minton (99-year leasehold, completed 2013)
Jade Residences (Freehold, completed 2017) - Cherryhill (Freehold, completed 1994)
We’ve excluded Cherryhill’s earlier years due to incomplete launch data, but included it for resale comparisons given its recent activity.
Here’s the annualised resale growth from 2022 to 2024:
Project | Cherryhill | Sunglade | The Minton | Jade Residences | Forest Woods |
Tenure | Freehold | 99-year | 99-year | Freehold | 99-year |
Launch year | 2001 | 2010 | 2013 | 2016 | |
Completion year | 1994 | 2003 | 2013 | 2017 | 2020 |
No. of units | 163 | 475 | 1145 | 171 | 519 |
Year | Sunglade | The Minton | Jade Residences | Forest Woods |
2001 | $523 | |||
2002 | $528 | |||
2003 | $531 | |||
2004 | $503 | |||
2005 | $490 | |||
2006 | $471 | |||
2007 | $595 | |||
2008 | $676 | |||
2009 | $685 | |||
2010 | $866 | $840 | ||
2011 | $993 | $892 | ||
2012 | $1,057 | $902 | ||
2013 | $1,141 | $1,137 | $1,546 | |
2014 | $1,099 | $1,148 | $1,305 | |
2015 | $1,077 | $1,144 | $1,136 | |
2016 | $1,045 | $998 | $1,167 | $1,408 |
2017 | $1,054 | $995 | $1,316 | $1,408 |
2018 | $1,148 | $1,052 | $1,279 | $1,540 |
2019 | $1,171 | $1,056 | $1,706 | $1,559 |
2020 | $1,126 | $1,050 | $1,518 | $1,658 |
2021 | $1,177 | $1,112 | $1,425 | $1,672 |
2022 | $1,278 | $1,270 | $1,552 | $1,795 |
2023 | $1,418 | $1,416 | $1,612 | $1,910 |
2024 | $1,554 | $1,490 | $1,631 | $1,985 |
Annualised | 4.85% | 4.18% | 0.49% | 4.39% |
With the exception of Jade Residences, the annualised growth rates of the other three projects since their launch is relatively comparable. But let’s see what happens when we focus on resale transactions only:
Year | Cherryhill | Sunglade | The Minton | Jade Residences | Forest Woods |
2022 | $1,286 | $1,278 | $1,270 | $1,552 | $1,795 |
2023 | $1,399 | $1,418 | $1,416 | $1,612 | $1,910 |
2024 | $1,696 | $1,554 | $1,490 | $1,631 | $1,985 |
Annualised | 14.84% | 10.27% | 8.32% | 2.51% | 5.16% |
When compared to its immediate neighbours, Forest Woods is not at the bottom, but it’s still not great. Despite being the newest condo in this group, it still sits in the lower half. Sunglade, a similarly scaled 99-year leasehold project just across the road from Forest Woods, also outpaced it by a wide margin, while Cherryhill staged a surprising comeback in recent years.
(Odd since Cherryhill is the smallest and oldest development, but maybe its low price point coupled with its freehold status made it seem like a value buy.)
At this point, we began to consider if – besides just its higher entry price – Forest Woods’ smaller floor plates had something to do with this. After all, it was clear from the get-go that units here would be smaller in terms of raw square footage. Maybe its higher $PSF, smaller unit sizes, and more compact layouts make it harder to stand out in a market that values space.
More from Stacked
Is Chuan Park Residences The Next Hot Mega Development? Here’s What You Should Know
When the former Chuan Park was sold in an en-bloc, there was immediate attention: this was a sizeable land plot…
So let’s break down the units by bedrooms to gauge their performance; this will also clue us in on how the market is reacting to the unit sizes
When we break it down into one, two, three, and four-bedder configurations, a more nuanced picture emerges; especially when benchmarked against the same unit types in nearby condos.
Let’s look at the annualised resale price growth from 2022 to 2024 for each unit type:
1-bedroom units
Year | The Minton | Forest Woods |
2022 | $1,273 | $1,782 |
2023 | $1,378 | $1,814 |
2024 | $1,424 | $1,789 |
Annualised | 5.75% | 0.19% |
2-bedroom units
Year | Cherryhill | Sunglade | The Minton | Jade Residences | Forest Woods |
2022 | $1,286 | $1,227 | $1,261 | $1,550 | $1,780 |
2023 | $1,426 | $1,480 | $1,395 | $1,506 | $1,924 |
2024 | $1,586 | $1,440 | $1,465 | $1,963 | |
Annualised | – | 13.67% | 6.85% | -2.79% | 5.01% |
3-bedroom units
Year | Cherryhill | Sunglade | The Minton | Jade Residences | Forest Woods |
2022 | $1,289 | $1,280 | $1,601 | $1,795 | |
2023 | $1,346 | $1,415 | $1,472 | $1,753 | $1,916 |
2024 | $1,696 | $1,554 | $1,579 | $1,798 | $1,998 |
Annualised | – | 9.79% | 11.07% | 5.95% | 5.51% |
4-bedroom units
Year | Sunglade | The Minton | Jade Residences | Forest Woods |
2022 | $1,347 | $1,459 | $1,955 | |
2023 | $1,348 | $1,426 | $1,655 | $1,950 |
2024 | $1,368 | $1,600 | $2,135 | |
Annualised | – | 9.02% | – | 4.50% |
For one-bedders:

Forest Woods’ one-bedders are struggling in resale. The one-bedders have lagged in resale appreciation, likely due to high launch $PSF and compact sizes that offer less perceived value today. That’s not surprising, considering these units are compact (around 514 sq ft on average) and launched at a high base. The Minton’s larger one-bed units (averaging 658 sq ft) offer more square footage at a lower quantum, making them more attractive to budget-conscious singles or tenant-seekers.
For two-bedders:

Nonetheless, Forest Woods performs moderately well here; not the best, but not bad either. Its two-bedders saw around a five per cent annualised growth, trailing Sunglade but still ahead of Jade Residences and in line with The Minton. It helps that these layouts are popular 2+Study formats, which can also appeal to small families.
For three-bedders:

Forest Woods’ three-bedders have shown respectable growth at 5.51 per cent, but we can see they trail larger, older units at The Minton and Sunglade. In more recent years with space at a premium (especially since COVID) it’s not a surprise that buyers may sacrifice newness for more floor area; and Forest Woods’ three-bedders average just 956 sq ft, smaller than the competition.
For four-bedders:

Forest Woods’ four-bedders are the smallest on the list, averaging just 1,243 sq ft, yet they command the highest $PSF. This may have suppressed appreciation, with buyers in recent years prioritising space. By contrast, The Minton’s four-bedders are closer to 1,800 sq ft, offering significantly more room at a lower $PSF.
The verdict by unit type:
- Best-performing at Forest Woods: two and three-bedders, which proved to be popular sizes with steady resale interest.
- Weakest growth: one-bedders (likely perceived as overpriced at launch) and four-bedders (smaller than the neighbouring projects.)
In fact across all unit segments, Forest Woods consistently has smaller unit sizes but higher prices, a tough combo when buyers are comparing floor plans.
Let’s continue with the profitability analysis across the different projects, focusing on resale transactions from 2022 to 2024. This gives us a more grounded view of how sellers actually fared; not just in percentage terms, but in dollars and time held.
Cherryhill
Profitable transactions | ||||
Average gains | Average purchase price | Average ROI | Average holding period (years) | No. of tnx |
$687,981 | $1,093,385 | 62.92% | 10.3 | 6 |
Sunglade
Profitable transactions | ||||
Average gains | Average purchase price | Average ROI | Average holding period (years) | No. of tnx |
$656,976 | $939,718 | 69.91% | 10.2 | 52 |
The Minton
Profitable transactions | ||||
Average gains | Average purchase price | Average ROI | Average holding period (years) | No. of tnx |
$497,923 | $1,058,446 | 47.04% | 9.3 | 174 |
Jade Residences
Profitable transactions | ||||
Average gains | Average purchase price | Average ROI | Average holding period (years) | No. of tnx |
$131,078 | $1,297,152 | 10.11% | 8.7 | 28 |
Forest Woods
Profitable transactions | ||||
Average gains | Average purchase price | Average ROI | Average holding period (years) | No. of tnx |
$399,308 | $1,190,282 | 33.55% | 6.3 | 65 |
In terms of profitability, Forest Woods may not top the charts in ROI, but it’s not risky either: everyone who sold between 2022 and 2024 walked away with gains. The strongest returns came from older developments with longer holding periods and larger units; especially Sunglade and Cherryhill.
Forest Woods sellers benefited from stable price growth and buyer appetite, but were also limited by higher entry prices at launch and more compact layouts, especially in the one and four-bedder segments.
Given that Forest Woods is a much newer project compared to those three though, its shorter holding periods must be taken into account. Longer holding periods result in higher returns, a factor that can make Forest Woods ROI seem weaker than its older neighbours; even if Forest Woods’ capital gains are more consistent.
Let’s now move into the launch-year comparison: how Forest Woods stacks up against other projects that launched in 2016.
This gives us a useful context: while it may trail its neighbours, is it at least a standout among its peers?

Project | Forest Woods | Gem Residences | Lake Grande | Parc Riviera | Queens Peak | Stars of Kovan | The Alps Residences |
Tenure | 99-year | 99-year | 99-year | 99-year | 99-year | 99-year | 99-year |
District | 19 | 12 | 22 | 5 | 3 | 19 | 18 |
No. of units | 519 | 578 | 710 | 752 | 736 | 390 | 626 |
Completion year | 2020 | 2019 | 2019 | 2019 | 2020 | 2019 | 2019 |
Year | Forest Woods | Gem Residences | Lake Grande | Parc Riviera | Queens Peak | Stars of Kovan | The Alps Residences |
2016 | $1,408 | $1,427 | $1,361 | $1,193 | $1,636 | $1,417 | $1,080 |
2017 | $1,408 | $1,518 | $1,313 | $1,244 | $1,686 | $1,474 | $1,065 |
2018 | $1,540 | $1,574 | $1,376 | $1,249 | $1,789 | $1,543 | $1,157 |
2019 | $1,559 | $1,636 | $1,369 | $1,780 | $1,617 | $1,222 | |
2020 | $1,658 | $1,619 | $1,505 | $1,387 | $1,757 | $1,666 | $1,188 |
2021 | $1,672 | $1,670 | $1,559 | $1,422 | $1,866 | $1,661 | $1,273 |
2022 | $1,795 | $1,745 | $1,627 | $1,486 | $2,004 | $1,721 | $1,344 |
2023 | $1,910 | $1,842 | $1,729 | $1,638 | $2,126 | $1,804 | $1,414 |
2024 | $1,985 | $1,929 | $1,818 | $1,654 | $2,198 | $1,889 | $1,488 |
Annualised | 4.39% | 3.84% | 3.69% | 4.17% | 3.76% | 3.66% | 4.09% |
Now we’ve found an interesting secret: Forest Woods posts the highest annualised growth at 4.39 per cent, narrowly edging out Parc Riviera and The Alps Residences!
That’s particularly noteworthy when you consider that Forest Woods launched at a relatively high price compared to its peers, yet still outperformed.
So while it may not have outpaced older, low-base resale giants like Sunglade or Cherryhill, Forest Woods was arguably the top pick of its launch batch.
Now let’s look at differences in specific floor plans and layouts
One of the recurring themes in Forest Woods’ performance is its higher price per square foot, paired with smaller unit sizes. To understand how this affects buyer perception and value retention, we will compare Forest Woods’ layouts with those of nearby developments, which offer similar unit types.
For one-bedders:


Both units are technically one-bedroom plus study layouts, but the execution differs noticeably.
Forest Woods’ unit is more compact, with a narrow galley kitchen and a clearly demarcated bedroom and study area. The Minton’s layout offers more generous space and includes a kitchen island that doubles as a dining area.
Both have balcony spaces, which is inefficient; and interestingly The Minton adds another disliked feature – a planter box that can be covered to extend the usable outdoor space. We don’t think it helps much though, as in a one-bedder you just want the most amount of indoor living space.
Ultimately, while Forest Woods’ unit is more efficient, it’s also priced significantly higher on a per square foot basis, with less flexibility for space-hungry buyers or tenants.
For two-bedders:


Forest Woods’ two-bedroom unit is a two-bedroom plus study / one-bathroom configuration, while Sunglade’s is a true two-bedroom / two-bathroom layout.
Forest Woods offers an open-concept kitchen and a compact layout that maximises usable living space, whereas Sunglade includes an enclosed kitchen, yard, and home shelter. The clear edge goes to Sunglade, which is more appealing to families or owner-occupiers.
Forest Woods also has a balcony, whereas Sunglade’s smallest two-bedders do not. This is probably seen as a drawback by some, as adding a balcony to an already small unit just chews up more space.
Despite being smaller, Forest Woods also commands a higher overall quantum; that’s thanks to newer finishes and a modern floor plan. But for buyers prioritising function and storage, Sunglade offers more home-like features at a lower entry price.
For three-bedders


The difference in size is even more apparent here, with Forest Woods offering one of the most compact three-bedroom layouts in the area. The Forest Woods unit includes two balconies, one in the living room and another in the master bedroom.
Sunglade’s layout skips balconies in its smaller three-bedroom units, focusing instead on utility areas like a yard, home shelter, and separate WC. We’ll give the edge to Sunglade here.
However, Forest Woods’ layout is more open and modern, while Sunglade’s is segmented with a foyer entrance for added privacy. This will please traditionalists more, but we lean toward Forest Woods here, as the foyer entrance isn’t a strict necessity for everyone. If only they hadn’t decided on two small balconies though!
For four-bedders


Forest Woods’ four-bedroom units are single-level layouts, while Sunglade’s are duplex penthouse-style homes with roof gardens. The latter already gives Forest Woods an advantage, as fewer homeowners these days are happy to pay for exposed roof areas.
Forest Woods does include dry and wet kitchens, a utility room, service yard, and WC, but this all seems packed into a relatively tight footprint.
Sunglade adds a home shelter, terrace, rooftop garden, and a Jack-and-Jill common bathroom: minus the rooftop garden, it does seem to have more usable space.
Again though, despite being significantly smaller, Forest Woods’ four-bedroom units are priced higher in quantum than those at Sunglade. This is turning out to be Forest Woods’ main struggle: smaller spaces at a higher price psf.
Overall conclusion:
At first glance, Forest Woods appears to underwhelm. Its annualised price growth of 4.39 per cent lags behind its district and 99-year leasehold averages. But zoom in a little, and the numbers begin to shift.
But Forest Woods also has some fundamentals working quietly in its favour. It sits just a five-minute walk from Serangoon MRT interchange and the NEX mega mall, placing it at the heart of one of Singapore’s best-connected suburban hubs.
Compared to other 2016 launches, Forest Woods stands out as the top performer in terms of annualised growth, beating out peers like Gem Residences, Parc Riviera, and Stars of Kovan – all while launching at a higher initial price. This fact is easily lost when you consider most owners have only held for five to seven years, unlike the decade-long holding periods seen at resale outperformers like Sunglade or Cherryhill.
When you adjust for these factors – high base price, shorter holding periods, and a resale market that still values space over efficiency – it becomes clear that Forest Woods is not fundamentally flawed in any way; it’s mostly just suffering from the perception that it’s too small for the cost, and in contrast with neighbours that have had more time to lock in gains.
For more in-depth case studies like this, including full data breakdowns, floor plan comparisons, and unfiltered insights, subscribe to Stacked Pro.
Ryan J
A seasoned content strategist with over 17 years in the real estate and financial journalism sectors, Ryan has built a reputation for transforming complex industry jargon into accessible knowledge. With a track record of writing and editing for leading financial platforms and publications, Ryan's expertise has been recognised across various media outlets. His role as a former content editor for 99.co and a co-host for CNA 938's Open House programme underscores his commitment to providing valuable insights into the property market.Read next from Property Investment Insights

Property Investment Insights Why Rivergate Outperformed Its District 9 Rivals—Despite Being Nearly 20 Years Old

Property Investment Insights Why Kingsford Hillview Peak Underperformed—Despite Its MRT Location And “Good” Entry Price

Property Investment Insights Singapore Property Data Is Transparent: But Here’s Why It Can Still Mislead You

Property Investment Insights Why Marina Bay Suites May Look Like a Poor Performer—But Its 4-Bedroom Units Tell a Different Story
Latest Posts

Property Advice We Ranked The Most Important Things To Consider Before Buying A Property In Singapore: This One Came Top

On The Market This Upcoming 710-Unit Executive Condo In Pasir Ris Will Be One To Watch For Families

Landed Home Tours Where To Find Freehold Terrace & Semi-D Landed Homes From $4.85 million In The East

Singapore Property News She Lost $590,000 On A Shop Space That Didn’t Exist: The Problem With Floor Plans In Singapore

Property Market Commentary Which Central Singapore Condos Still Offer Long-Term Value? Here Are My Picks

On The Market 5 Cheapest Newly MOP 5 Room HDB Flats From $700k

On The Market Springleaf Vs Faber Walk: Which Future GLS Residential Site Has More Potential?

Property Market Commentary I Reviewed HDB’s 2 And 3-Room Show Flats: Ideal For First-Time Buyers Or Too Small To Live In?

Editor's Pick Buying Property In Malaysia As A Singaporean: 6 Key Restrictions To Be Aware Of

Editor's Pick Why Punggol Northshore Could Be The Next Hotspot In The HDB Resale Market

Singapore Property News 9,800 New Homes Across 11 GLS Sites In 2H 2025: What To Know About Tanjong Rhu, Dover, And Bedok

Singapore Property News Why HDB Needs To Build More 4 Bedroom Flats

Homeowner Stories “If We Sell, We’ll Never Have A Home This Big Again”: What Singaporean Parents Do After The Kids Move Out

Property Advice How Much Is Your Home Really Worth? How Property Valuations Work in Singapore

On The Market 5 Cheapest Convenient 1-Bedders Near Integrated Developments From $800k
