We Own 2 Condos & Live In An HDB: Should We Sell It All To Invest In REITs, Or Buy A Landed?
September 15, 2023
Hi Stacked Homes team
Have been reading and following the properties advice given by your team and I find it very insightful and is always learning new and objective perspectives dished out by your professional and expertise opinion.
Appreciate to hear your professional advice on our next property decision. I am 50 and my wife is 40. Combined monthly income is $20k (13k + 7k). Additional rental income from the 2 condos is $8.9k ( 5.3k+3.6k).
We currently owned 2 condos, 3 bedder at The poiz under my name and 1 bedder at queen peak under my wife. We r staying in parent owned hdb flat that is fully paid.
Was thinking to sell both properties and upgrade to a landed property for further investment (better capital appreciation) or put all sales proceed into REIT investment.
Financial information as follows:
- Poiz 3 bedder, outstanding loan $1.05m, accrued CPF $671k.
- Queen peak 1 bedder, outstanding loan $350k, accrued CPF $170k
- Currently, My Cpf OA $60k, my wife CPF OA $52k.
- We have combined liquid asset (equity, savings and bond) of $812k.
Appreciate your advice on following options taking into consideration retirement plan in 10 years time.
- Sell both condos to upgrade to 1 landed property ( possibly within budget of 4m)
- Sell both condos and invest the proceed into REIT to fund retirement needs
- Stay put with current 2 condos and continue collecting rental incomes
- Open to possible options from your professional perspective.
Thanks and have a good day
Hi there,
We appreciate you reaching out to us and we’re glad our content has been beneficial for you!
You certainly are in a unique situation, owning two condos while residing in a family-owned HDB flat. This presents a multitude of possibilities, each with its pros and cons. The crux of your decision hinges on a few key factors: the tangible returns on investment, the potential for capital appreciation, liquidity needs, risk appetite, and, of course, the desired lifestyle and legacy you wish to build for your family.
To begin, we will first assess your financial capacity before delving into the various options you are contemplating.
Affordability
Let’s take a look at your affordability to see what are the possibilities for you.
Sales proceeds from selling The Poiz Residences
These are the 3-bedder transactions that were done this year:
| Date | Size (sqft) | PSF | Price | Level |
| Jun 2023 | 1,206 | $1,825 | $2,200,000 | #09 |
| Jun 2023 | 969 | $1,961 | $1,900,000 | #11 |
| Apr 2023 | 840 | $1,930 | $1,620,000 | #09 |
| Jan 2023 | 840 | $1,965 | $1,650,000 | #08 |
As such, we will use the average transacted price of $1,842,500 as the selling price for the calculation.
| Description | Amount |
| Selling price | $1,842,500 |
| Outstanding loan | $1,050,000 |
| CPF to be refunded into OA | $671,000 |
| Cash proceeds | $121,500 |
Sales proceeds from selling Queens Peak
These are the 1-bedder transactions that were done this year:
| Date | Size (sqft) | PSF | Price | Level |
| Jul 2023 | 431 | $2,230 | $960,000 | #22 |
| May 2023 | 484 | $2,168 | $1,050,000 | #26 |
| Apr 2023 | 495 | $2,060 | $1,020,000 | #24 |
| Apr 2023 | 431 | $2,230 | $960,000 | #23 |
| Mar 2023 | 495 | $2,181 | $1,080,000 | #24 |
We will use the average transacted price of $1,014,000 as the selling price for the calculation.
| Description | Amount |
| Selling price | $1,014,000 |
| Outstanding loan | $350,000 |
| CPF to be refunded into OA | $170,000 |
| Cash proceeds | $494,000 |
Combined affordability
| Description | Amount |
| Maximum loan based on ages of 40 and 50 with a combined monthly income of $20K, at 4.6% interest | $1,613,802 (18 year tenure) |
| CPF funds | $953,000 |
| Cash | $1,427,500 |
| Total loan + CPF + cash | $3,994,302 |
| BSD based on $3,994,302 | $179,258 |
| Estimated affordability | $3,815,044 |
Individual affordability
Husband
| Description | Amount |
| Maximum loan based on age of 50 with a monthly income of $13K, at 4.6% interest | $928,434 (15 year tenure) |
| CPF funds | $731,000 |
| Cash (equal split of cash proceeds and liquid assets) | $713,750 |
| Total loan + CPF + cash | $2,373,184 |
| BSD based on $2,373,184 | $88,259 |
| Estimated affordability | $2,284,925 |
Wife
| Description | Amount |
| Maximum loan based on age of 40 with a monthly income of $7K, at 4.6% interest | $685,634 (25 year tenure) |
| CPF funds | $222,000 |
| Cash (equal split of cash proceeds and liquid assets) | |
| Total loan + CPF + cash | |
| BSD based on | |
| Estimated affordability |
Given that you have a considerable amount of cash, it will be easier to adjust your individual affordability if necessary.
Now let’s look at how both your existing properties are doing right now.
Performance of existing properties
Let’s take a closer look, to see if there’s any merit in holding them for the longer term.
The Poiz Residences
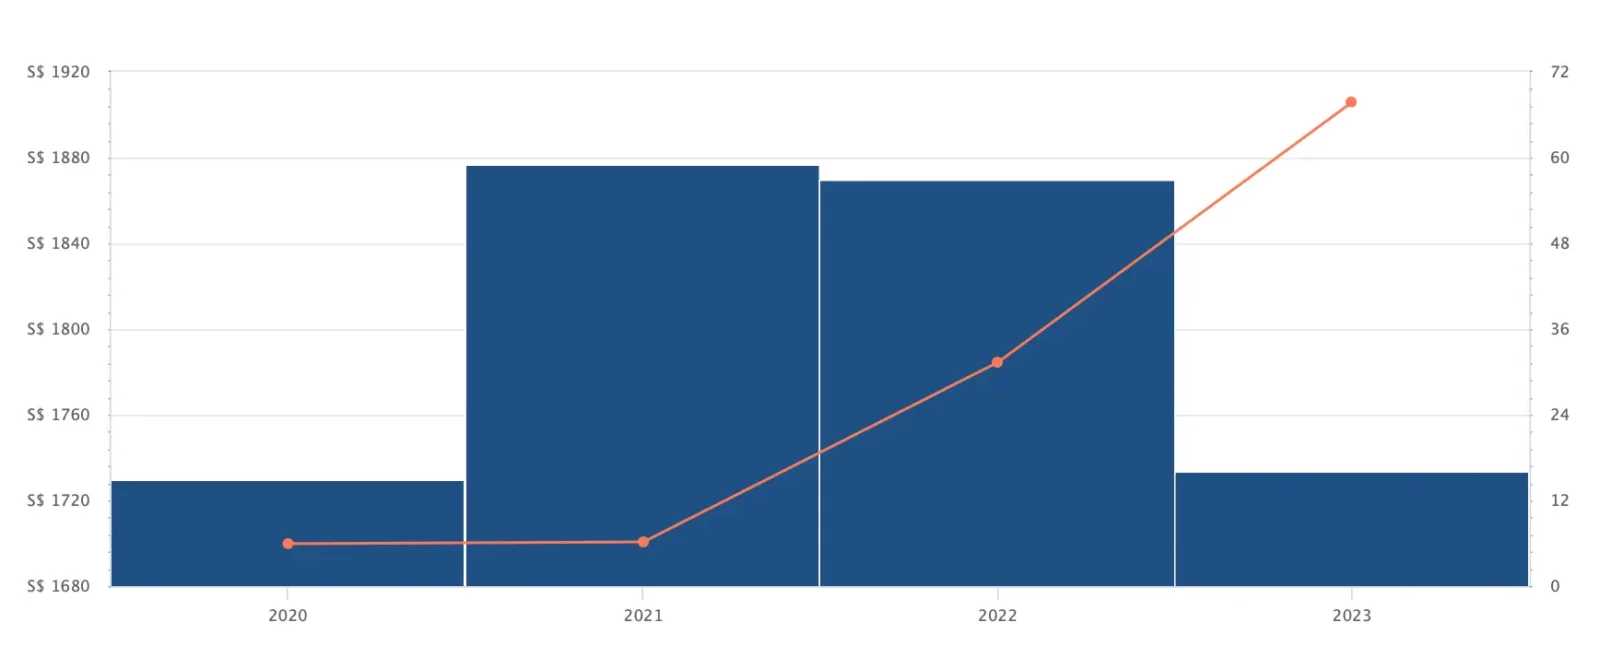
| Year | Avg PSF (resale) | YoY |
| 2020 | $1,700 | – |
| 2021 | $1,701 | 0.06% |
| 2022 | $1,784 | 4.88% |
| 2023 | $1,906 | 6.84% |
| Annualised | – | 3.89% |
Since the project is relatively young, there is limited data available for analysis. However, by examining the above graph and table, it is clear that prices are following an upward trend, aligning with the broader market trends observed during and after the pandemic.
Despite its relatively small size, Potong Pasir has a notable concentration of condominiums in close proximity to The Poiz Residences. Furthermore, these neighbouring condominiums are not too far off in age and could pose as potential competitors.
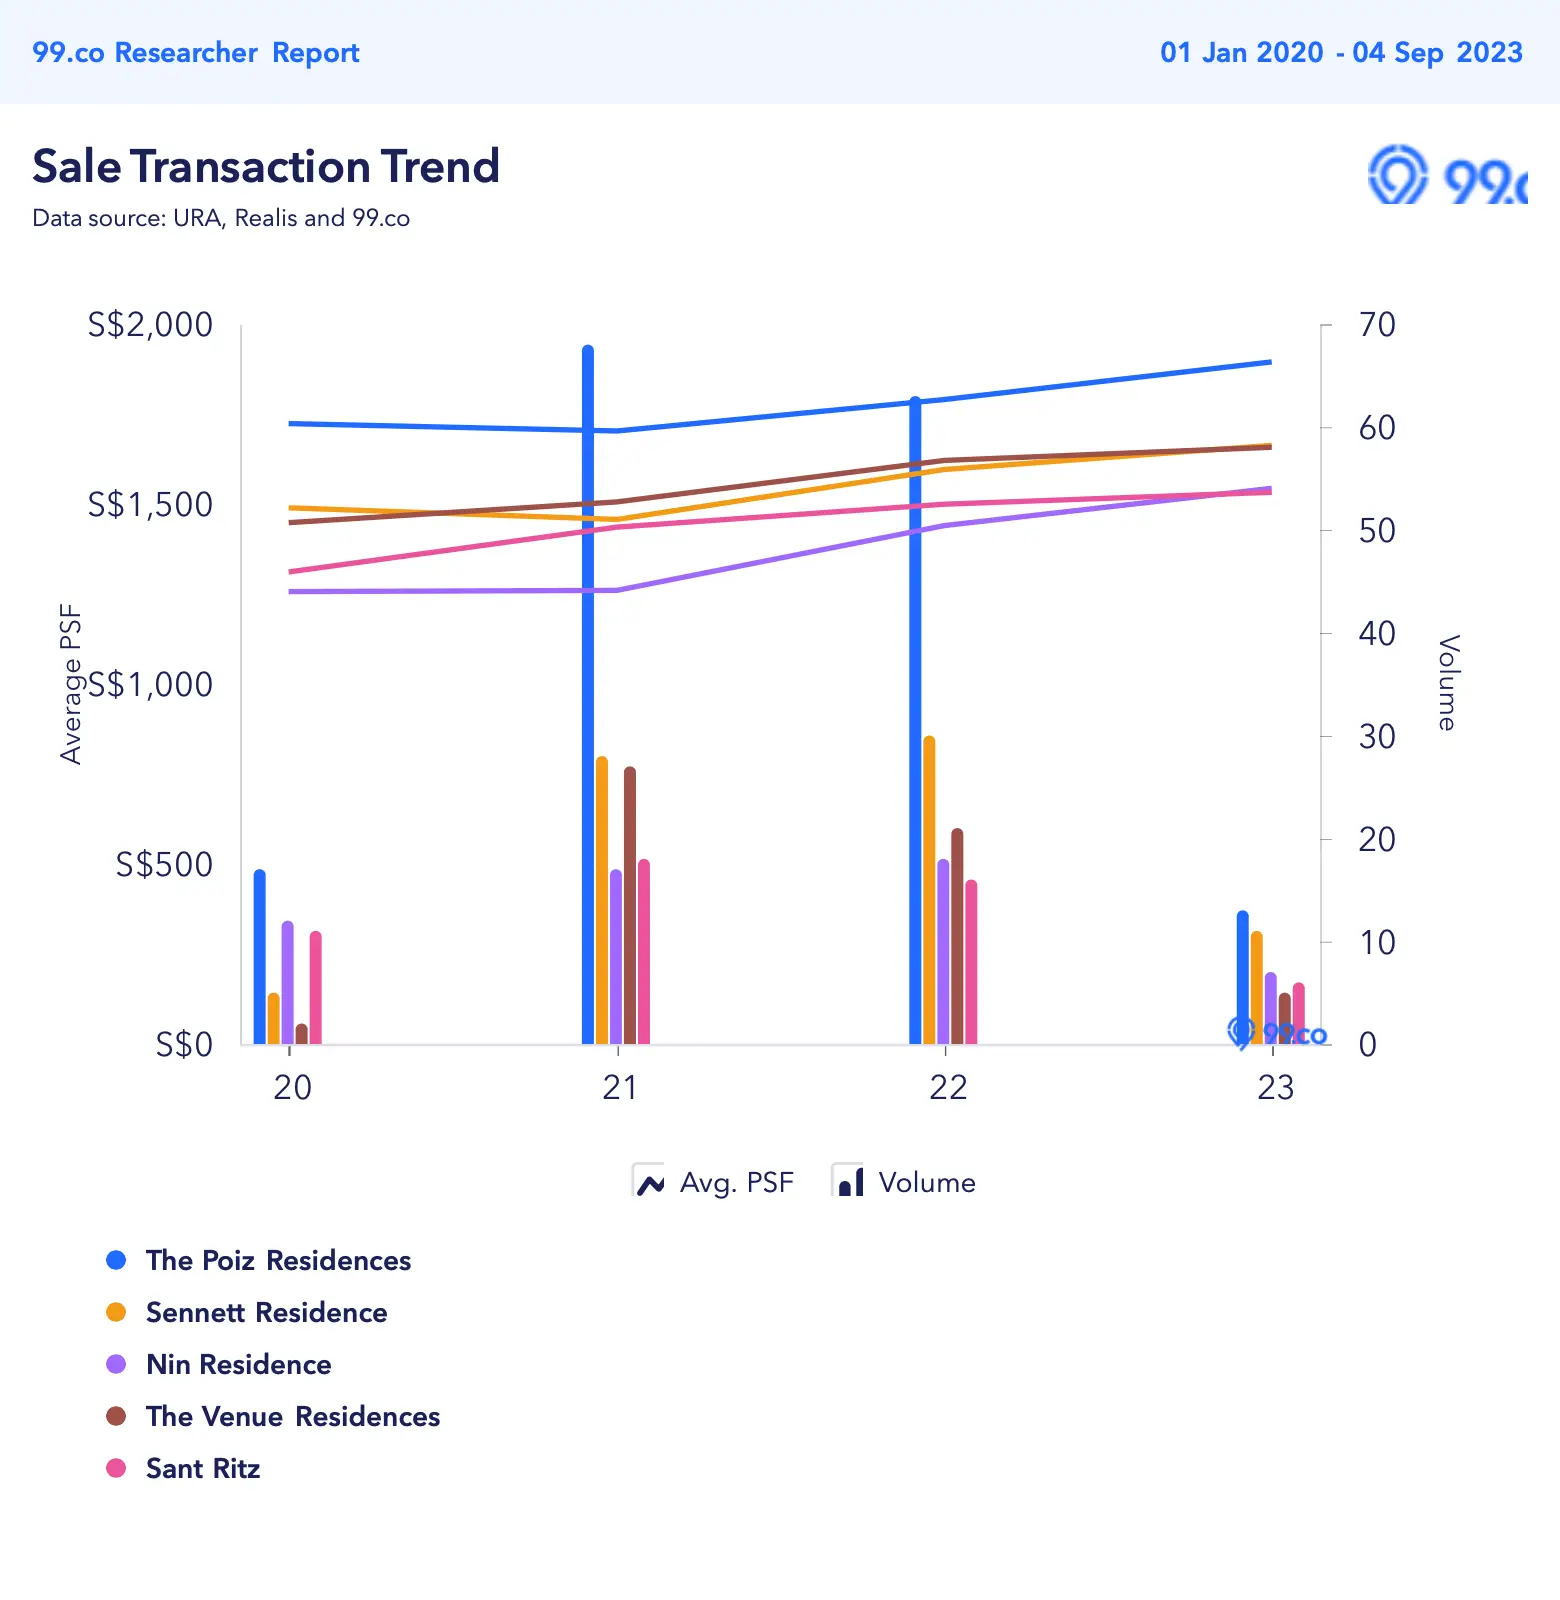
We have excluded many of the neighbouring projects, as they consist mainly of small or boutique developments and are not as comparable. The graph presented shows that The Poiz Residences commands the highest price PSF among the developments in the area. This can be attributed to several key factors: it is the newest and largest project in the estate, it is a mixed development with a decent variety of shops, and it enjoys a prime location right next to the MRT station. These factors set it apart from other condominiums and may account for its demand, even with a higher PSF.
Additionally, considering that there are no available vacant land plots in the immediate vicinity that match The Poiz Residences in terms of size, it is unlikely that new competition of a comparable scale will emerge in the near future.
| Project | Tenure | Completion year | Unit of units | Avg 3-bedder PSF | Avg size of 3-bedder transacted (sqft) | Avg 3-bedder price (Jan 2023 till date) |
| The Poiz Residences | 99 years | 2018 | 731 | $1,920 | 964 | $1,842,500 |
| The Venue Residences | 99 years | 2017 | 266 | $1,665 | 1,130 | $1,881,667 |
| Sant Ritz | 99 years | 2016 | 214 | $1,487 | 1,300 | $1,869,500 |
| Sennett Residence* | 99 years | 2016 | 332 | $1,697 | 1,231 | $2,088,667 |
| Nin Residence* | 99 years | 2014 | 219 | $1,528 | 1,260 | $1,924,000 |
*There were no 3 bedders transacted in these developments in 2023, average PSF and price are for 2022
Examining the average prices for 3-bedroom units, it’s evident that buyers have the option to acquire a larger unit at The Venue Residences or Sant Ritz with a minor top up. Consequently, buyers who do not prioritise residing in a mixed development may opt for these alternatives.
Nevertheless, since these projects are of a smaller scale, the availability of units for sale may not be as consistent as that of The Poiz Residences, as exemplified by the absence of any 3-bedroom units sold at Sennett Residence and Nin Residence in the past 8 months.
Based on this data, it is reasonable to assume that prices at The Poiz Residences will likely remain stable in the short to medium term.
Based on the average 3-bedroom price of $1,842,500, with your current rental of $5,300 per month, the rental yield is at 3.5%.
Queens Peak
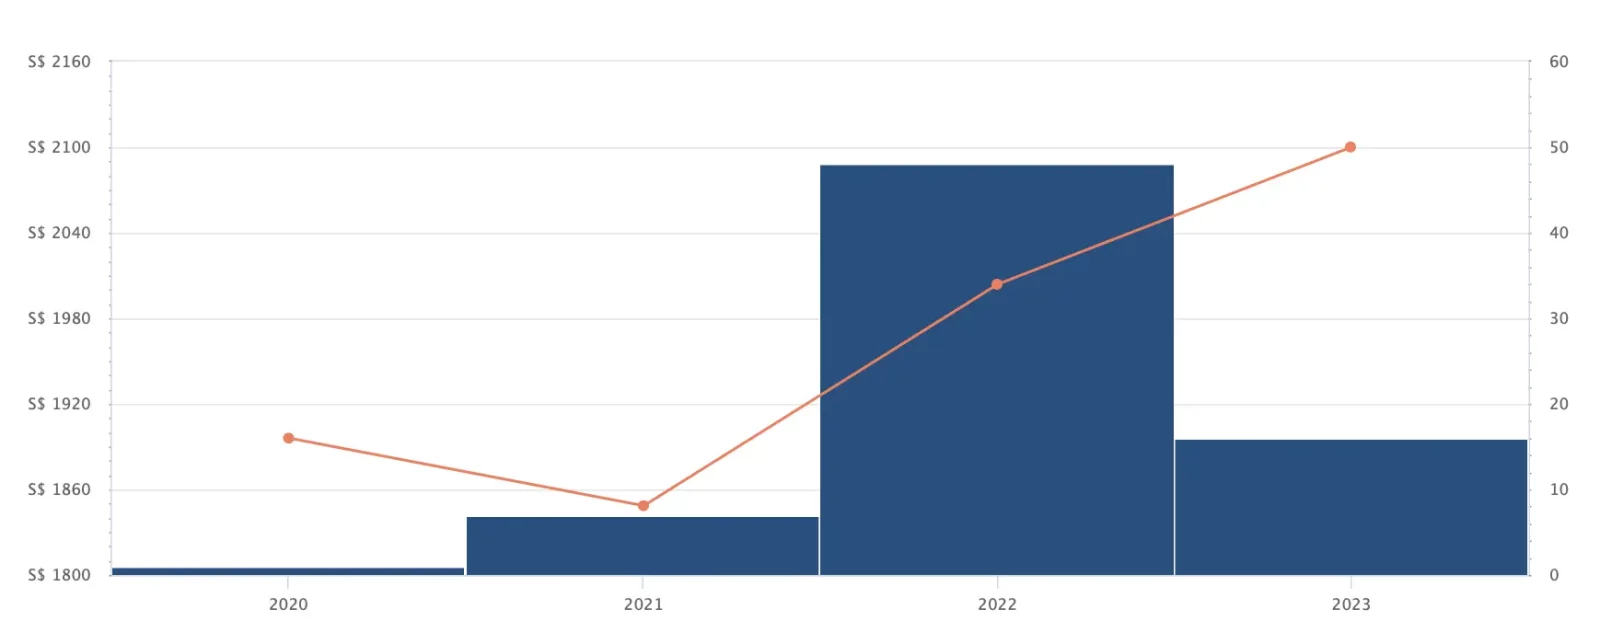
| Year | Avg PSF (resale) | YoY |
| 2021 | $1,849 | – |
| 2022 | $2,004 | 8.38% |
| 2023 | $2,100 | 4.79% |
| Annualised | – | 6.57% |
*We have excluded 2020 as there was only 1 resale transaction.
As with The Poiz Residences, Queens Peak is also still a relatively new project and thus, has limited data available. Its resale prices have also been on an upward trajectory over the last 2 years which is in line with the overall market movement.
Queenstown has a larger number of HDB flats as compared to private condominiums which are mostly located in the vicinity of Queens Peak.
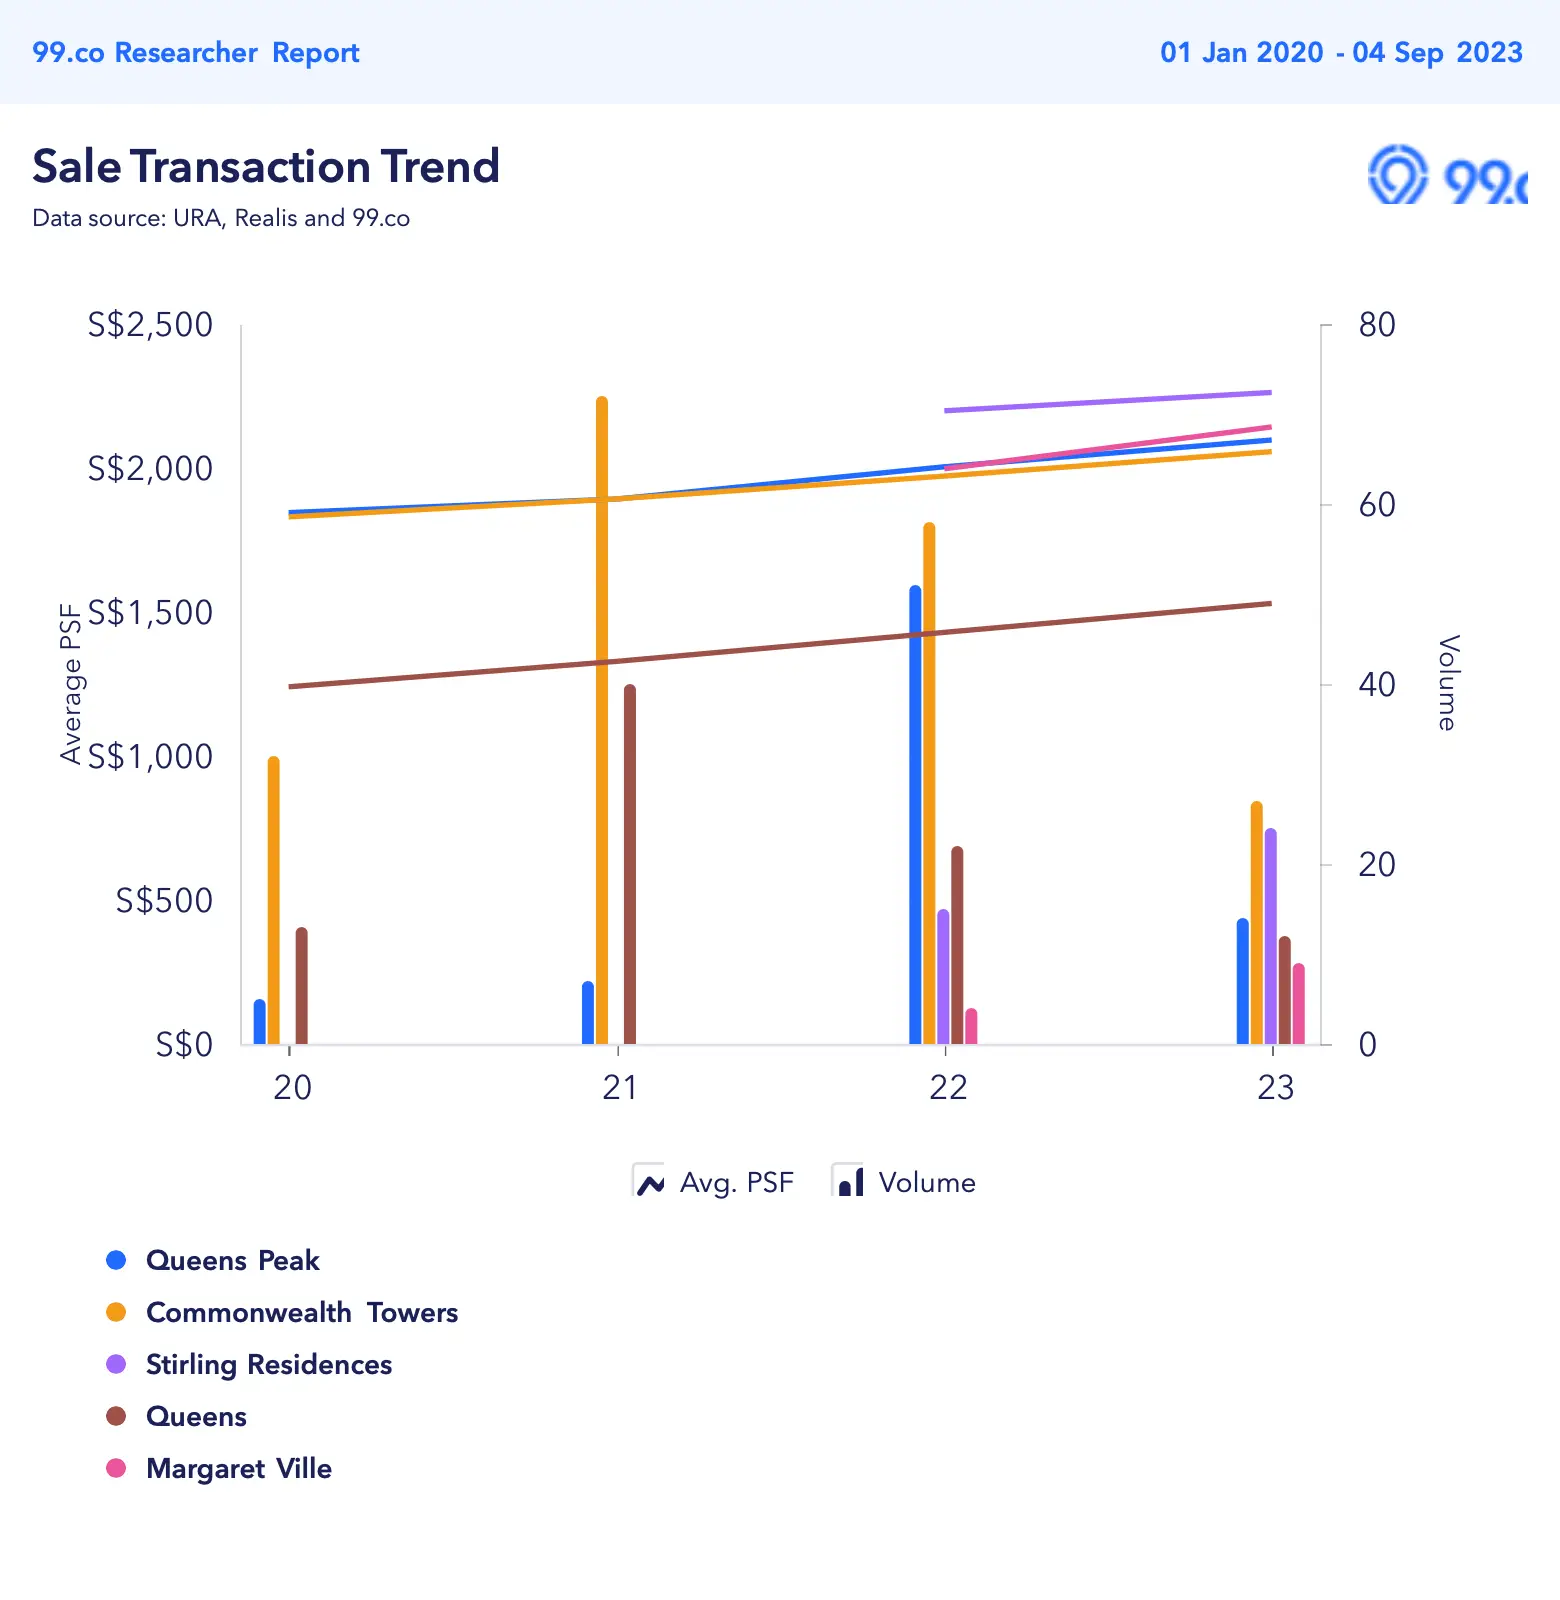
The graph illustrates that the average resale price PSF for Queens Peak, Commonwealth Towers, and Margaret Ville is pretty comparable. Stirling Residences, being the newest development in the vicinity, commands the highest PSF, while Queens, the oldest among them, has the lowest PSF.
With the exception of Queens, the other three projects collectively have a significant number of 1-bedroom units, which could potentially pose challenges in terms of selling these units due to increased competition. 1-bedroom units, in general, may already face difficulty in finding buyers on the secondary market, given their limited buyer pool, and this challenge could be exacerbated by the strong competition in the area.
| Project | Tenure | Completion year | Unit of units | Avg 1-bedder PSF | Avg size of 1-bedder transacted (sqft) | Avg 1-bedder price (Jan 2023 till date) |
| Stirling Residences | 99 years | 2022 | 1,259 | $2,282 | 484 | $1,107,222 |
| Margaret Ville | 99 years | 2021 | 309 | $2,203 | 495 | $1,090,500 |
| Queens Peak | 99 years | 2020 | 736 | $2,174 | 467 | $1,014,000 |
| Commonwealth Towers | 99 years | 2017 | 845 | $2,034 | 466 | $948,059 |
| Queens | 99 years | 2002 | 722 | No 1-bedders | No 1-bedders | No 1-bedders |
Considering that among the newer projects, Queens Peak offers the second-lowest price, falling just behind Commonwealth Towers (also on account of the age difference). This presents an appealing option for potential investors, especially if the rental rates are comparable to those of the slightly newer developments which have a higher price tag.
In the vicinity, there are two vacant land plots earmarked for residential developments. If these plots are developed into private condominiums, it could introduce additional competition, which may potentially have an adverse effect on prices. However, for the time being, given the constrained supply of condominiums in Queenstown and its prime location, it is probable that prices will remain resilient.
With your current rental of $3,600 per month, based on the average 1-bedroom price of $1,014,000, the rental yield is at 4.3%.
Let’s now look at the options you’re considering.
Options
Option 1. Sell both properties and purchase a landed
We assume your interest lies in acquiring a freehold or 999-year leasehold landed property, as you’ve mentioned the potential for better capital appreciation.
Several important considerations should be taken into account:
- You will have to utilise all your CPF funds and available cash for the purchase, and also take up a substantial loan, which could impact your retirement savings.
- If your intention is to purchase the landed property as an investment and rent it out while continuing to reside in your parent’s HDB flat, it’s important to note that the rental yield will likely be lower than condominiums.
- Realising significant gains from the property may require a longer holding period, potentially affecting your retirement plans. Since the purpose of acquiring a freehold property is typically to secure its value in the long term, selling the property in the short term is unlikely.
- With a budget of $3.8M, options for freehold or 999-year leasehold landed properties are relatively limited, and many of these units require extensive renovation which will be costly.
Here are some houses that are currently on the market which fall within your affordability:
| Location | Tenure | Property type | Land size (sqft) | No. of bedrooms | Asking price |
| Sennett Estate | Freehold | Terrace | 1,498 | 4 | $3,300,000 |
| Hillview Estate | Freehold | Terrace | 2,238 | 4 | $3,500,000 |
| Sembawang Hill Estate | Freehold | Terrace | 2,220 | 3 | $3,800,000 |
Let’s say you were to purchase the property at Sennett Estate. We will do a simple calculation and projection to determine the cost incurred and potential profits. We will use a 10 year timeframe since your plan is to retire in 10 years’ time.
Here are some of the terrace houses with a comparable land size that changed hands in Sennett Estate this year:
| Date | Land size (sqft) | PSF | Price |
| Aug 2023 | 1,569 | $2,438 | $3,825,800 |
| Jul 2023 | 1,500 | $2,199 | $3,300,000 |
| May 2023 | 1,703 | $2,106 | $3,586,000 |
| May 2023 | 1,500 | $1,899 | $2,850,000 |
| May 2023 | 1,552 | $2,300 | $3,570,000 |
| May 2023 | 1,501 | $1,953 | $2,930,000 |
| Apr 2023 | 1,502 | $1,365 | $2,050,000 |
| Mar 2023 | 1,705 | $1,995 | $3,401,388 |
| Mar 2023 | 1,501 | $1,998 | $2,998,000 |
Here are the rental transactions done in the last 3 months:
| Date | Land size (sqft) | Rent |
| Jun 2023 | 1,700 | $4,500 |
| Jun 2023 | 1,500 | $6,000 |
| Jun 2023 | 1,300 | $8,200 |
| Jun 2023 | 1,600 | $5,600 |
| May 2023 | 1,700 | $3,800 |
We will use the average selling price of $3,167,910 and average rent of $5,620 for the calculation. Do note that we have not taken renovation costs into consideration.
| Description | Amount |
| Purchase price | $3,167,910 |
| CPF funds | $953,000 |
| Cash | $1,427,500 |
| BSD | $129,674 |
| Loan required | $917,084 |
Cost of holding the property for 10 years while renting it out:
| Description | Amount |
| BSD | $129,674 |
| Interest expenses (Assuming a 4.6% interest and 18 year tenure) | $334,311 |
| Property tax | $134,780 |
| Maintenance fees (Assuming $2,000/year) | $20,000 |
| Rental income | $674,400 |
| Agency fees (Payable once every 2 years) | $30,350 |
| Estimated gains | $25,285 |
We will do a simple 10-year projection using the annualised growth rate of 2.55% for landed properties over the last decade (based on Q1 of each year).
| Year | Landed PPI | YoY |
| 2013 | 177.8 | |
| 2014 | 175.9 | -1.07% |
| 2015 | 166.1 | -5.57% |
| 2016 | 159 | -4.27% |
| 2017 | 150.8 | -5.16% |
| 2018 | 155.8 | 3.32% |
| 2019 | 164.4 | 5.52% |
| 2020 | 170.3 | 3.59% |
| 2021 | 185.4 | 8.87% |
| 2022 | 205.3 | 10.73% |
| 2023 | 228.7 | 11.40% |
| Annualised | 2.55% |
| Time period | Property price | Gains |
| Starting point | $3,167,910 | |
| Year 1 | $3,248,692 | $80,782 |
| Year 2 | $3,331,533 | $163,623 |
| Year 3 | $3,416,487 | $248,577 |
| Year 4 | $3,503,608 | $335,698 |
| Year 5 | $3,592,950 | $425,040 |
| Year 6 | $3,684,570 | $516,660 |
| Year 7 | $3,778,527 | $610,617 |
| Year 8 | $3,874,879 | $706,969 |
| Year 9 | $3,973,688 | $805,778 |
| Year 10 | $4,075,018 | $907,108 |
Total gains in 10 years if you were to sell both properties and purchase a landed to rent out: $25,285 + $907,108 = $932,393
It is important to note that, in order to realise these gains, you will have to sell the property.
| Description | Amount |
| Selling price | $3,941,910 |
| Outstanding loan | $501,271 |
| CPF to be refunded into OA (Assuming that half of the monthly loan repayment of $6,251 is paid with CPF) | $1,645,783 |
| Estimated sales proceeds | $1,794,856 |
Using your CPF funds, you could go on to purchase another property for your own stay during your retirement years and utilise the sales proceeds as your retirement funds.
Option 2. Sell both properties and invest sales proceeds in REITs
Whether investing in REITs aligns with your financial strategy hinges on your risk appetite and investment goals. While REITs are appealing for their dividend payouts, they exhibit stock-like volatility, making future price predictions less certain over a 10-year span. The likelihood of a landed property’s value halving in the next decade is arguably lower than a significant dip in your REIT portfolio. Events like the 2008 Global Financial Crisis can heavily impact local REITs, potentially resulting in declines exceeding 50%. Meanwhile, landed properties offer less liquidity, but existing property measures mitigate the risk of drastic market downturns.
Based on an article done by DBS, the return on investment (ROI) for REITs typically ranges between 5 – 6% annually. Let’s do a simple 10-year projection for the various ROI if you were to invest all the sales proceeds of $615,500 as well as your liquid assets of $812,000.
| ROI | Investment amount after 10 years | Gains |
| 4% | $2,113,049 | $685,549 |
| 5% | $2,325,247 | $897,747 |
| 6% | $2,556,435 | $1,128,935 |
| 7% | $2,808,109 | $1,380,609 |
| 8% | $3,081,865 | $1,654,365 |
We should also take into consideration the interest earned from the CPF funds that will go back into your accounts after the sale of the properties, as well as the existing funds in your OAs.
| Time period | CPF funds | Interest earned |
| Starting point | $953,000 | $0 |
| Year 1 | $976,825 | $23,825 |
| Year 2 | $1,001,246 | $48,246 |
| Year 3 | $1,026,277 | $73,277 |
| Year 4 | $1,051,934 | $98,934 |
| Year 5 | $1,078,232 | $125,232 |
| Year 6 | $1,105,188 | $152,188 |
| Year 7 | $1,132,818 | $179,818 |
| Year 8 | $1,161,138 | $208,138 |
| Year 9 | $1,190,166 | $237,166 |
| Year 10 | $1,219,921 | $266,921 |
Depending on the ROI, the total profits made over 10 years if you were to sell both properties and invest in REITs could potentially range from $952,469 to $1,921,286.
Do bear in mind that we haven’t factored in any trading fees. Nevertheless, even if we do consider those fees, it’s worth noting that the expenses are still considerably lower compared to purchasing a property, and as a result, the potential profits may be higher if you opt to invest in REITs.
That said, it’s also worth noting that this analysis is contingent on an interest rate of 4.6% on the mortgage loan and an appreciation rate of 2.55% for a landed property. If interest rates decrease and property appreciation rates increase, there is a chance that the profitability of property investment could become comparable. As mentioned, there’s also a risk that prices of REITs could be lower 10 years from now given the volatility of the markets.
Option 3. Remain status quo
Remaining status quo is a viable option since both your properties are relatively young, and from our earlier look at their performance, it’s likely to remain resilient. Additionally, given that current rental rates are still high, it will be an advantageous time to capitalise on that.
Let’s take a look at the costs incurred and potential profits should you decide to continue holding on to the properties for the next 10 years.
In order to calculate the remaining loan tenure, we will assume that both properties were purchased when they first launched.
Cost incurred for The Poiz Residences
| Description | Amount |
| Interest expenses (Based on an outstanding loan of $1.05M at an interest rate of 4.6% with a remaining tenure of 15 years) | $353,026 |
| Maintenance fees (Assuming $330/month) | $39,600 |
| Property tax | $120,960 |
| Rental income (At $5,300/month with no vacancy period) | $636,000 |
| Agency fees (Payable once every 2 years) | $28,620 |
| Total gains | $93,794 |
For non-landed properties, we’ll use a 2.5% appreciation rate which is taken from URA’s Property Price Index over the past 10 years (based on Q1 of each year). This follows the same method that we used in deriving landed home gains so as to keep the comparison fair.
| Year | Non-landed PPI | YoY |
| 2013 | 145.9 | – |
| 2014 | 145.7 | -0.14% |
| 2015 | 140.9 | -3.29% |
| 2016 | 136.6 | -3.05% |
| 2017 | 133.8 | -2.05% |
| 2018 | 141.6 | 5.83% |
| 2019 | 145.2 | 2.54% |
| 2020 | 148.1 | 2.00% |
| 2021 | 157.1 | 6.08% |
| 2022 | 167.9 | 6.87% |
| 2023 | 186.8 | 11.26% |
| Annualised | – | 2.50% |
| Time period | Property price | Gains |
| Starting point | $1,842,500 | |
| Year 1 | $1,888,563 | $46,063 |
| Year 2 | $1,935,777 | $93,277 |
| Year 3 | $1,984,171 | $141,671 |
| Year 4 | $2,033,775 | $191,275 |
| Year 5 | $2,084,620 | $242,120 |
| Year 6 | $2,136,735 | $294,235 |
| Year 7 | $2,190,154 | $347,654 |
| Year 8 | $2,244,907 | $402,407 |
| Year 9 | $2,301,030 | $458,530 |
| Year 10 | $2,358,556 | $516,056 |
Cost incurred for Queens Peak
| Description | Amount |
| Interest expenses (Based on an outstanding loan of $350K at an interest rate of 4.6% with a remaining tenure of 25 years) | $141,040 |
| Maintenance fees (Assuming $180/month) | $21,600 |
| Property tax | $62,400 |
| Rental income (At $3,600/month with no vacancy period) | $432,000 |
| Agency fees (Payable once every 2 years) | $19,440 |
| Total gains | $187,520 |
| Time period | Property price | Gains |
| Starting point | $1,014,000 | |
| Year 1 | $1,039,350 | $25,350 |
| Year 2 | $1,065,334 | $51,334 |
| Year 3 | $1,091,967 | $77,967 |
| Year 4 | $1,119,266 | $105,266 |
| Year 5 | $1,147,248 | $133,248 |
| Year 6 | $1,175,929 | $161,929 |
| Year 7 | $1,205,327 | $191,327 |
| Year 8 | $1,235,461 | $221,461 |
| Year 9 | $1,266,347 | $252,347 |
| Year 10 | $1,298,006 | $284,006 |
We will also include the interest earned on the CPF funds that are currently in your accounts which amounts to $31,369 in 10 years’ time.
Total gains if you were to remain status quo: $93,794 + $516,056
+ $187,520 + $284,006 + $31,369 = $1,112,745
What should you do?
| Option | Potential gains in 10 years |
| Sell both properties and purchase a landed | $932,393 |
| Sell both properties and invest sales proceeds in REITs | $952,469 to $1,921,286 |
| Remain status quo | $1,112,745 |
Based on the above calculations, Option 1 would result in the lowest returns among the three pathways. It would also necessitate utilising all of your CPF and available cash for the purchase, potentially impacting your retirement savings.
This could result in a situation where you’re asset-rich, cash poor – a plight that quite a number of seniors face. They grow attached to the landed home or hope to pass it on to their children, but as a result of this, they find themselves struggling in their retirement years.
Unless you have a separate investment such as an annuity or can depend on your CPF Payouts, this option may not be practical for your retirement years.
That being said, when examining historical data, we find that in most cases, the annualised growth rate of landed properties over a 10-year period surpasses that of non-landed properties:
| Year | Landed PPI | Non-landed PPI | Landed annualised growth rate every 10 years | Non-landed annualised growth rate ever 10 years |
| 1975-Q1 | 7.4 | 10.5 | – | – |
| 1976-Q1 | 7.9 | 11.5 | – | – |
| 1977-Q1 | 7.9 | 11.5 | – | – |
| 1978-Q1 | 7.5 | 11.5 | – | – |
| 1979-Q1 | 8.4 | 12.7 | – | – |
| 1980-Q1 | 12.3 | 18.9 | – | – |
| 1981-Q1 | 23.7 | 39.6 | – | – |
| 1982-Q1 | 27 | 38.7 | – | – |
| 1983-Q1 | 32.6 | 40.6 | – | – |
| 1984-Q1 | 36.9 | 38.1 | – | – |
| 1985-Q1 | 31.8 | 30.9 | 15.70% | 11.40% |
| 1986-Q1 | 26.1 | 26.5 | 12.69% | 8.71% |
| 1987-Q1 | 30.4 | 26.8 | 14.43% | 8.83% |
| 1988-Q1 | 32.6 | 30.7 | 15.83% | 10.32% |
| 1989-Q1 | 34 | 35.2 | 15.01% | 10.73% |
| 1990-Q1 | 40.3 | 41.6 | 12.60% | 8.21% |
| 1991-Q1 | 41.8 | 42.8 | 5.84% | 0.78% |
| 1992-Q1 | 50.5 | 49.9 | 6.46% | 2.57% |
| 1993-Q1 | 60.4 | 57.2 | 6.36% | 3.49% |
| 1994-Q1 | 95.2 | 72.7 | 9.94% | 6.67% |
| 1995-Q1 | 129.6 | 95.2 | 15.08% | 11.91% |
| 1996-Q1 | 138.4 | 110.8 | 18.15% | 15.38% |
| 1997-Q1 | 129.9 | 111.9 | 15.63% | 15.36% |
| 1998-Q1 | 106.3 | 93 | 12.55% | 11.72% |
| 1999-Q1 | 76.5 | 75.2 | 8.45% | 7.89% |
| 2000-Q1 | 100.7 | 98.5 | 9.59% | 9.00% |
| 2001-Q1 | 94.4 | 90 | 8.49% | 7.72% |
| 2002-Q1 | 85.4 | 82 | 5.39% | 5.09% |
| 2003-Q1 | 84.4 | 80.6 | 3.40% | 3.49% |
| 2004-Q1 | 82.7 | 79.6 | -1.40% | 0.91% |
| 2005-Q1 | 84 | 81.4 | -4.24% | -1.55% |
| 2006-Q1 | 86.8 | 85.7 | -4.56% | -2.54% |
| 2007-Q1 | 94 | 98.8 | -3.18% | -1.24% |
| 2008-Q1 | 117.1 | 129 | 0.97% | 3.33% |
| 2009-Q1 | 100 | 100 | 2.71% | 2.89% |
| 2010-Q1 | 128.4 | 124.3 | 2.46% | 2.35% |
| 2011-Q1 | 161.1 | 137.3 | 5.49% | 4.31% |
| 2012-Q1 | 171.2 | 141 | 7.20% | 5.57% |
| 2013-Q1 | 177.8 | 145.9 | 7.74% | 6.11% |
| 2014-Q1 | 175.9 | 145.7 | 7.84% | 6.23% |
| 2015-Q1 | 166.1 | 140.9 | 7.06% | 5.64% |
| 2016-Q1 | 159 | 136.6 | 6.24% | 4.77% |
| 2017-Q1 | 150.8 | 133.8 | 4.84% | 3.08% |
| 2018-Q1 | 155.8 | 141.6 | 2.90% | 0.94% |
| 2019-Q1 | 164.4 | 145.2 | 5.10% | 3.80% |
| 2020-Q1 | 170.3 | 148.1 | 2.86% | 1.77% |
| 2021-Q1 | 185.4 | 157.1 | 1.41% | 1.36% |
| 2022-Q1 | 205.3 | 167.9 | 1.83% | 1.76% |
| 2023-Q1 | 228.7 | 186.8 | 2.55% | 2.50% |
Therefore, if your intention is to sell your landed home and downsize in the future, this option may make sense, especially if you value the experience of living in a landed property and wish to unlock your home for retirement. A landed home is surely a steadier asset to hold than a portfolio of REITs. Even then, you have to weigh the downside of having to move houses during this time which can be a real bane during retirement.
We’ll also caution here that freehold/999-year leasehold landed properties within your budget are quite limited and mostly require substantial renovations, leading to significant additional expenses. Landed homes within this budget likely wouldn’t consist of a lift too which is a crucial thing to note when you are in your senior years, and that additional reno cost to incorporate one could be costly.
Option 2, involving the sale of both properties and reinvesting the proceeds in REITs, is a viable choice if you prefer not to manage physical properties and want to reduce associated expenses. Nevertheless, it carries certain investment risks, as mentioned above. This option also means you won’t have ownership of any physical property, which could be problematic if you ever need an immediate place to live. If you are going down this route, it would make sense to invest in a diversified portfolio of REITs and be comfortable living on the dividends. If you are dependent on the capital at any point to make a large purchase, such a property for example, then this is risky because the value of the portfolio could be lower in the future if the market crashes or does not recover quickly enough.
Finally, the last option of maintaining the current status quo may still be the most favorable. Why?
There are a couple of reasons:
- Both properties are still relatively new, which presents potential for appreciation.
- Additionally, the current rental rates are at an elevated level, making it a favorable time to be a landlord.
- The rental income serves as returns on your assets. Buying a landed and residing in it means you’ll forgo rental income. Renting it out also has a lower yield compared to renting non-landd homes.
- You get to sit on the sidelines while we’re experiencing the high-interest rate environment today. History has shown that high levels of interest rates are not sustainable given markets operate in a cycle. In the long-term, the interest rate could possibly be lower, bringing down the long-term interest rate you’d have to pay.
- Greater flexibility: with two properties, you can always sell one to unlock more cash if needed, or move into one easily. By holding onto both properties, you reduce the need to pay taxes in the future should you wish to buy another property later to move into. ABSD is likely to stay, so if you intend to have 2 properties later on, you’d have to factor in this high tax which is unlikely to go away.
For more news and information on the Singapore private property market or an in-depth look at new and resale properties, follow us on Stacked.
At Stacked, we like to look beyond the headlines and surface-level numbers, and focus on how things play out in the real world.
If you’d like to discuss how this applies to your own circumstances, you can reach out for a one-to-one consultation here.
And if you simply have a question or want to share a thought, feel free to write to us at stories@stackedhomes.com — we read every message.
Need help with a property decision?
Speak to our team →Read next from Property Advice

Property Advice We Can Buy Two HDBs Today — Is Waiting For An EC A Mistake?

Property Advice I’m 55, Have No Income, And Own A Fully Paid HDB Flat—Can I Still Buy Another One Before Selling?

Property Advice We’re Upgrading From A 5-Room HDB On A Single Income At 43 — Which Condo Is Safer?

Property Advice We’re In Our 50s And Own An Ageing Leasehold Condo And HDB Flat: Is Keeping Both A Mistake?
Latest Posts

Property Market Commentary We Review 7 Of The June 2026 BTO Launch Sites – Which Is The Best Option For You?

Singapore Property News The Most Expensive Resale Flat Just Sold for $1.7M in Queenstown — Is There No Limit to What Buyers Will Pay?

On The Market Here Are The Cheapest 4-Room HDB Flats Near An MRT You Can Still Buy From $450K






2 Comments
Earn so little can afford 2 condos, quite impressive!
Stay with parents = rent-free, so frees up >$15k monthly for housing loans. Very smart & prudent approach. They deserve it.