Here’s What Happens When You Buy A New Launch At The Peak Of The Property Cycle
Get The Property Insights Serious Buyers Read First: Join 50,000+ readers who rely on our weekly breakdowns of Singapore’s property market.
When is the right time to buy a house?
It’s a million-dollar question, both literally and figuratively.
Buy low and sell high is the mantra that everyone chants, but anyone experienced in real estate will know that it is impossible to time the market.
Sure, you might have indications to know when the market is slowing down, but no one can predict when the bottom is going to happen.
And when I say no one, I mean no one. Not you, not me, not the Straits Times, nor the developers building your homes in Singapore.
So if we can’t determine the right/best time to buy a house, are we able to then find out the wrong time to buy a house and just avoid that period instead?
But is there really such a thing as a wrong time?
Very obviously, most people would say that the “wrong” time to buy a house would be at the height of the market.
Because who wants to buy at the market peak?
It’s a common train of thought, what goes up must come down, or the market keeps going up and up, and it will have to crash eventually.
So yes, just avoid the market peaks, and you should do fine… right?
Well, today I’d like to explore that exact notion:
If you had bought at a property cycle market peak, how would you have fared today?
Let’s go through the methodology real quick.
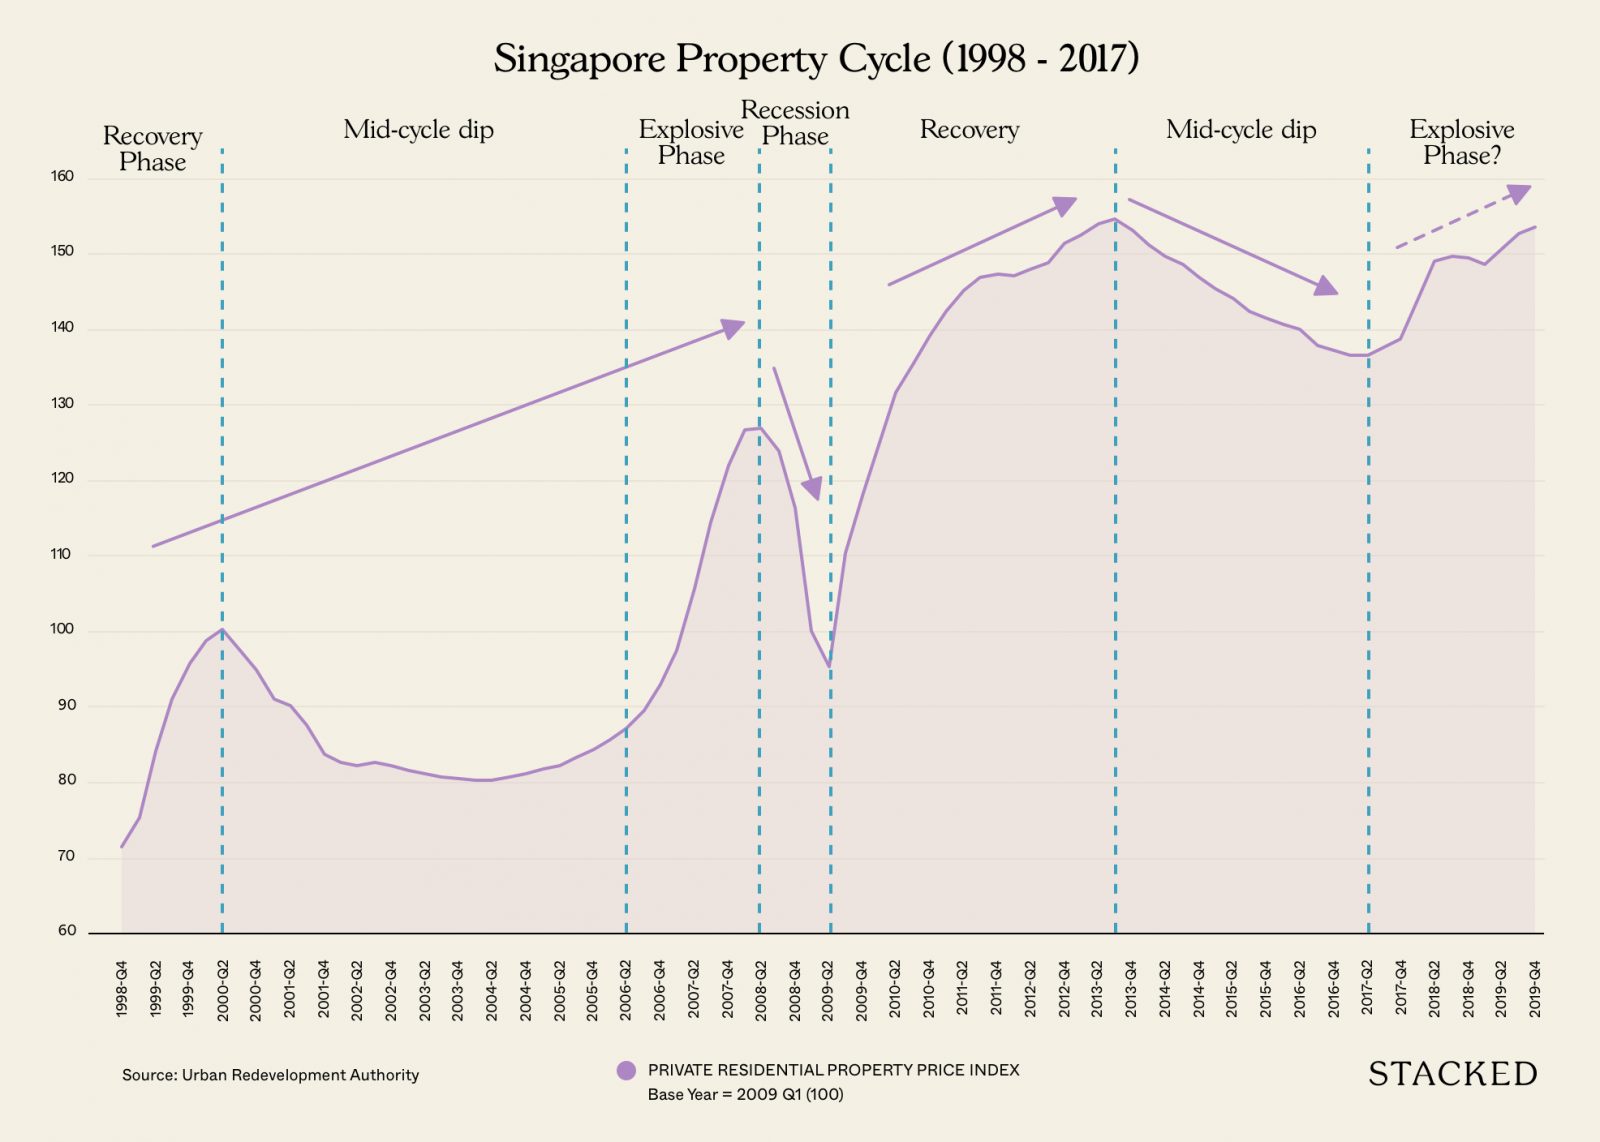
In this scenario, I would be looking at the last peak in the property cycle – Q3 2013.
More specifically – just new sales in this analysis.
For one, because we are in a new launch phase right now, so this would naturally be more relevant to people.
Secondly, new launches will be a level playing field to compare given that there will be a good amount of transactions to look at moving forward. Plus, we wouldn’t have to take into account the variance of resale units (whether it is well renovated or not).
Just to be clear, this is purely based on actual transactions.
In other words, it must be bought as a new sale in Q3 2013, and that exact unit must be sold further down the line for it to be counted in the analysis.
So even if there was a transaction on June 30th this would not be counted in as that is considered to be part of Q2 2013 instead.
These will be tabulated down to see how many profit and loss transactions each development has actually sustained.
It’s been a long introduction, so let’s get started!
Insights from 56 new sale projects in Q3 2013
| Development | Profit | Loss | Avg Profit | Avg Loss | Units | District | Tenure |
| 57 @ KOVAN | 1 | – | $130,000 | – | 10 | 19 | 99 Yrs FROM 2013 |
| BARTLEY RIDGE | 12 | – | $127,875 | – | 868 | 13 | 99 Yrs FROM 2012 |
| CAMBIO SUITES | – | 1 | – | -$89,360 | 53 | 19 | Freehold |
| CITY SUITES | 1 | – | $34,800 | – | 56 | 13 | 99 Yrs FROM 2012 |
| D’NEST | 6 | – | $126,398 | – | 912 | 18 | 99 Yrs FROM 2010 |
| D’ZIRE | – | 1 | – | -$164,800 | 47 | 19 | 999 Yrs FROM 1875 |
| E MAISON | – | 1 | – | -$50,500 | 130 | 13 | Freehold |
| ECHELON | 1 | – | $19,550 | 508 | 3 | 99 Yrs FROM 2012 | |
| ECO | – | 1 | – | -$55,800 | 748 | 16 | 99 Yrs FROM 2012 |
| ECO SANCTUARY | 1 | – | $54,780 | – | 483 | 23 | 99 Yrs FROM 2012 |
| EIGHT RIVERSUITES | 9 | – | $73,611 | – | 843 | 12 | 99 Yrs FROM 2011 |
| EUHABITAT | – | 1 | – | -$42,792 | 697 | 14 | 99 Yrs FROM 2010 |
| FLORAVILLE | – | 1 | – | -$100,000 | 50 | 19 | 99 Yrs FROM 2012 |
| GARDEN PARK RESIDENCES | 1 | 1 | $4,280 | -$48,200 | 36 | 15 | Freehold |
| H2O RESIDENCES | 2 | – | $94,000 | – | 521 | 28 | 99 Yrs FROM 2010 |
| HILLION RESIDENCES | 1 | – | $26,000 | – | 546 | 23 | N.A. |
| HILLSTA | 1 | 3 | $12,000 | -$41,533 | 396 | 23 | 99 Yrs FROM 2011 |
| J GATEWAY | 49 | 1 | $131,804 | -$9,400 | 738 | 22 | 99 Yrs FROM 2012 |
| JEWEL @ BUANGKOK | 10 | 1 | $77,293 | -$30,000 | 616 | 19 | 99 Yrs FROM 2012 |
| KAP RESIDENCES | 3 | – | $46,167 | – | 142 | 21 | Freehold |
| LA FIESTA | 5 | – | $65,000 | – | 810 | 19 | 99 Yrs FROM 2012 |
| LEEDON RESIDENCE | – | 2 | – | -$104,595 | 381 | 10 | Freehold |
| MIDTOWN RESIDENCES | 3 | 1 | $44,433 | -$35,000 | 160 | 19 | 99 Yrs FROM 2013 |
| ONE BALMORAL | 1 | – | $218,450 | – | 91 | 10 | Freehold |
| PARC OLYMPIA | 1 | – | $120,000 | – | 486 | 17 | 99 Yrs FROM 2012 |
| PAVILION SQUARE | – | 1 | – | -$13,800 | 42 | 14 | Freehold |
| Q BAY RESIDENCES | 1 | – | $50,630 | – | 630 | 18 | 99 Yrs FROM 2012 |
| RIPPLE BAY | 1 | – | $113,000 | – | 679 | 18 | 99 Yrs FROM 2011 |
| RIVERBAY | 3 | 1 | $74,650 | -$21,650 | 147 | 12 | 999 Yrs FROM 1882 |
| RIVERSAILS | 2 | – | $121,010 | – | 920 | 19 | 99 Yrs FROM 2011 |
| RV RESIDENCES | 3 | – | $57,080 | – | 248 | 23 | 999 Yrs FROM 1885 |
| SANT RITZ | 2 | – | $11,735 | – | 214 | 13 | 99 Yrs FROM 2012 |
| SEAHILL | – | 1 | – | -$265,350 | 460 | 5 | 99 Yrs FROM 2011 |
| SENNETT RESIDENCE | 1 | – | $32,000 | – | 332 | 13 | 99 Yrs FROM 2011 |
| SKY HABITAT | – | 1 | – | -$198,720 | 509 | 20 | 99 Yrs FROM 2011 |
| SKYLINE 360 @ ST THOMAS WALK | 2 | 1 | $192,778 | -$11,503 | 61 | 9 | Freehold |
| SKYLINE RESIDENCES | – | 1 | – | -$92,000 | 283 | 4 | Freehold |
| STRATUM | 3 | 1 | $87,333 | -$94,000 | 380 | 18 | 99 Yrs FROM 2012 |
| THE BENTLY RESIDENCES@KOVAN | 1 | – | $12,000 | – | 48 | 28 | Freehold |
| THE BEVERLY | 1 | – | $178,200 | – | 118 | 21 | Freehold |
| THE GLADES | 1 | 1 | $115,500 | -$70,100 | 726 | 10 | Freehold |
| THE INTERLACE | 3 | 3 | $253,787 | -$274,660 | 1,040 | 4 | 99 Yrs FROM 2009 |
| THE QUINN | – | 2 | – | -$105,354 | 139 | 19 | Freehold |
| THE RED HOUSE | – | 1 | – | -$32,000 | 42 | 15 | 99 Yrs FROM 2012 |
| THE SHORE RESIDENCES | 1 | – | $161,000 | – | 408 | 19 | Freehold |
| THE SKYWOODS | 1 | – | $71,780 | – | 420 | 23 | 99 Yrs FROM 2011 |
| THE TEMBUSU | 14 | 2 | $100,000 | -$57,000 | 337 | 18 | 99 Yrs FROM 2012 |
| THE TRIZON | – | 1 | – | -$190,000 | 289 | 10 | Freehold |
| THE VIRIDIAN | 1 | – | $2,000 | – | 108 | 12 | Freehold |
| THE WHARF RESIDENCE | 1 | – | $130,700 | – | 186 | 9 | 999 Yrs FROM 1841 |
| THREE 11 | 3 | 2 | $105,000 | -$109,500 | 65 | 20 | Freehold |
| TREASURES @ G20 | 1 | – | $228,038 | – | 38 | 10 | 99 Yrs FROM 2010 |
| URBAN RESIDENCES | 1 | – | $119,421 | – | 47 | 19 | Freehold |
| URBAN VISTA | – | 2 | – | -$119,000 | 582 | 16 | 99 Yrs FROM 2012 |
| VUE 8 RESIDENCE | 6 | 2 | $91,395 | -$12,220 | 463 | 18 | 99 Yrs FROM 2012 |
More from Stacked
Why We Bought A 4-Bedroom Unit At The Arden For $2.4m
In the world of property, two things tend to draw the most attention: the priciest projects and the most affordable.
- There were a total of 161 profitable and 38 unprofitable transactions.
- Of the 56 projects, 28 registered loss making transactions
- Losses per project never went beyond 3 per development, with that “honour” going to the Interlace and Hillsta
- 8 of the 28 loss making projects were boutique projects (less than 100 units)
- The biggest average loss in the top 10 goes to Three 11, with $109,500 average losses
- 40 out of 56 registered profit making transactions
- 19 out of 40 had more than 1 profit making transaction
- Out of the top 10 highest transactions profit wise, the top 8 were all 99 year leasehold properties
- District 18 had the highest number of entrants to the top 10, with 3 spots going to D’Nest, Vue 8 Residence, and Stratum
- J Gateway was by far and away the best performer with 49 profitable transactions
- Despite having the highest number of profitable transactions, J Gateway also came out on top for the highest average profit in the top 10, with $131,804
So because of the stringent criteria, while there were 158 developments that had new sale transactions in Q3 2013 to begin with, only 56 subsequently had transactions that I could use.
As always, these numbers are based on gross profit – so in reality something like an $11,000 profit might actually result in an overall loss (when you add in transaction costs and taxes etc). But to keep things simple, these were counted here as overall positive transactions.
So what can we learn from this?
Well, frankly speaking, 199 transactions isn’t a ton to go by. But just from this small sample size, you can see that quite a big majority of units are profitable – even when bought at a market peak.

(Updated) We Ranked Every District By How Much They’ve Gained (Or Lost) – Here Are The Results
by Reuben DhanarajLet’s look at the top 2 profitable projects, and see what made them winners despite the timing of purchase.
J Gateway
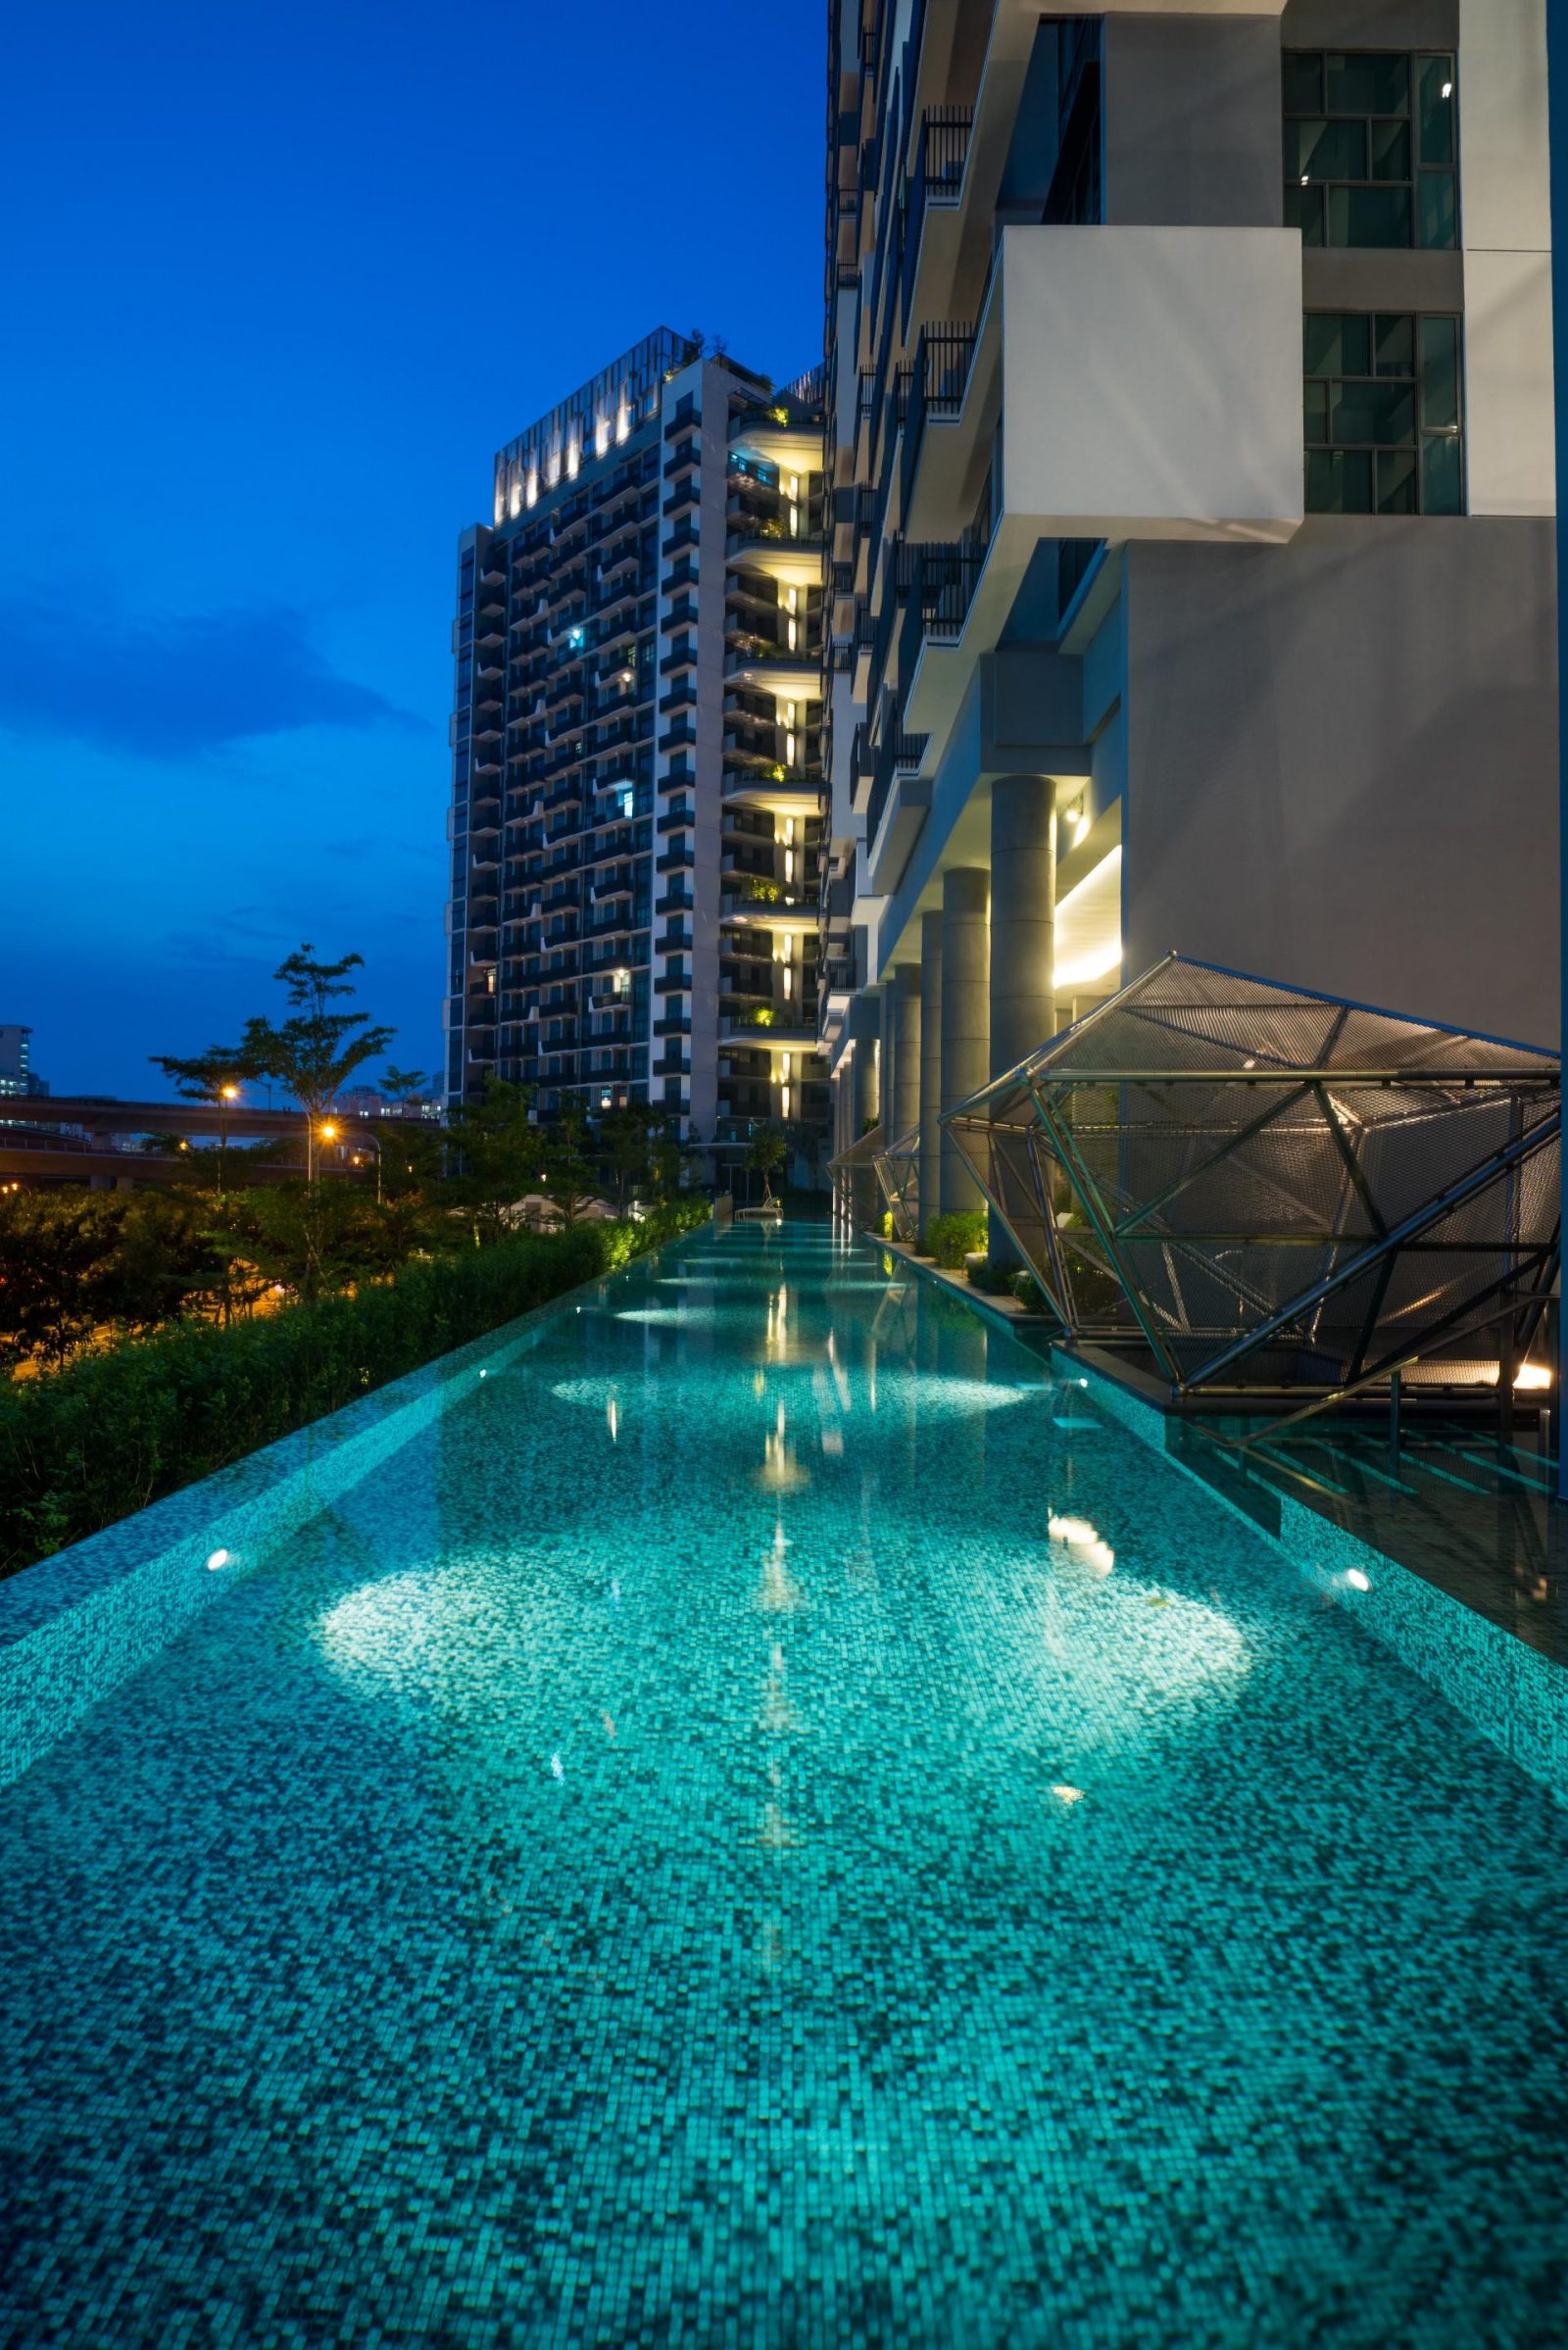
You might have read my article previously on social proof, where J Gateway was one of my prime examples on how social proof can have a detrimental effect on your property making decisions.
Yes, while it did sell all 738 units on launch day (possibly also aided by the announcements of the TDSR cooling measures the day before), naysayers were pointing out that prices were too high and possibly overhyped.
Property prices at an all time high, stock market chaos, and possible rise in interest rates were some of the outcries being bandied about.
But now looking on hindsight in 2020, it might seem like such an easy no-brainer decision now.
The truth is that many people back then were basing their decision on the high psf of its launch prices, when the real measure they should be looking at is the quantum of the unit itself.
Quantum aside, the real draw of J Gateway was really the planned transformation to the vicinity.
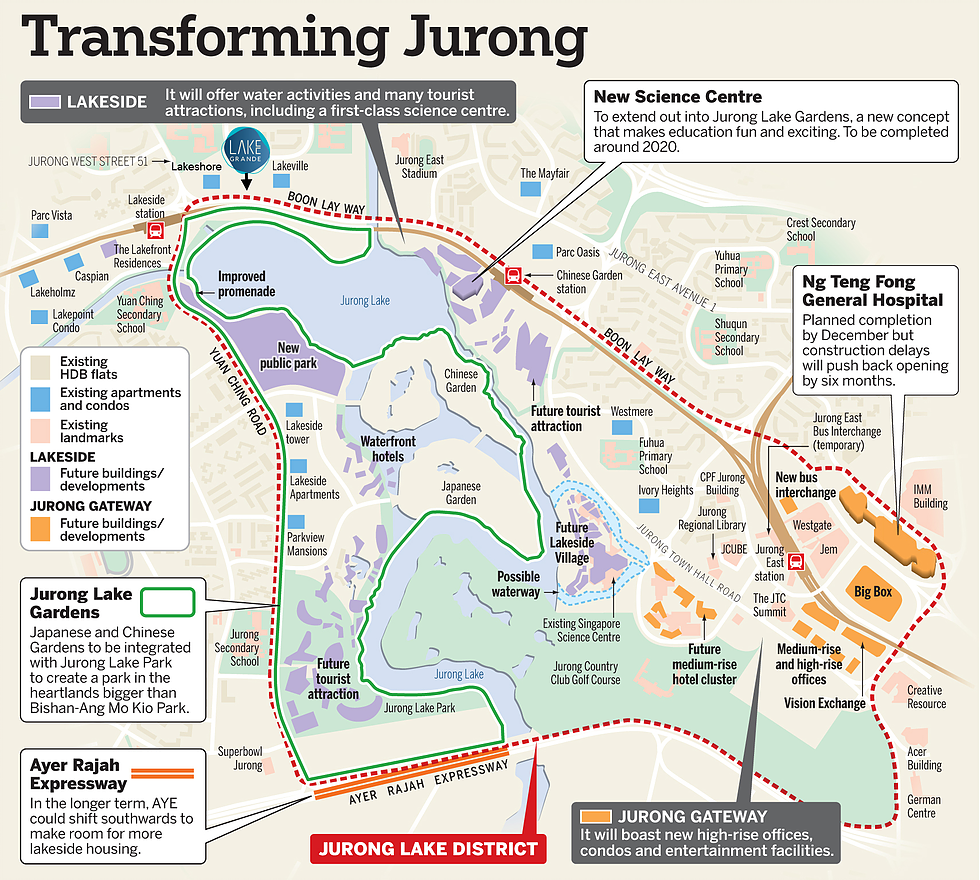
First private condominium launch in that area in 10 years, massive plans to turn Jurong Gateway into the second CBD (biggest commercial hub outside the city), offices, retail (IMM, Jcube, JEM, and Westgate), hotels, and entertainment areas.
This is in addition to the plans of the Ng Teng Fong Hospital, and the announcement of the Kuala Lumpur – Singapore high-speed rail (HSR) in February 2013.
So it’s clear to see that the support will be there – at least where rental is concerned.
And yet even with all the redevelopment currently, the Jurong Lake District still has some way to go in the full transformation of the district.
The URA Master plan is a free pass from the Government to help you see what is upcoming to the area. Use it well.
The Tembusu
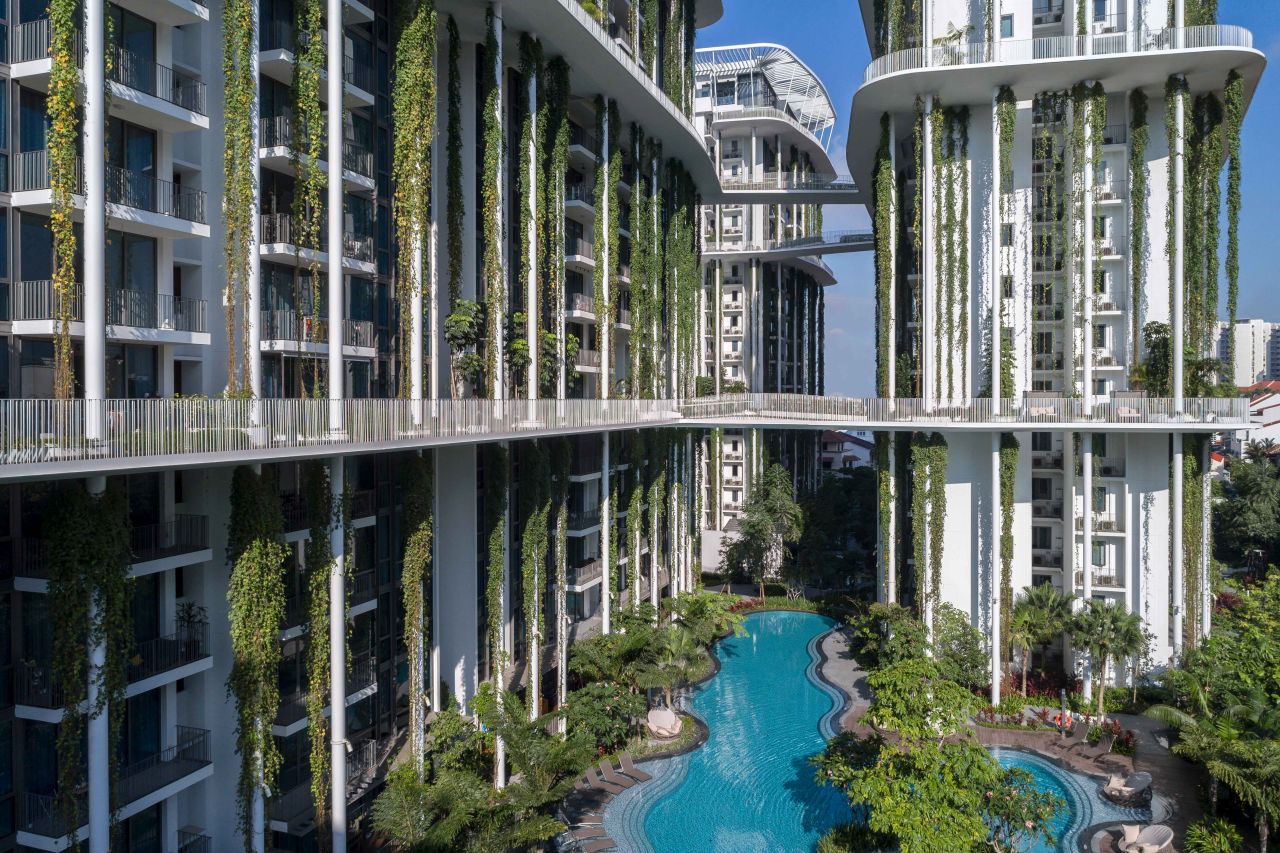
Unlike J Gateway, the Tembusu is definitely not as clear cut a decision.
It does have a lot more competitors in the market (Trilive, Kovan Grandeur, Stars of Kovan, Kovan Residences, and Kovan Melody), just to name a few.
But it has still done relatively well in the resale market, and it’s mainly down to two factors – launch prices and its freehold status.
Freehold property will always be something that Singaporeans covet, so there isn’t much to cover there.
What’s more important is the premium it’s priced at over its surrounding competitors.
In this case, the Tembusu was launched with prices at an average of $1,535 psf.
Conversely in the same period, its two leasehold competitors, Kovan Residences and Kovan Melody were selling at $1,374 psf and $1,227 psf. This implies a price gap of 10.5% and 20% respectively.
Which is not too bad at all, especially when you consider the age differences of 5 and 10 years respectively as well.
But what does this translate to in terms of actual transactions?
Given the Kovan area is more geared towards an own stay scenario, let’s look closer at the 3 bedroom units between the 3 developments.
Tembusu 3 bedroom 1,044 sqft $1.73 million
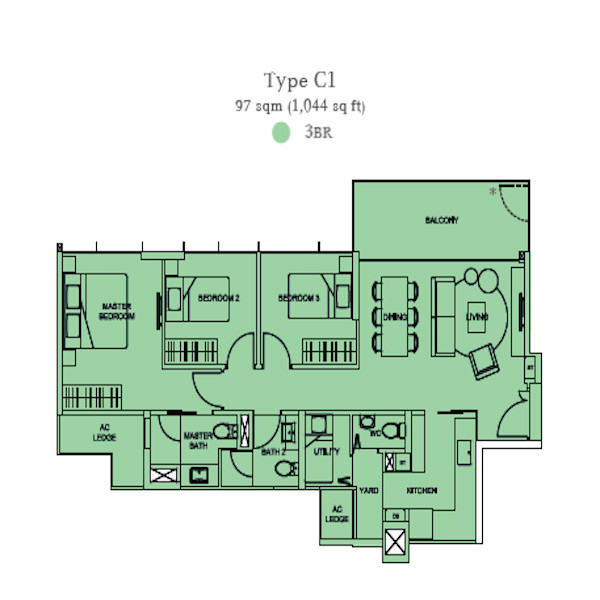
While it may be the smallest unit on offer between the 3, this unit at the Tembusu isn’t actually all that much smaller especially when you see that there aren’t any bay windows and planters that contribute towards wasted spaces.
It also does offer everything that you might need in a 3 bedroom layout, enclosed kitchen, yard, and utility area.
Coupled with it being the newest and with a freehold tenure to boot, it becomes more apparent as to why the Tembusu has fared quite well despite being bought at the peak of the property market in 2013.
Kovan Residences 3 bedroom 1,259 sqft $1.7 million
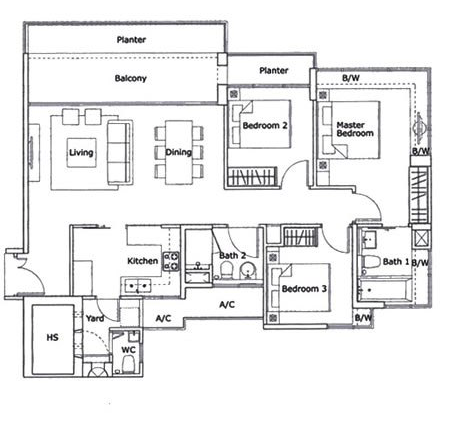
The Kovan Residences may not be too far behind in terms of age (5 years apart), but it still comes from the era of the now dreaded bay windows and planters.
So despite the fact that it is about 200 odd square feet bigger than the Tembusu on paper, the planters along the balcony and common bedroom, along with the bay windows at the master bedroom and bathroom do take up quite a significant amount of usable space.
As you can see, the quantums between the Tembusu and Kovan Residences are almost negligible – so it is easy to see why people would rather pick the newer plus freehold development.
Kovan Melody 3 bedroom 1,302 sqft $1.5 million
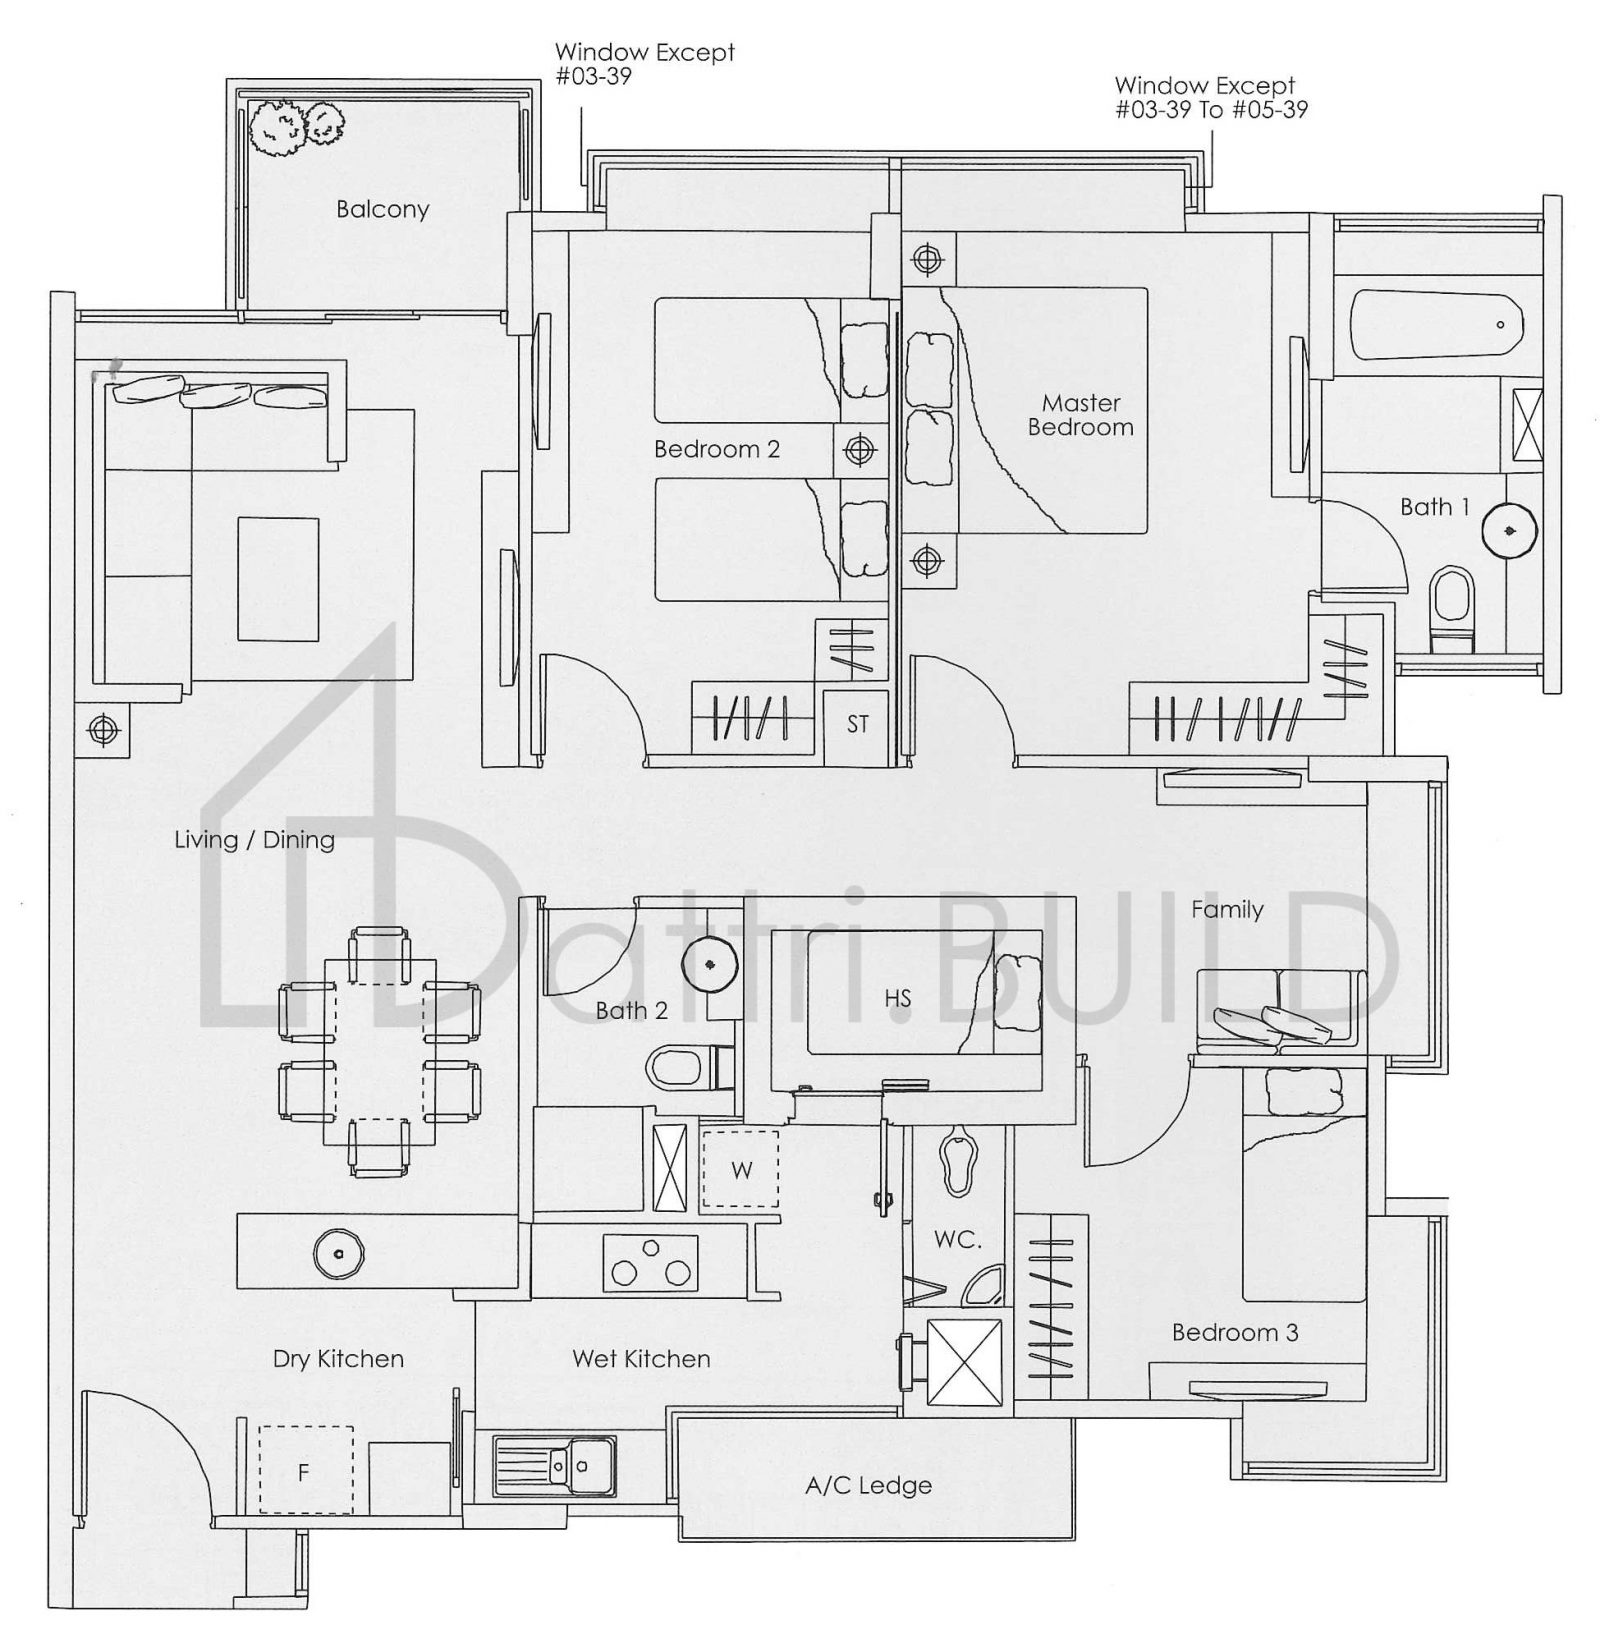
It’s a similar story with the Kovan Melody. It is the biggest of the bunch at 1,302 square feet, but it does still feature bay windows with all the bedrooms – which is really unnecessary wasted space.
That said, it isn’t as pronounced as the Kovan Residences, and its additional space does mean that it has an additional family area as well. The biggest downside? It is quite significantly older in age.
As you can see, a deeper understanding is required of the surrounding area and its competition. While this may not be the only reason for its performance, I do believe that many others who were looking at the Kovan area would have probably come to the same logical conclusion.
Final Words
Many people like to take the 2007 peaks as an example, but the truth is a lot has changed in the property market in Singapore since then.
Whether you like it or not, the cooling measures have played a major role in how prices have played out. As shown above, the timing of when you buy does not have much consequence – as long as you choose the right property.
What is certain is that there are many different factors that play a part in how a development will perform once it hits the resale market, you can never just isolate it down to one particular reason.
But out of all the factors that contribute to property appreciation, I always like to fall back to two main aspects:
Future prospects (supporting transformations to the area), and time in the market (not market timing).
Agree/disagree with the above? Feel free to leave a comment below, or you can reach me at stories@stackedhomes.com
At Stacked, we like to look beyond the headlines and surface-level numbers, and focus on how things play out in the real world.
If you’d like to discuss how this applies to your own circumstances, you can reach out for a one-to-one consultation here.
And if you simply have a question or want to share a thought, feel free to write to us at stories@stackedhomes.com — we read every message.
Sean Goh
Sean has a writing experience of 3 years and is currently with Stacked Homes focused on general property research, helping to pen articles focused on condos. In his free time, he enjoys photography and coffee tasting.Read next from Property Market Commentary
Property Market Commentary Why Looking at Average HDB Prices No Longer Tells the Full Story: A New Series

Property Market Commentary We Analyse “Safer” Resale Condos in Singapore to See If They’re Actually Worth Buying: A New Series
Property Market Commentary Why 2026 May Be a Good Year to Buy an EC — With an Important Caveat

Property Market Commentary How Much You Need to Earn to Afford a One or Two-Bedder Condo In 2026 (As a Single)
Latest Posts
Singapore Property News One Segment of the Singapore Property Market Is Still Climbing — Even as the Rest Slowed in 2025

Singapore Property News Why The Rising Number Of Property Agents In 2026 Doesn’t Tell The Full Story
New Launch Condo Analysis This New Dairy Farm Condo Starts From $998K — How the Pricing Compares

Homeowner Stories We Could Walk Away With $460,000 In Cash From Our EC. Here’s Why We Didn’t Upgrade.

On The Market Here Are The Cheapest Newer 3-Bedroom Condos You Can Still Buy Under $1.7M
Singapore Property News Why Buying Or Refinancing Your Home Makes More Sense In 2026

New Launch Condo Reviews Narra Residences Review: A New Condo in Dairy Farm Priced Close To An EC From $1,930 PSF
Singapore Property News This Latest $962 PSF Land Bid May Push Dairy Farm Homes Past $2,300 PSF — Here’s Why
On The Market Orchard Road’s Most Unlikely $250 Million Property Is Finally Up for Sale — After 20 Years
Overseas Property Investing What $940,000 Buys You in Penang Today — Inside a New Freehold Landed Estate

Singapore Property News One of Singapore’s Biggest Property Agencies Just Got Censured
New Launch Condo Analysis This New Freehold CBD Condo Starts From $1.29M — Here’s How the Pricing Compares
Singapore Property News Over 3,500 People Visit Narra Residences During First Preview Weekend
Editor's Pick 66% of Units at Coastal Cabana Sold at End of First Sales Day, Prices Average $1,734 psf

Editor's Pick Newport Residences Review: Rare Freehold Development in the CBD with Panoramic Sea Views from $3,012 psf


Hi Sean, I am new to buying/investing SG properties. Agents always tell us districts 9, 10, 11 freehold properties would do well in up or down market. Yet I see your examples above, Leedon Residence and The Trizon, both in CCR and freehold, sold for losses. As you mentioned, picking the right property makes the most difference. Was there anything wrong with those two properties that their prices took a dive despite being freehold and in CCR? Thank you.
Hey KK Huang, thanks for your comment. It’s not always true that 9, 10 and 11 freehold properties would do well in an up or down market. The properties here are good in holding their pricing given their locale. It’s hard to generalise a claim that properties with certain attributes would do well – though ‘doing well’ is quite a broad term. We’ve looked at the transactions in the aforementioned condos and do see that there are profitable transactions here too, so it’s not absolutely loss-making. But if we look at CCR (aside from the Bugis area), the performance pales in comparison to condos in the outside of central region area since CCR is quite developed already.
This is a flawed analysis. Just because there are no loss making transactions doesn’t mean those owners who are holding on to their units aren’t making a loss if they sell now. They just won’t sell, so it doesn’t show up as a loss making transaction. They’re just stuck.
Hi, thanks for your comment. Yes we are aware of this point, but likewise they could be making paper profits but it doesn’t show up either. The analysis was just based on the last peak so these are all the numbers we can work with at this point.
Thanks Sean for the great article. Do you have any opinions on condos in the East coast parkway stretch like Amber, Meyer, Siglap areas? Many new launches like Seaside residences, Meyer Mansion, Amber park have broken price records, do you think this area is at high risk of price correction? Would love to see you or other stackedhome writers analyze the condos along ECP.
Hey Ming! Thanks for your question. D15 area has seen the gap being considerably wide between the older resale condos in the area and new launches, so we wouldn’t say this is out of the norm. Given the upcoming TEL there, we can see why prices are as such at the moment too.
hi sean, im looking to purchase a 1 bedder at eight riversuites or nearby location/down the road. Prices for Kovan area is currently higher even tho it is slightly further. I am considering for either own stay or rental. What do u think of riversuits? does the view and facing matters as i am looking for more capital upside for sure.
Hi, what if you add Kovan Regency into the discussion? What do you feel about this development, able to share more?
Hi Sean, love your analysis! Anyway, can you do a comparison between Q Bay Residences & The Santorini (2 bed / 3 bed) in today’s market situation considering the surrounding existing projects and new launches (since these projects were launched at the peak of the property cycle)? Would love to know your views on the value of these 2 projects. Thanks!
Hey Teddy! Yes sure – we’ll take a look at these 2 and get back to you
Hi Sean,
Good analysis and thanks for all your fabulous work on these useful articles. Your article is an eye opener and I agree with you to a large extent; that the property matters more than the time in the market. However, I think the risk of people buying at the peak is that when they want to exit, chances of making a loss is much higher and owners are stuck with their purchase not willing to take a loss.