


We might be a little over-reliant on visuals, when it comes to property info.
Recently, I came across a comment about some HDB-provided updates. This was on the topic of flat availability; a topic that, as most Singaporeans know, is only slightly less incendiary than playing with blowtorches in a fireworks factory:
They themselves published it and try to phrase it as a good thing
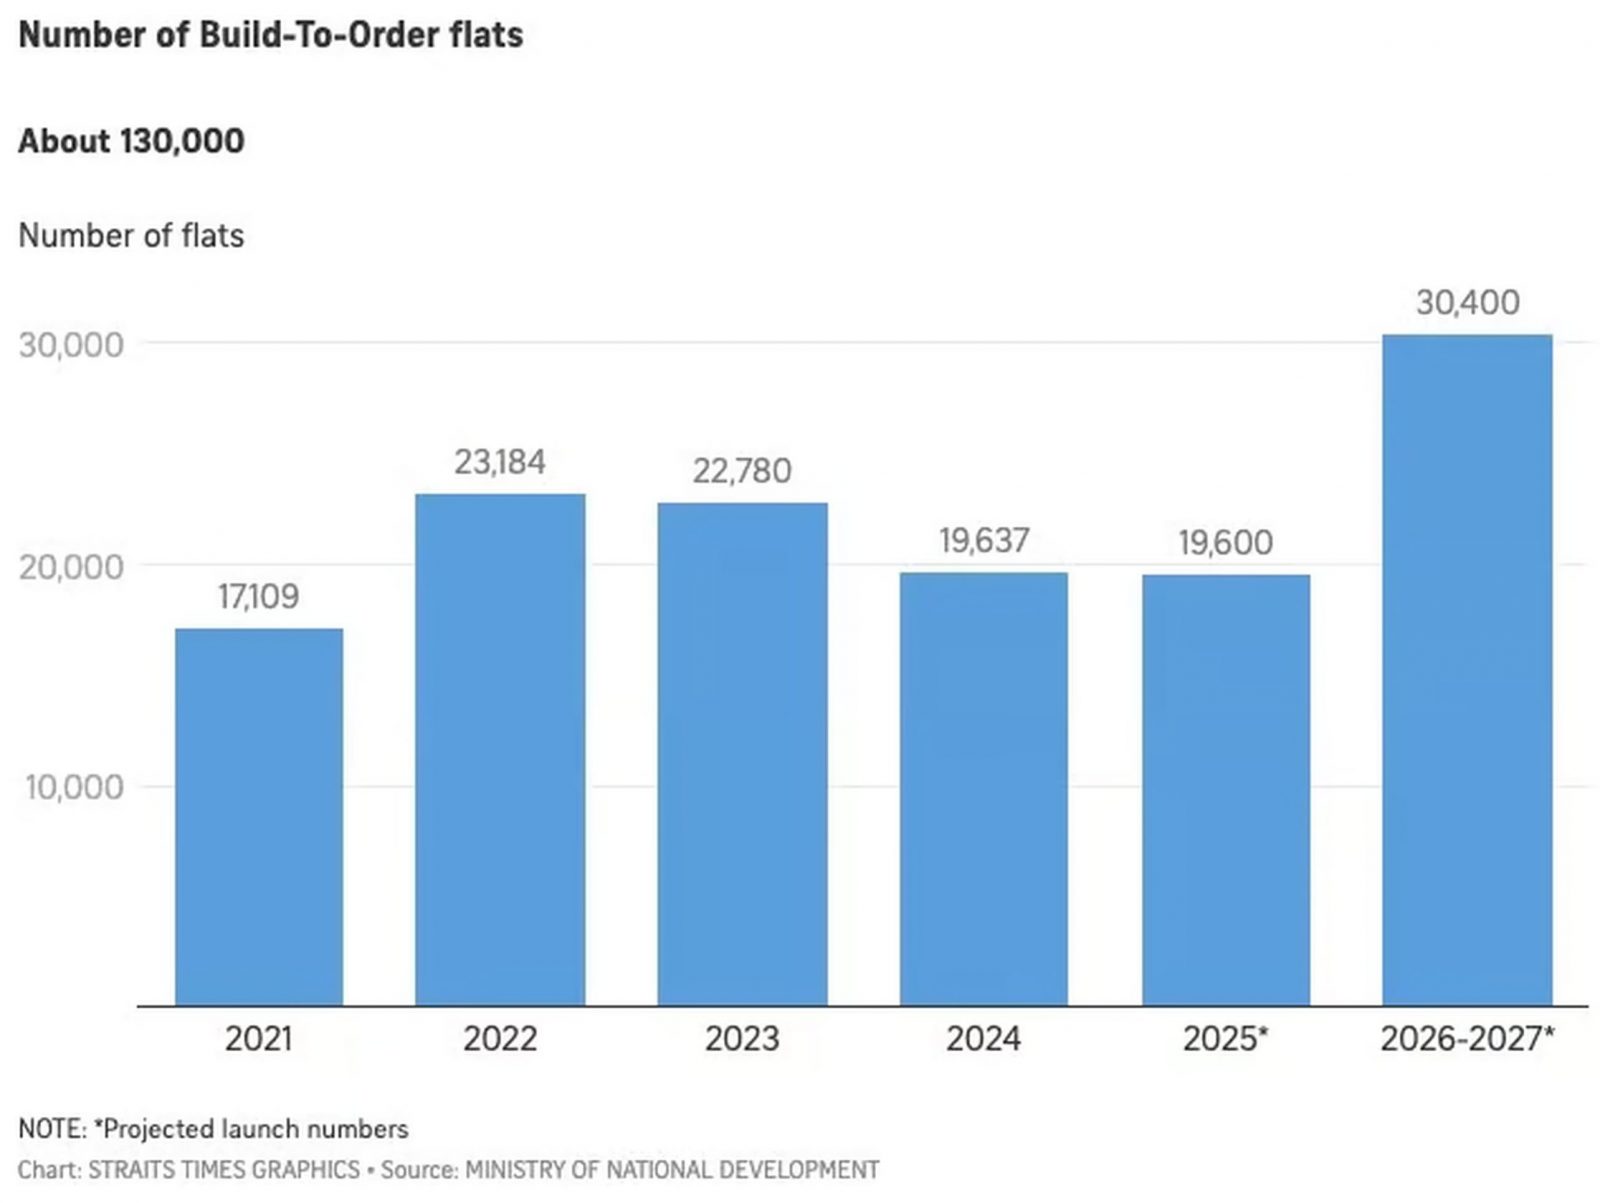
Look at the stupid chart in the article. Each bar from 2021 to 2025 is the yearly launch amount, which is ~20k. Then the last bar, which jumps to 30k flats, looks like such a big improvement! MND is doing something! But when you look down, that bar is for the combined launch from 2026 to 2027 lmao.
From their wording it’s the same story. 100k for 2021 to 2025, 5 years 20k per year. Then new statement is 50k for 2025 to 2027. 2025 is included to mask the decrease in 2026/2027.
They really think they 在骗小孩, using these stupid merhods to try to mask the decrease in supply and keep harping about an increase in supply to meet demand. Yet even the 20k per year is an increase in supply narrative is bullshit. This shit has been said since 2021 and demand has only grown since with no further adjustment to flat supply. Now they are decreasing it because clearly all the cooling measures are working amazingly and demand is down by at least 25%.
Source /u/MemekExpander/ (Reddit)
Here’s the chart that sparked such a reaction:
Now my point here isn’t to argue if HDB is raising its supply by as much as perceived (if you want the actual statement, it’s here). Rather, it’s that maybe this Redditor has hit upon an interesting habit of ours.
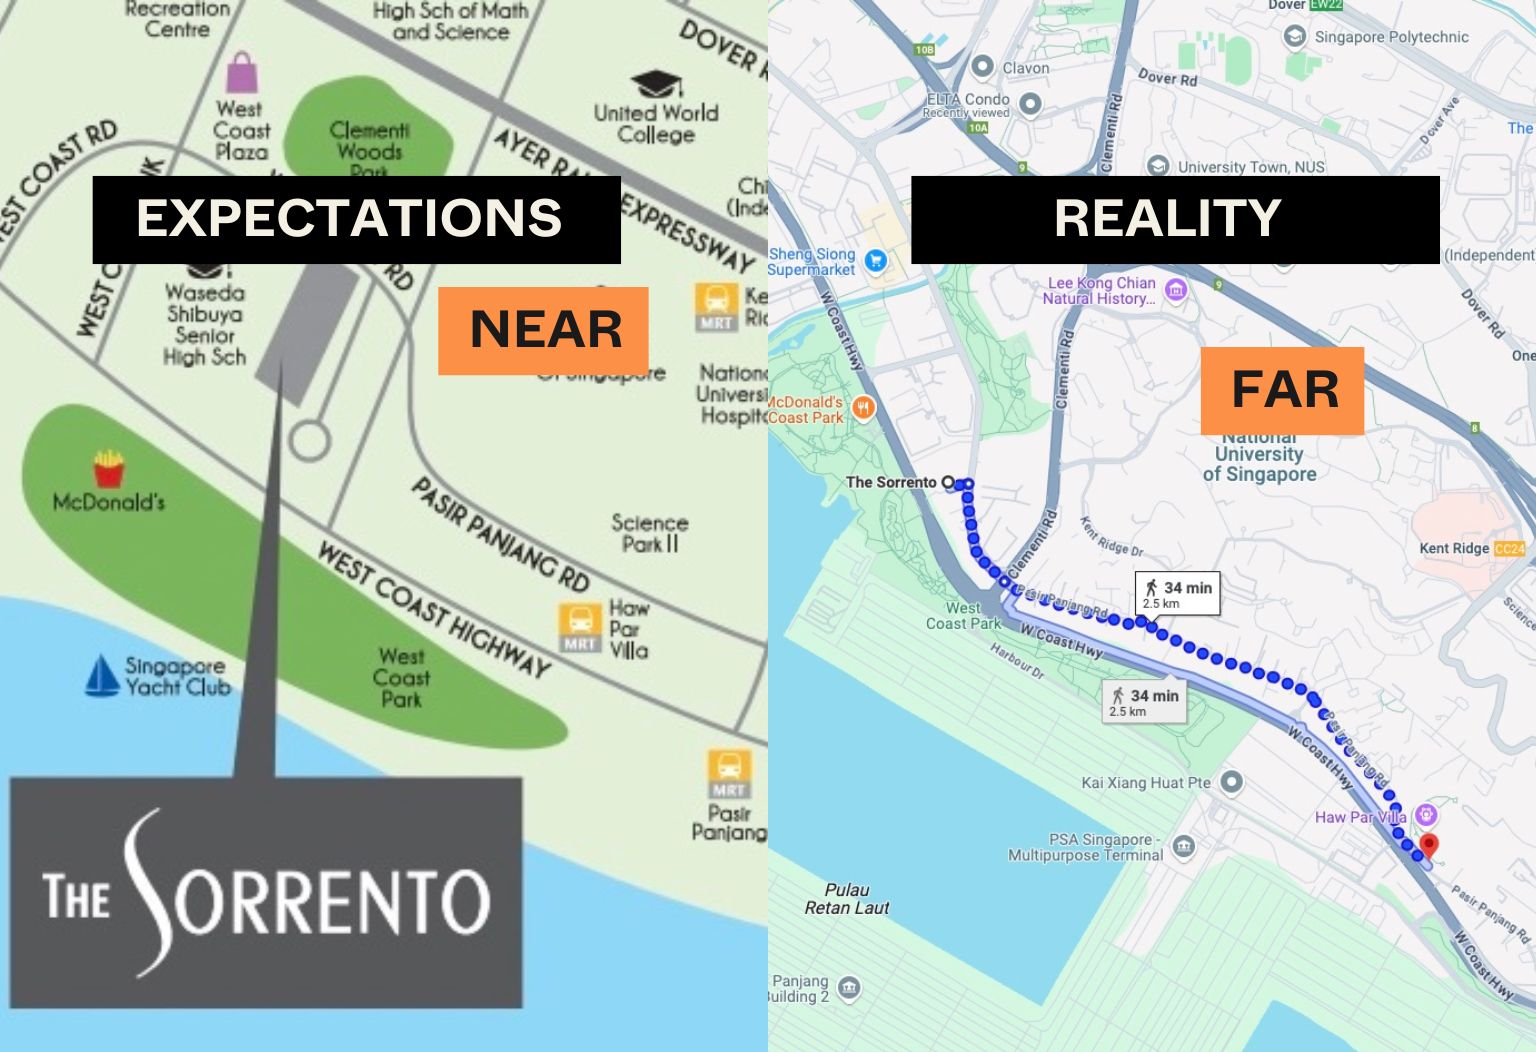
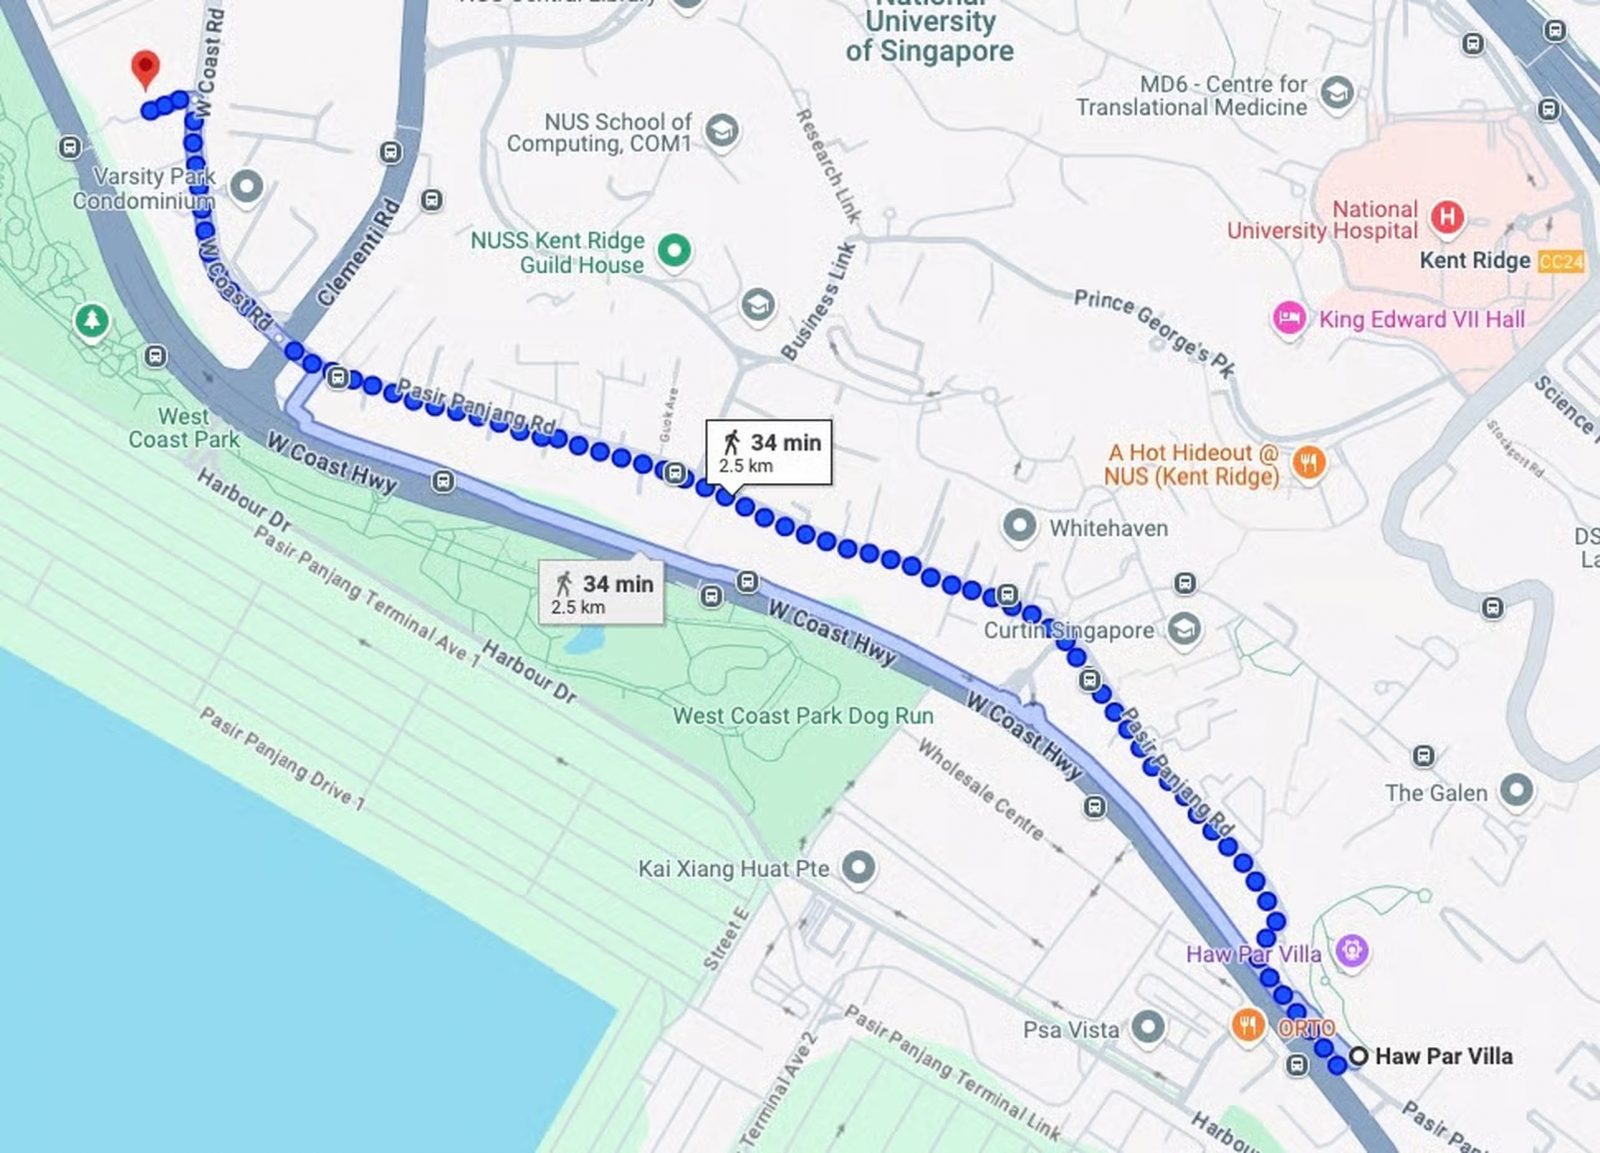
Singaporean property buyers tend to look at charts, graphs, and illustrations as a purely visual element; and that sometimes causes unreliable mental shortcuts. You’re probably already familiar with maps in brochures, like this one:

The map highlights several MRT stations like Haw Par Villa, Kent Ridge and Pasir Panjang, suggesting convenient access to public transport. But distances on these maps are often visually compressed. If you’re going purely by first glance, it looks like you could walk to Haw Par Villa in about 10 minutes, but the reality is more like 35:
We can chalk it up to artistic license and marketing; but the same trick is sometimes used in reports, predictions, etc. One example of this is changing the numbers on an axis.
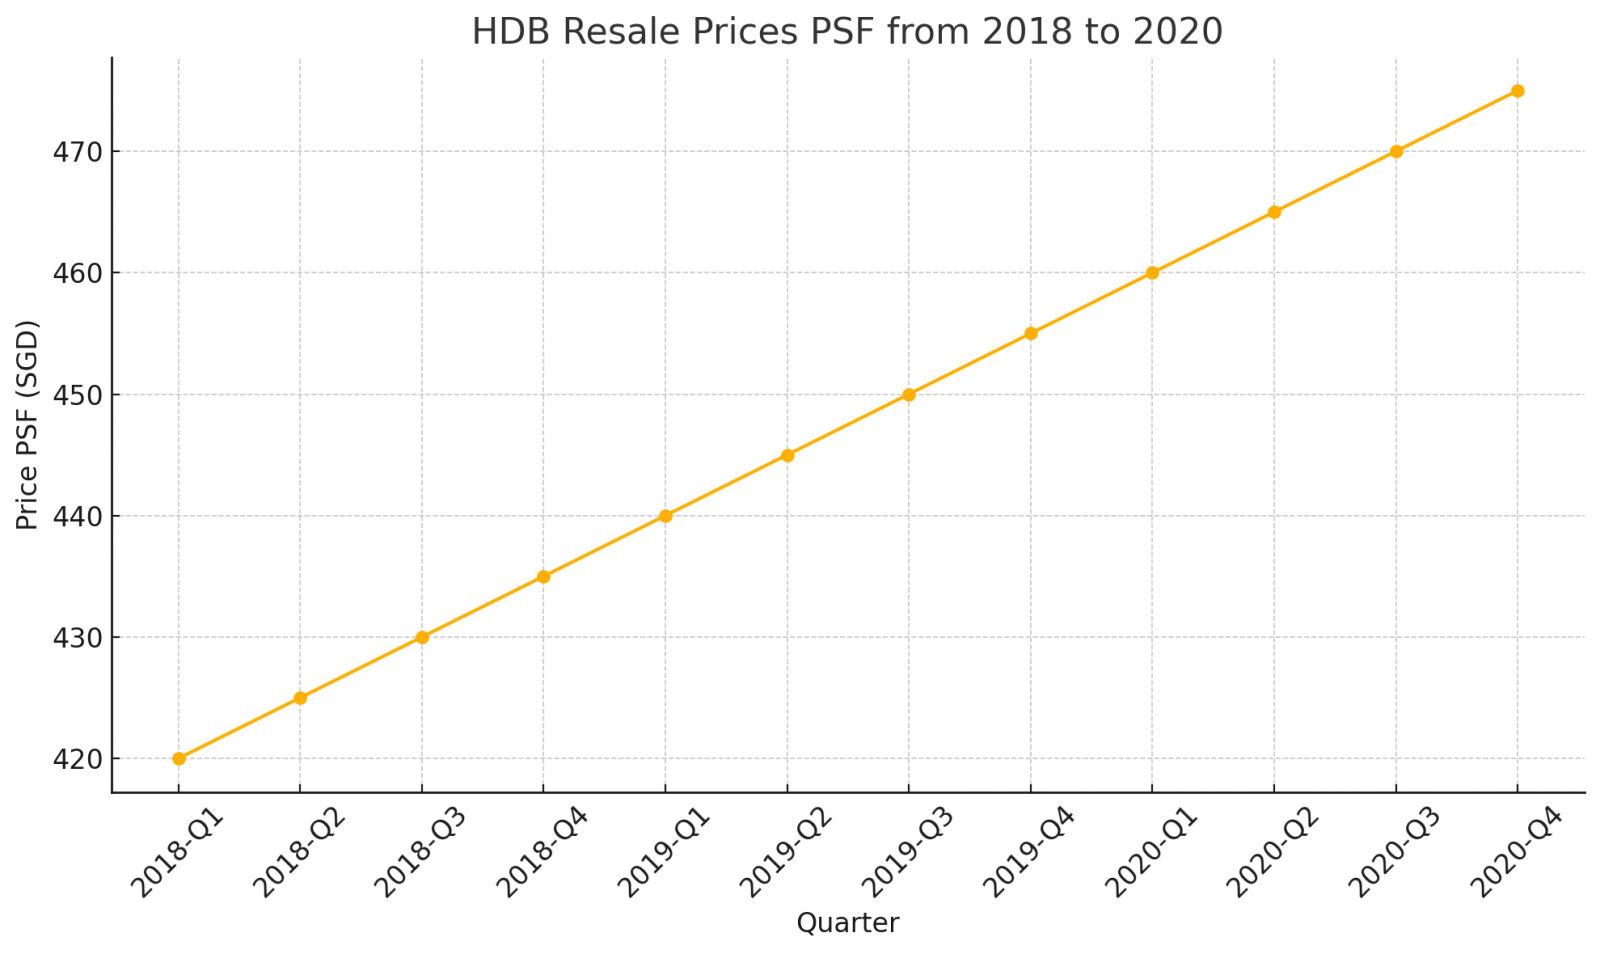
Let’s say, for instance, I want to create the narrative that HDB resale prices are going up too fast. I could use a graph that looks like this:
Or I could use a graph that looks like this:
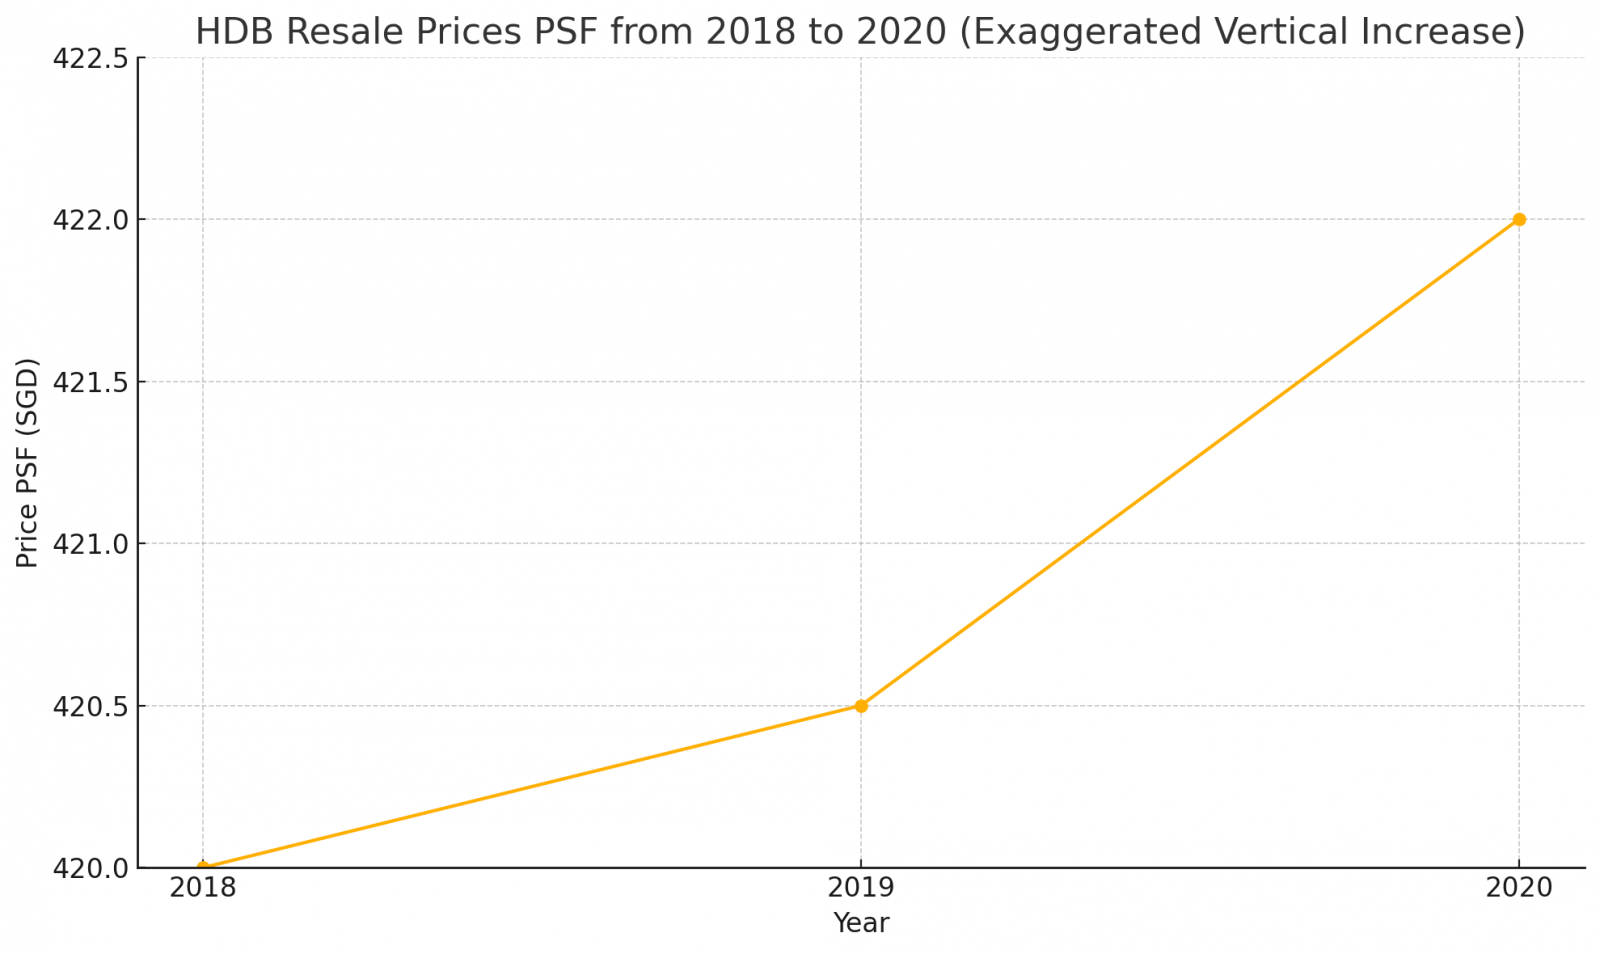
It’s the same information; but the second one would suit the narrative better, in a sneaky, deceitful kind of way. It’s a bit like how a slow-selling project might express an increase from a measly five sales, to a measly nine sales, by calling it an “80 per cent increase in transaction volume.”
Seeing graphs, charts, maps, percentages, etc. tends to lull us into a false sense of security. There’s an instinctive leap that, if someone is showing us that, the information must be more concrete and verified.
But keep in mind that, even if the numbers are still accurate, that doesn’t mean these illustrations can’t be used to paint a biased picture.
News pieces like this explain what's happening in the market. Our consultations are designed to help you understand what it means for your own property decisions.
If you're considering buying, selling or upgrading, we'd be happy to help you work through your options.
Also of interest this week, CCR revival plans
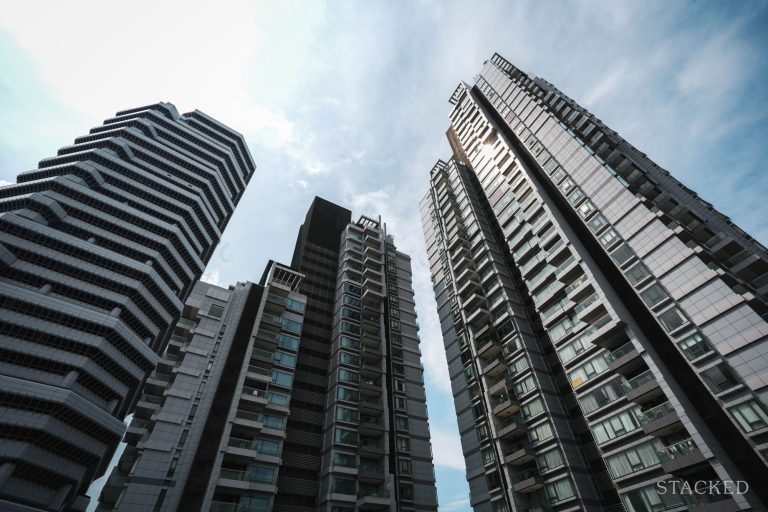
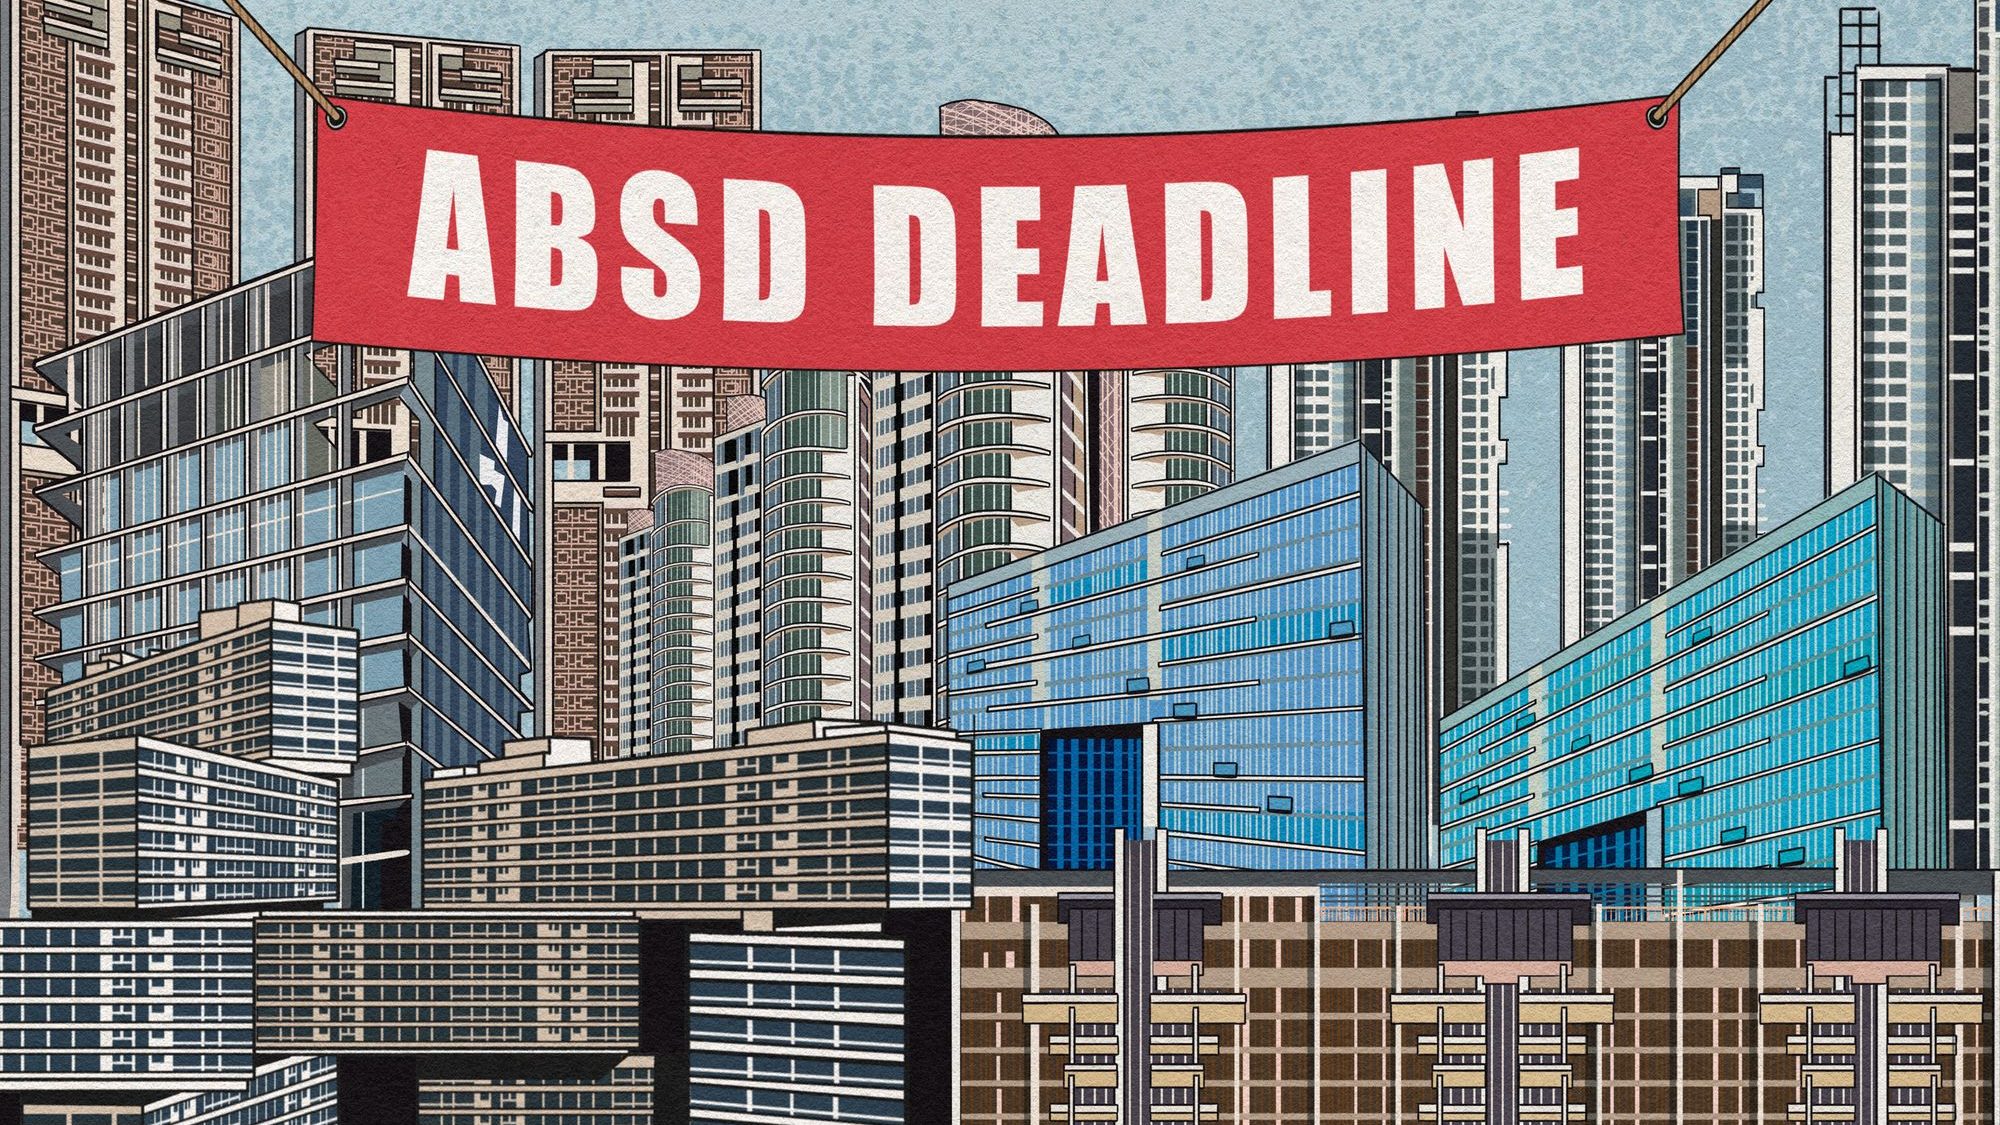
The Core Central Region (CCR) took an absolute pounding after new ABSD rate hikes. It remains to be seen if, even with an ongoing trade war, foreigners will consider it worth the 60 per cent ABSD to buy a luxury property.
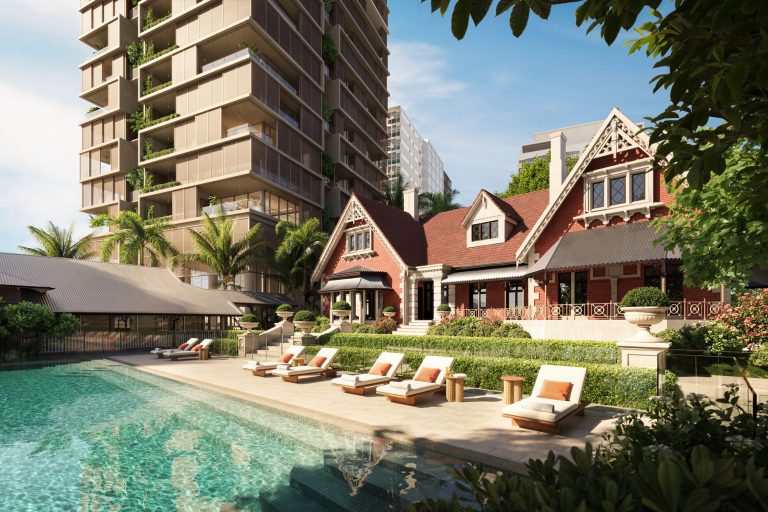
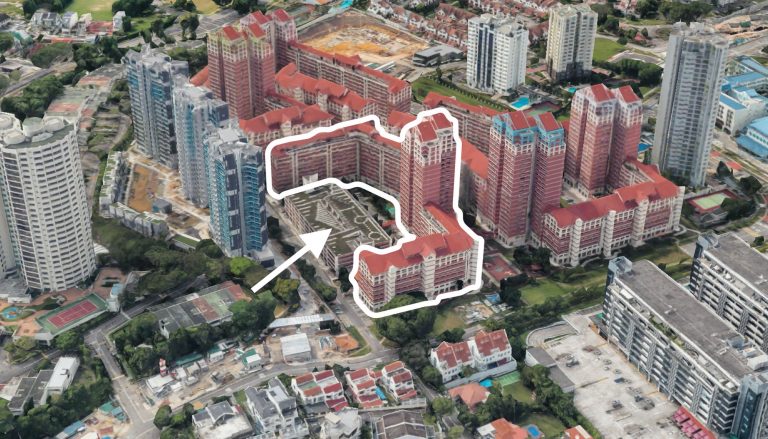
But on the flip side, a lot of news is about the CCR these days. Aurea (the re-developed Golden Mile) is coming up for grabs, as is Marina View; then there are multiple plots at River Valley, and more. Given that CCR prices are a bit muted still, the new launches and resale units here may represent an opportunity. So while the old assumption is that Singaporeans don’t reside in the heart of their city (who can afford condos in Orchard, Tanglin, etc.?) there may be a change in the air.
This is also in line with URA’s attempts to rejuvenate the central area. So rather than having a district that’s just branded malls, or a district that’s dead outside the work days, we’re going for all-rounded areas: a balance of community areas, event spaces, a mix of cheaper and pricier amenities, etc. This could redefine areas like Orchard or the CBD in the years to come, making them more than just clusters of expensive rental assets (or high net worth foreigners).
Imagine that, Anson Road packed with partygoers on a Saturday afternoon.
It’s not going to be easy to pull off though, given that heartland hubs like Clementi, Jurong East, Paya Lebar, etc. seem to have already accomplished this. And how many of us want to travel the extra distance to, say, Orchard or Chinatown, when there’s so much within walking distance?
Meanwhile in other property news…
- Are condos above 1,200 sq.ft. still possible, from $1.5 million? There are not many options, but we found some anyway.
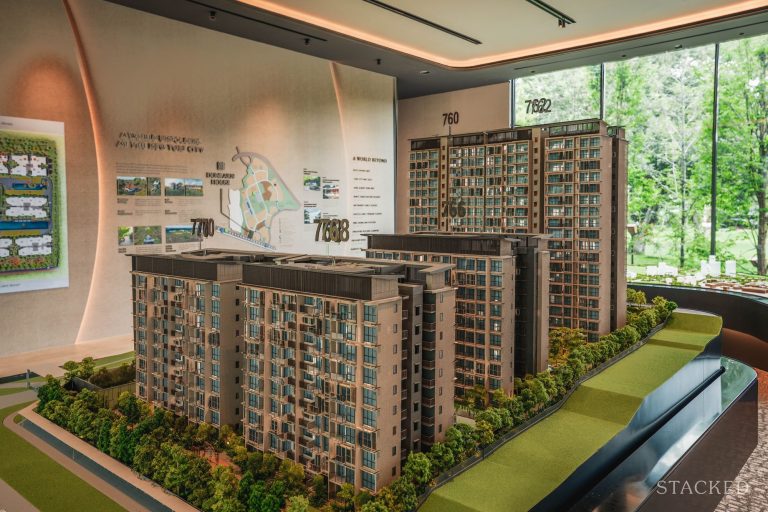
- Parktown Residence adds some much-needed amenities to the still-developing Tampines North area. But is this integrated development worth buying, compared to others?
- The July 2025 BTO launch sites are up, and here’s our take on what’s on offer.
- Is it still possible for some Singaporeans to upgrade to a condo by age 35? In an earlier time, it was much easier. These days…well, see for yourself.
Weekly Sales Roundup (03 February – 09 February)
Top 5 Most Expensive New Sales (By Project)
| PROJECT NAME | PRICE S$ | AREA (SQFT) | $PSF | TENURE |
| ONE BERNAM | $12,000,000 | 4306 | $2,787 | 99 yrs (2019) |
| WATTEN HOUSE | $5,084,000 | 1539 | $3,303 | FH |
| THE RESERVE RESIDENCES | $5,019,000 | 1894 | $2,649 | 99 yrs (2021) |
| PINETREE HILL | $3,973,900 | 1464 | $2,715 | 99 yrs (2022) |
| NAVA GROVE | $3,732,700 | 1550 | $2,408 | 99 yrs (2024) |
Top 5 Cheapest New Sales (By Project)
| PROJECT NAME | PRICE S$ | AREA (SQFT) | $PSF | TENURE |
| SORA | $1,565,000 | 667 | $2,345 | 99 yrs (2023) |
| PINETREE HILL | $1,820,000 | 850 | $2,140 | 99 yrs (2022) |
| BAGNALL HAUS | $1,832,000 | 753 | $2,431 | FH |
| THE CONTINUUM | $1,897,000 | 667 | $2,843 | FH |
| HILLHAVEN | $2,047,144 | 947 | $2,161 | 99 yrs (2023) |
Top 5 Most Expensive Resale
| PROJECT NAME | PRICE S$ | AREA (SQFT) | $PSF | TENURE |
| CLUNY PARK RESIDENCE | $8,240,000 | 2842 | $2,900 | FH |
| NASSIM 9 | $7,500,000 | 2486 | $3,016 | FH |
| ARDMORE II | $6,850,000 | 2024 | $3,385 | FH |
| CAPE ROYALE | $5,924,000 | 2508 | $2,362 | 99 yrs (2008) |
| THE DRAYCOTT | $5,400,000 | 2637 | $2,048 | FH |
Top 5 Cheapest Resale
| PROJECT NAME | PRICE S$ | AREA (SQFT) | $PSF | TENURE |
| RANGOON 88 | $733,888 | 441 | $1,663 | FH |
| PARC KOMO | $760,000 | 452 | $1,681 | FH |
| GUILLEMARD SUITES | $760,000 | 517 | $1,471 | FH |
| EUHABITAT | $765,000 | 560 | $1,367 | 99 yrs (2010) |
| KINGSFORD HILLVIEW PEAK | $800,000 | 517 | $1,548 | 99 yrs (2012) |
Top 5 Biggest Winners
| PROJECT NAME | PRICE S$ | AREA (SQFT) | $PSF | RETURNS | HOLDING PERIOD |
| NASSIM 9 | $7,500,000 | 2486 | $3,016 | $3,420,000 | 19 Years |
| MOUNT FABER LODGE | $5,000,000 | 3703 | $1,350 | $3,400,000 | 24 Years |
| PALISADES | $4,000,000 | 3983 | $1,004 | $2,300,000 | 16 Years |
| ARDMORE II | $6,850,000 | 2024 | $3,385 | $2,128,015 | 18 Years |
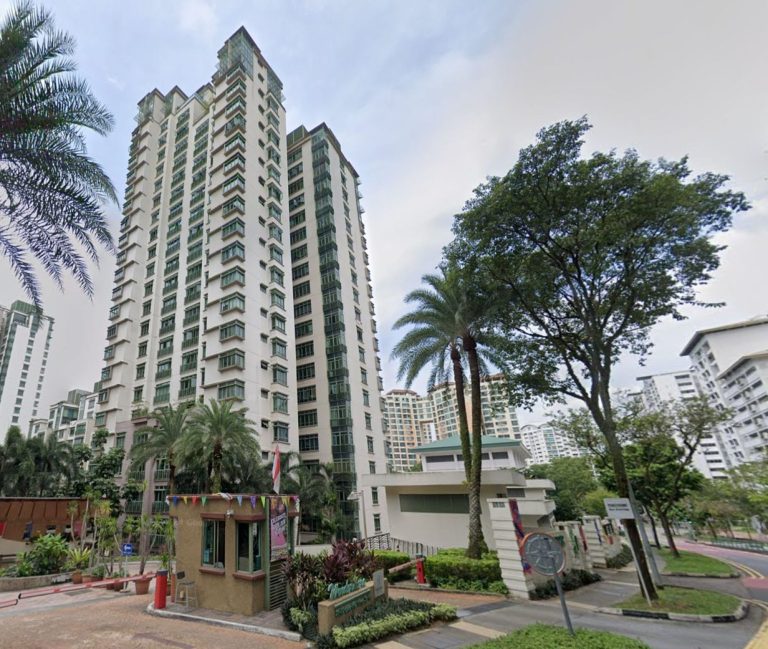
| AMARYLLIS VILLE | $2,650,000 | 1238 | $2,141 | $1,556,000 | 20 Years |
Top 5 Biggest Losers
| PROJECT NAME | PRICE S$ | AREA (SQFT) | $PSF | RETURNS | HOLDING PERIOD |
| VIDA | $1,040,000 | 527 | $1,972 | -$116,000 | 16 Years |
| ROBIN SUITES | $1,090,000 | 463 | $2,355 | -$40,000 | 9 Years |
| 35 GILSTEAD | $1,480,000 | 549 | $2,696 | -$8,000 | 6 Years |
| THE M | $1,200,000 | 495 | $2,424 | $26,900 | 5 Years |
| REFLECTIONS AT KEPPEL BAY | $2,490,000 | 1550 | $1,606 | $28,500 | 18 Years |
Transaction Breakdown

For more on the Singapore property market, follow us on Stacked!
A single headline is rarely enough to change your plans. The value comes from understanding how today’s news fits into the broader direction of the market.
If you’d like to talk through what a shift like this means for your own timing, purchase, or exit, you can reach out for a one-to-one consultation here.
And if you simply have a question or want to share a thought, feel free to write to us at stories@stackedhomes.com. We read every message.

0 Comments