


Back in the property heyday of 2013, foreigners were often denounced as the driving force behind inflation. But today, with Additional Buyers Stamp Duty (ABSD) for foreigners at 20 per cent, foreign ownerships are at a 17-year low (as of 2020).
But there have been recent pieces circulating around with headlines such as:
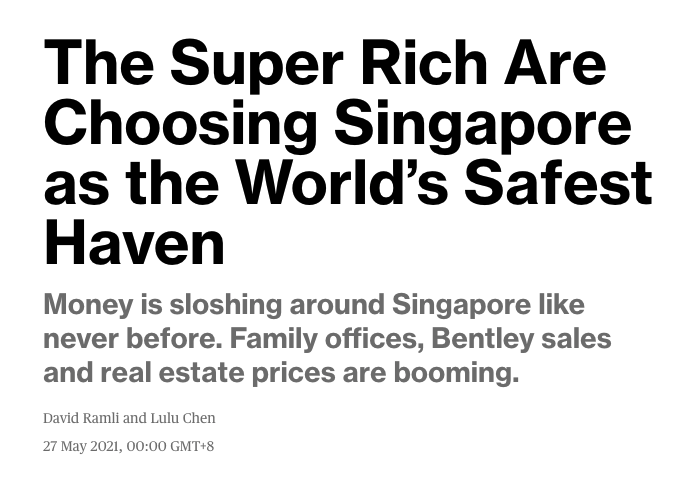
Or this:
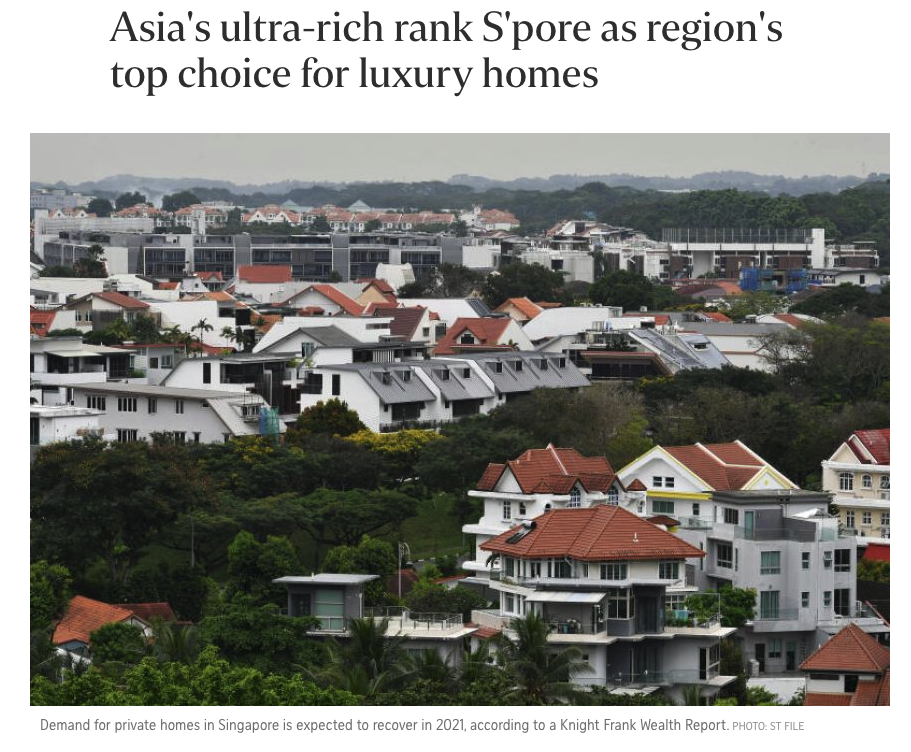
Which does seem contrary to what the numbers are showing. Still, it doesn’t stop home buyers and investors alike from wondering if foreigners will come back; bringing both potential buyers, and higher home prices. Here’s a look at the numbers:
What percentage of properties are bought by foreigners?
We’ve combed through private residential properties district-by-district, from 2010 to the present. Here’s the percentage of foreign owned properties we’ve found:
Historically, this is the most favoured region among foreign buyers. The CCR saw a boost from Chinese buyers in 2019, specifically in the luxury market. However, this has been in decline since the pandemic in 2020. Of course, do note that 2021 isn’t over as of yet, so things could yet change at the end of the year (there are more high-end launches coming up).
Note that the data is not available for District 6
| Year | District 1 | District 2 | District 9 | District 10 | District 11 |
| 2010 | 18% | 12% | 28% | 16% | 17% |
| 2011 | 36% | 13% | 36% | 21% | 23% |
| 2012 | 20% | 11% | 18% | 8% | 12% |
| 2013 | 29% | 10% | 21% | 15% | 10% |
| 2014 | 22% | 23% | 19% | 9% | 11% |
| 2015 | 28% | 13% | 14% | 13% | 7% |
| 2016 | 21% | 15% | 11% | 6% | 4% |
| 2017 | 20% | 6% | 11% | 6% | 6% |
| 2018 | 31% | 10% | 14% | 6% | 3% |
| 2019 | 37% | 8% | 17% | 14% | 5% |
| 2020 | 22% | 13% | 13% | 9% | 3% |
| 2021 | 9% | 14% | 4% | 9% | 9% |
Rest of Central Region (RCR)
Long favoured by landlords, the RCR combines a lower quantum, with a still-high degree of rentability. A wide range of expatriate workers tend to rent in this area: rental rates are not as exorbitant as the CCR, but the difference in travel time is mere minutes. As of end-2020, the RCR seemed like a leading prospect for those emphasising rental strategies.
| Year | District 3 | District 4 | District 5 | District 7 | District 8 | District 12 | District 13 | District 14 | District 15 | District 20 |
| 2010 | 21% | 22% | 11% | 14% | 21% | 12% | 4% | 6% | 11% | 8% |
| 2011 | 30% | 26% | 14% | 30% | 24% | 21% | 6% | 19% | 16% | 18% |
| 2012 | 10% | 12% | 6% | 14% | 10% | 9% | 11% | 5% | 4% | 9% |
| 2013 | 9% | 13% | 5% | 14% | 14% | 14% | 7% | 7% | 8% | 7% |
| 2014 | 10% | 16% | 6% | 14% | 9% | 11% | 13% | 6% | 6% | 5% |
| 2015 | 11% | 14% | 7% | 19% | 7% | 7% | 3% | 6% | 4% | 4% |
| 2016 | 7% | 8% | 5% | 7% | 19% | 5% | 4% | 4% | 5% | 2% |
| 2017 | 10% | 10% | 4% | 9% | 15% | 6% | 4% | 4% | 4% | 2% |
| 2018 | 7% | 11% | 2% | 24% | 4% | 6% | 4% | 3% | 4% | 2% |
| 2019 | 6% | 10% | 5% | 24% | 6% | 3% | 7% | 4% | 4% | 3% |
| 2020 | 6% | 12% | 3% | 8% | 3% | 2% | 3% | 2% | 3% | 2% |
| 2021 | 6% | 4% | 5% | 0% | 5% | 1% | 3% | 3% | 3% | 1% |
Outside of Central Region (OCR)
While foreign owners are quite rare in the OCR, this is expected to change in the coming decades. This would be an outcome of Singapore’s gradual decentralisation, with business parks and tech hubs appearing in places like Changi Business City, the Punggol Digital District, and Woodlands Northshore. At present, the handful of foreign property owners in the OCR likely work near these hubs. However, there are also some foreigners who prefer the lifestyle differences (e.g., seafront living along East Coast beach, or near the Katong area).
| Year | District 16 | District 17 | District 18 | District 19 |
| 2010 | 9% | 3% | 7% | 5% |
| 2011 | 19% | 6% | 12% | 8% |
| 2012 | 7% | 2% | 3% | 3% |
| 2013 | 6% | 6% | 4% | 5% |
| 2014 | 11% | 4% | 6% | 7% |
| 2015 | 7% | 4% | 7% | 3% |
| 2016 | 6% | 6% | 3% | 3% |
| 2017 | 3% | 4% | 2% | 3% |
| 2018 | 4% | 3% | 4% | 3% |
| 2019 | 2% | 2% | 2% | 1% |
| 2020 | 1% | 1% | 2% | 1% |
| 2021 | 3% | 2% | 1% | 1% |
| Year | District 21 | District 22 | District 23 | District 25 | District 26 | District 27 | District 28 |
| 2010 | 10% | 9% | 8% | 6% | 6% | 4% | 2% |
| 2011 | 17% | 19% | 12% | 18% | 10% | 7% | 3% |
| 2012 | 6% | 5% | 6% | 4% | 2% | 2% | 2% |
| 2013 | 5% | 6% | 9% | 2% | 4% | 3% | 0% |
| 2014 | 4% | 7% | 8% | 3% | 0% | 2% | 8% |
| 2015 | 5% | 4% | 3% | 2% | 1% | 3% | 3% |
| 2016 | 5% | 4% | 2% | 0% | 3% | 3% | 0% |
| 2017 | 5% | 2% | 2% | 0% | 2% | 2% | 0% |
| 2018 | 1% | 7% | 4% | 6% | 2% | 3% | 1% |
| 2019 | 5% | 4% | 2% | 5% | 0% | 1% | 1% |
| 2020 | 3% | 3% | 1% | 3% | 1% | 0% | 1% |
| 2021 | 2% | 1% | 5% | 2% | 2% | 0% | 1% |
Overall patterns of foreign ownership from 2010 to the present
As of end-2020, the number of foreign buyers in the Singapore private property market was at a 17-year low. Only 742 properties were sold to foreigners in that year, which is the lowest point since 2013. This is unsurprising given we’re in the midst of a pandemic, and we don’t know how long this will go for (it’s much slower for transactions to take place, due to travel restrictions; and resale units are particularly hard to sell without viewings).
Regardless of the pandemic, realtors we spoke to felt the “killer moment” wasn’t Covid-19. Rather, it was the ABSD that was first passed in 2011, and then enhanced in coming years.
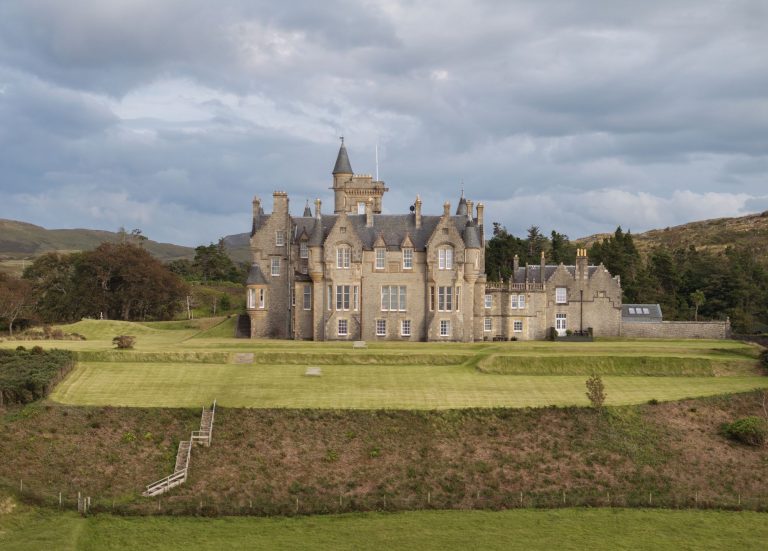
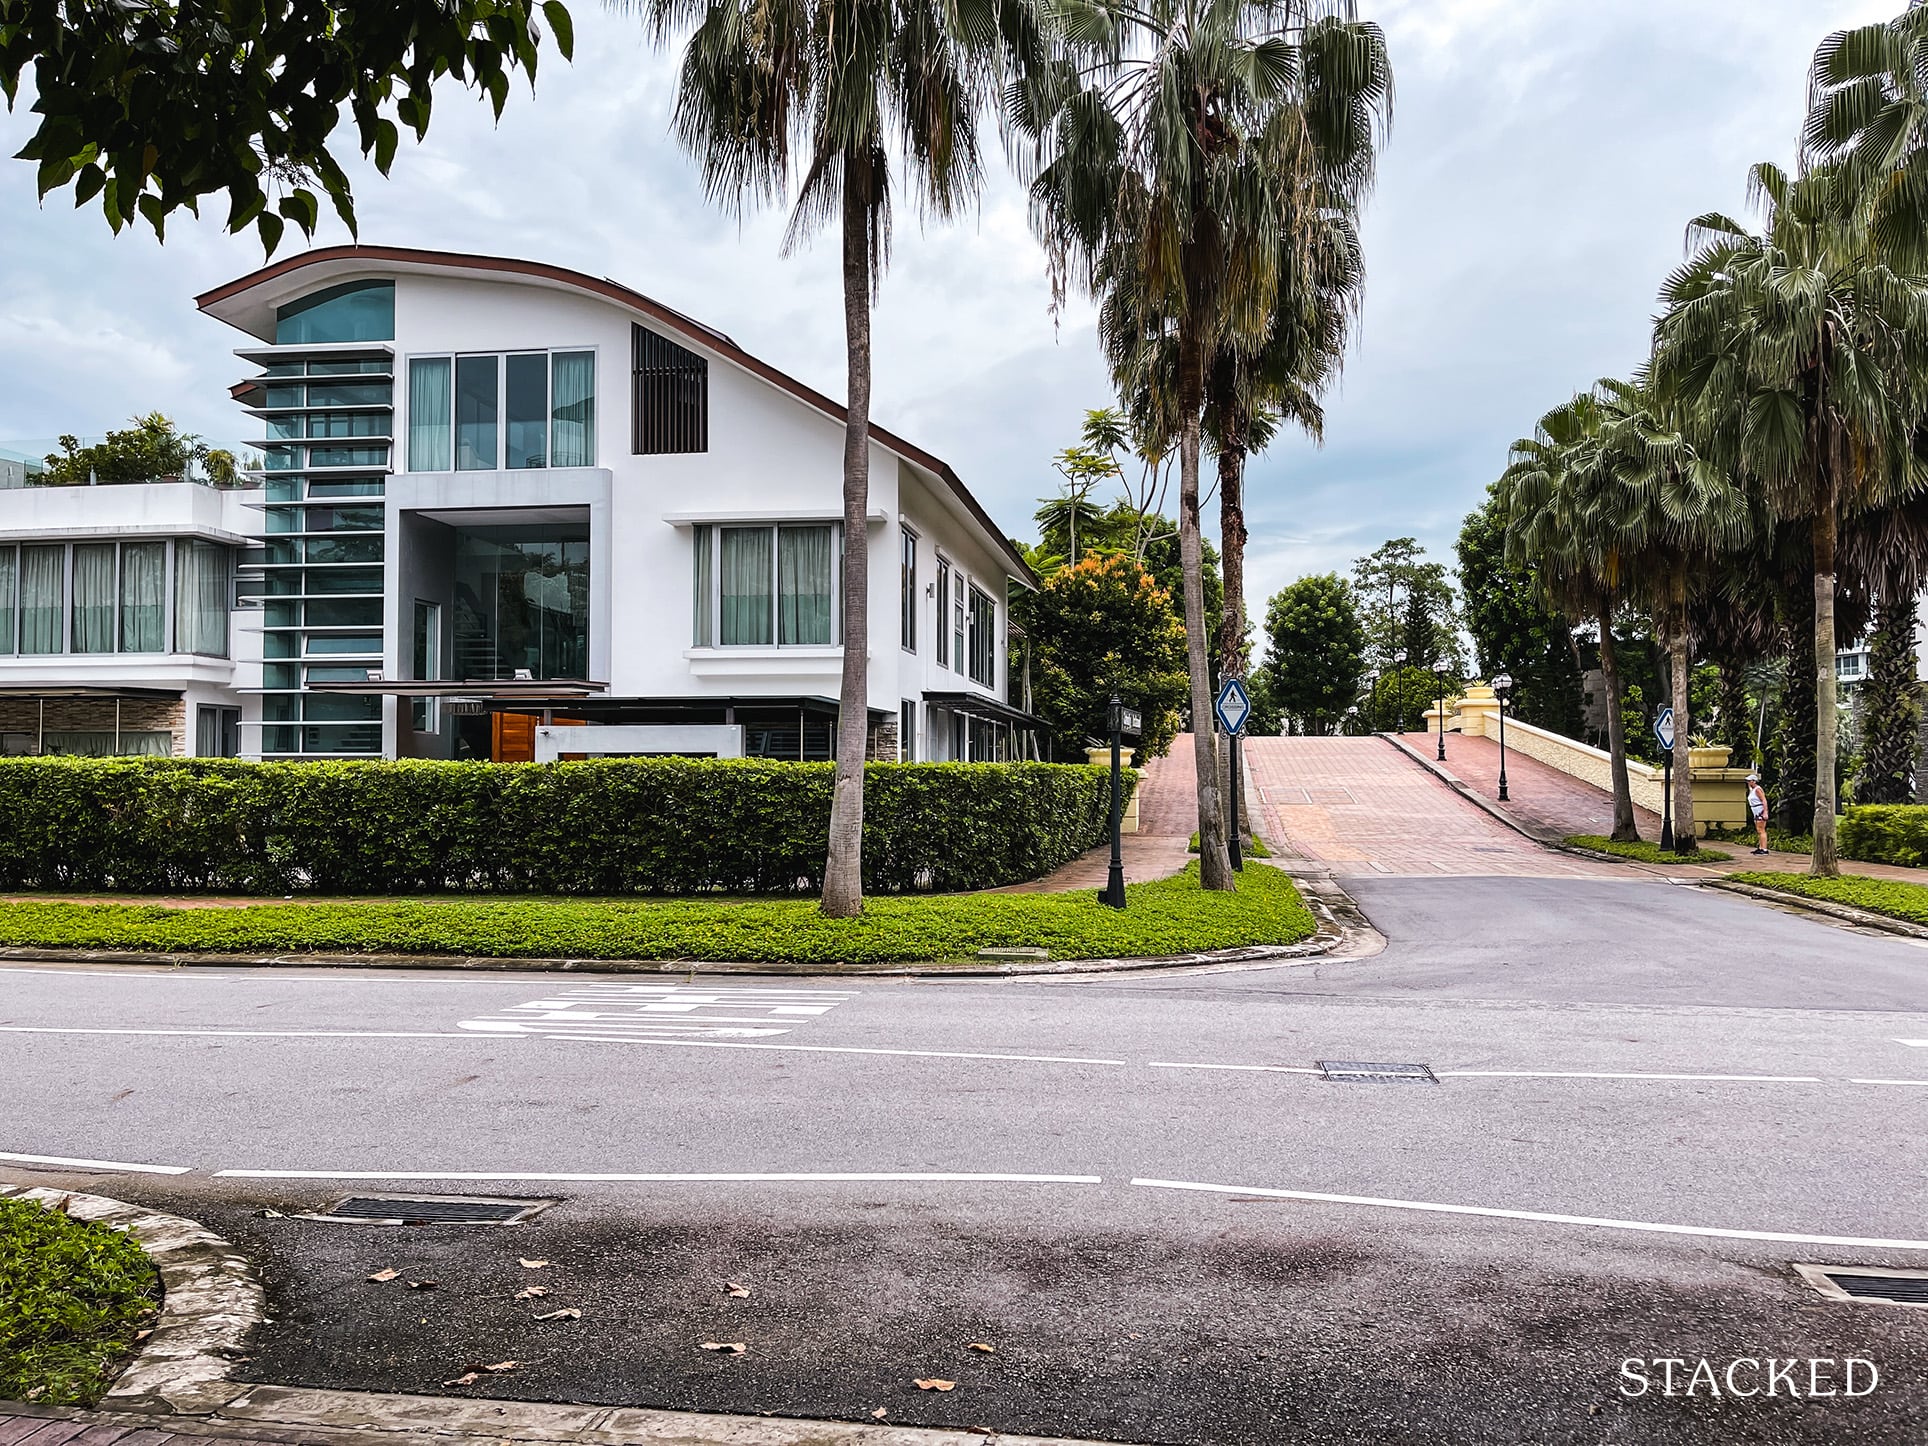
ABSD rates were first set at 10 per cent in 2011. By 2013, they had increased to 15 per cent. As of 2018, the rate was hiked again to 20 per cent. It’s not a coincidence that the timing matches the “lost decade” of Sentosa Cove:
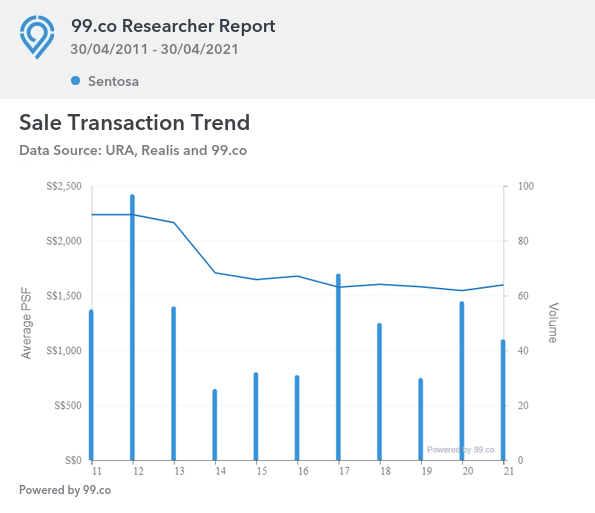
As Sentosa Cove is specifically targeted at foreign buyers, this is a good reflection of how hard the ABSD has struck. As of end-April 2021, prices on Sentosa averaged $1,596 psf, down from $2,239 psf a decade ago. The average home price here was over $9 million 2011, and today the average is $6.8 million.
Now Sentosa’s situation can’t be generalised for all of Singapore, as it’s a unique area (it’s also not a business hub, and appeals only to the very wealthiest buyers). But when even Ultra High Net Worth buyers are feeling the squeeze, it’s easy to understand how rough it’s gotten for other foreign buyers.
Which districts are holding up for foreign ownership?
Over the past decade, the percentage of foreign ownership has fallen by a significant amount. Even in the traditional foreigner favourites of Districts 9 (Orchard) and 10 (Tanglin, Holland V), the ratio of foreign ownership has almost halved over the past decade.
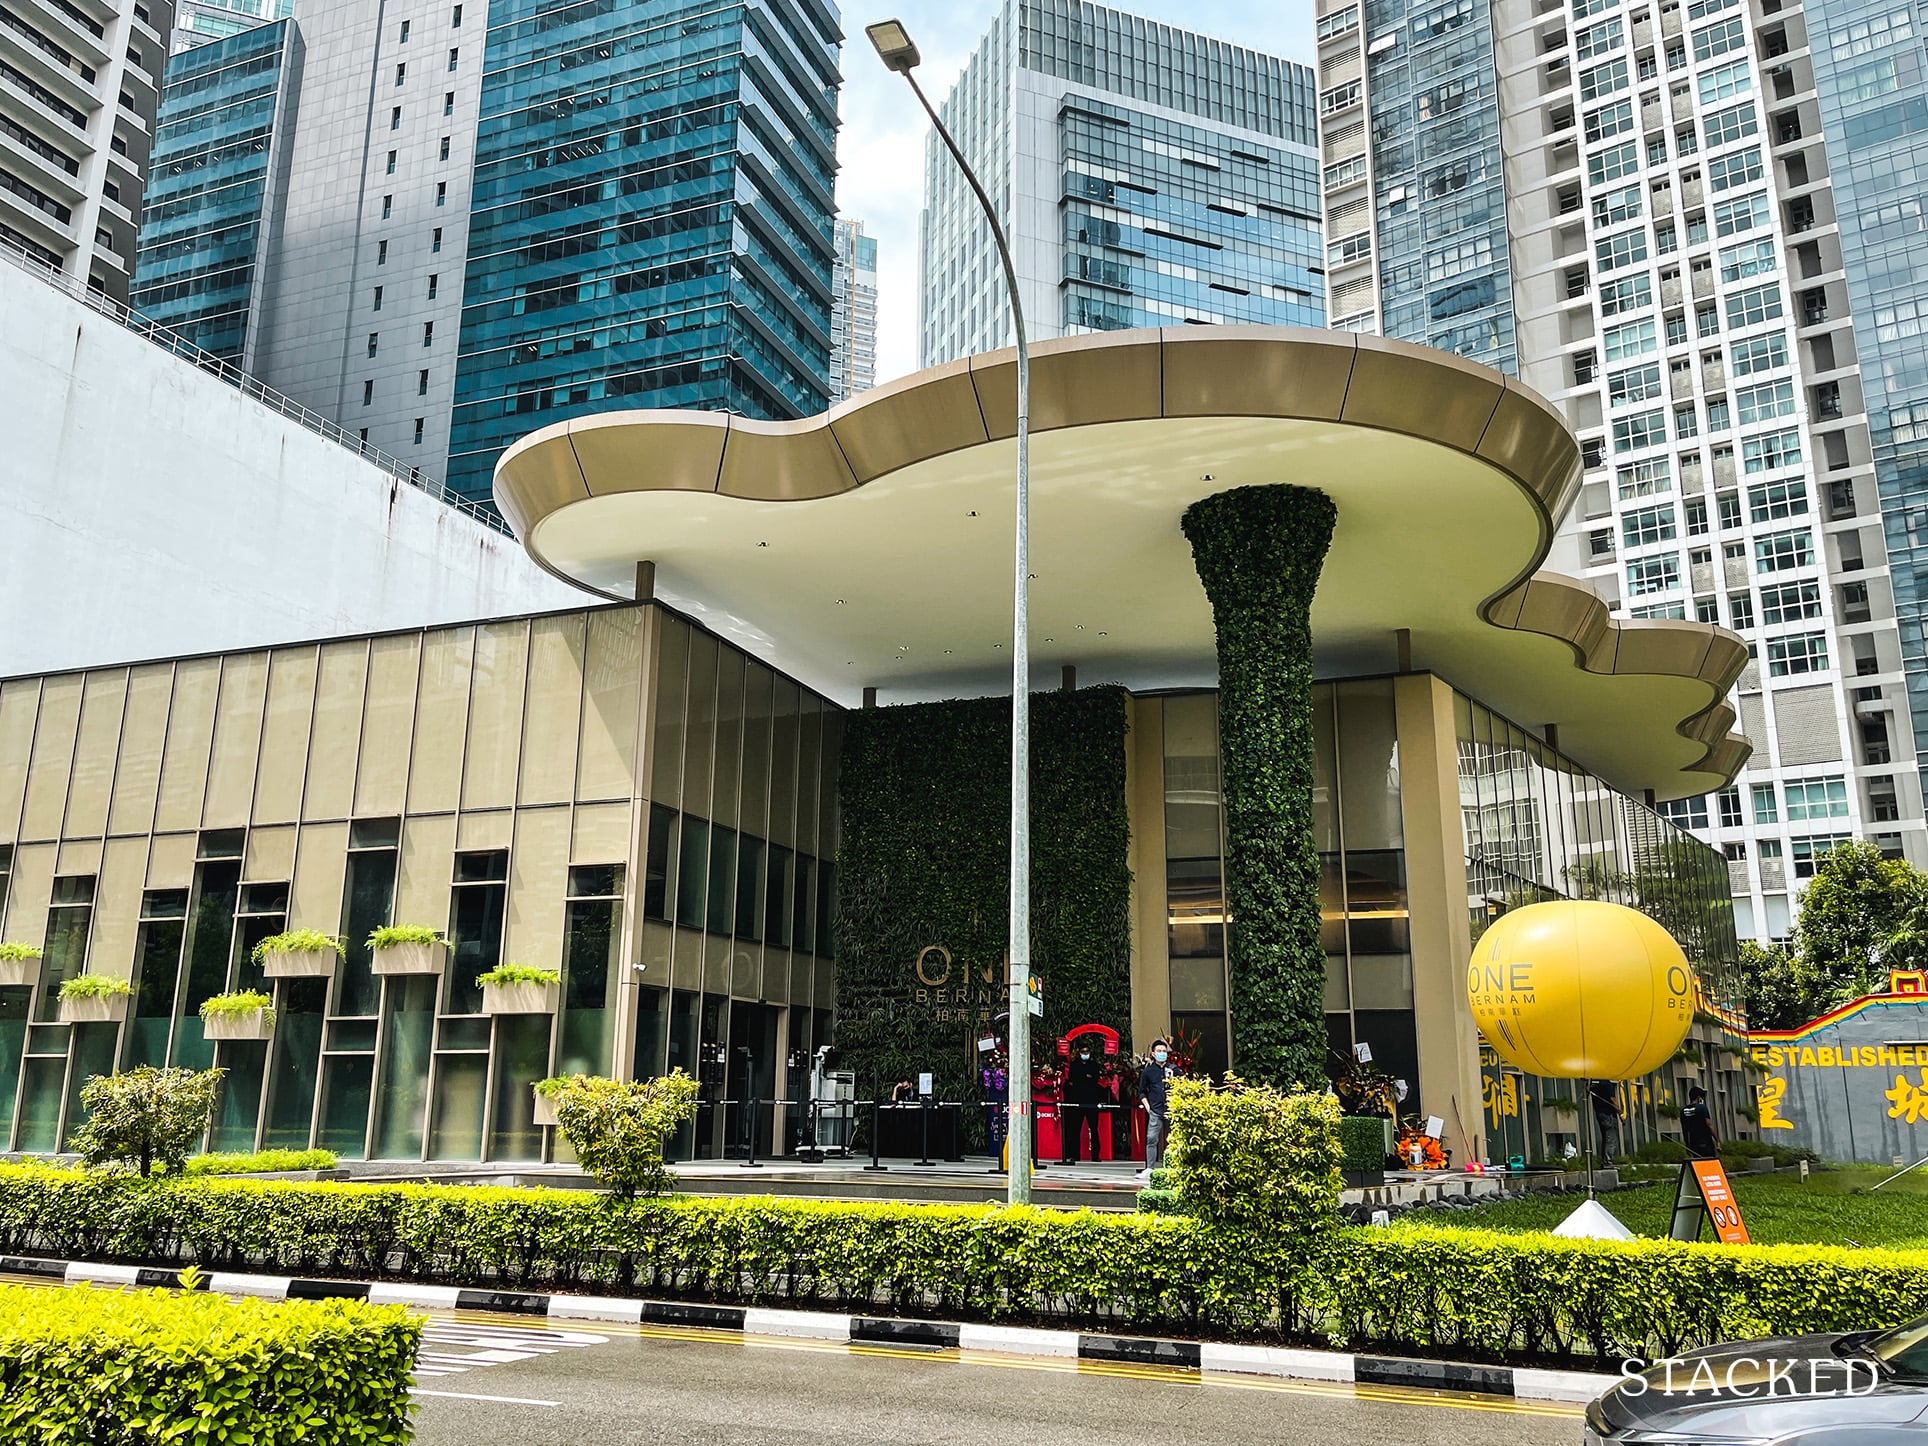
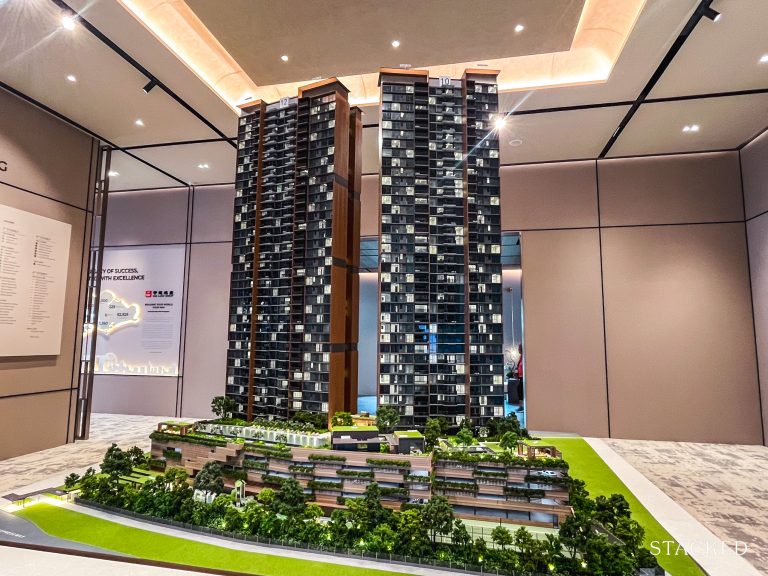
Only District 1 (Raffles Place) managed to end 2020 with an even higher ratio of foreign ownership over the decade. This is largely on the back of Marina Bay, and thanks to the launch of properties such as Marina One Residences (launched in 2018).
Going forward, it does appear as if District 1 may remain the leading choice. In particular, we note that the ratio of foreign property ownership actually rose from 31 per cent to 37 per cent, in the aftermath of the 2018 cooling measures.
As of end 2020, District 1 also had the highest percentage of foreign ownership, with close to a quarter (22 per cent) of residential properties in foreign hands.
Meanwhile in the RCR, District 7 (Bugis) has begun to draw the attention of foreign buyers. This district ended 2020 with the highest percentage of foreign ownership, next to District 4 (District 4 is only higher because it includes Sentosa, which isn’t doing so well as we described above).
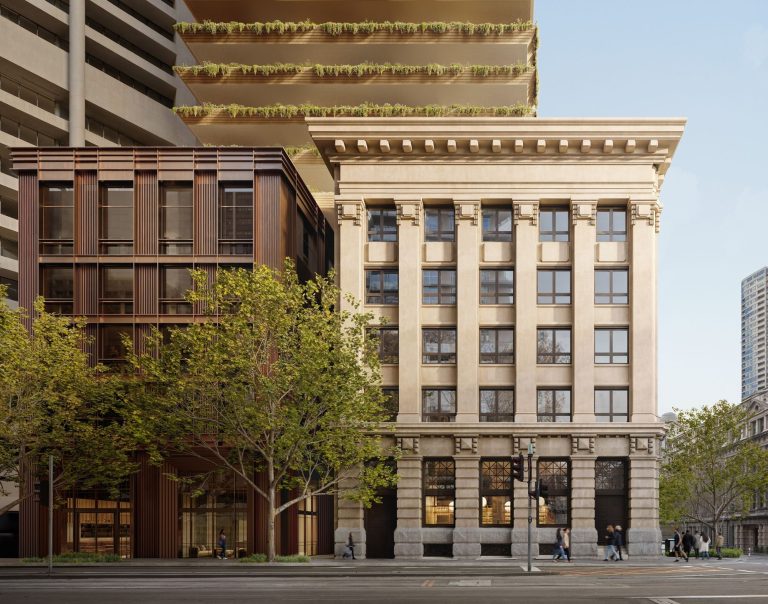
Notably, District 7 beat District 9 in terms of pure price per square foot last year. While the momentum started with South Beach Residences, the development of the Ophir-Rochor Corridor has kept the ball rolling. There are plenty of signs that Singapore’s centre of business and commerce may be gradually shifting to this area. In addition, the launch of small, low-quantum properties – such as Midtown Bay and Midtown Modern – might be more palatable to foreign buyers, given the high ABSD.
Despite foreign ownership being at a new low, the demand remains strong
Analysts and realtors were quick to remind us that, pandemic aside, the low number of foreign buyers is a result of deliberate policy making. It’s the ABSD that’s lowering the numbers, whereas fundamental demand is strong.
In particular, Chinese buyers are more likely to favour Singapore in the current climate. This is due to political unrest in Hong Kong, and generally less cultural familiarity in markets like Australia.
In the meanwhile, investors who hope to sell or rent to foreigners might do well to keep an eye on Districts 1 and 7, and think outside of past favourites like Sentosa Cove.
For more on the Singapore private property market, and updates as the situation unfolds, follow us on Stacked. We’ll also provide you with the most in-depth tours of new and resale properties alike.
At Stacked, we like to look beyond the headlines and surface-level numbers, and focus on how things play out in the real world.
If you’d like to discuss how this applies to your own circumstances, you can reach out for a one-to-one consultation here.
And if you simply have a question or want to share a thought, feel free to write to us at stories@stackedhomes.com — we read every message.


2 Comments
So why do agents blame the heated market on foreigners ? The percentage of foreign buyers is not that significant to influence overall market prices .