


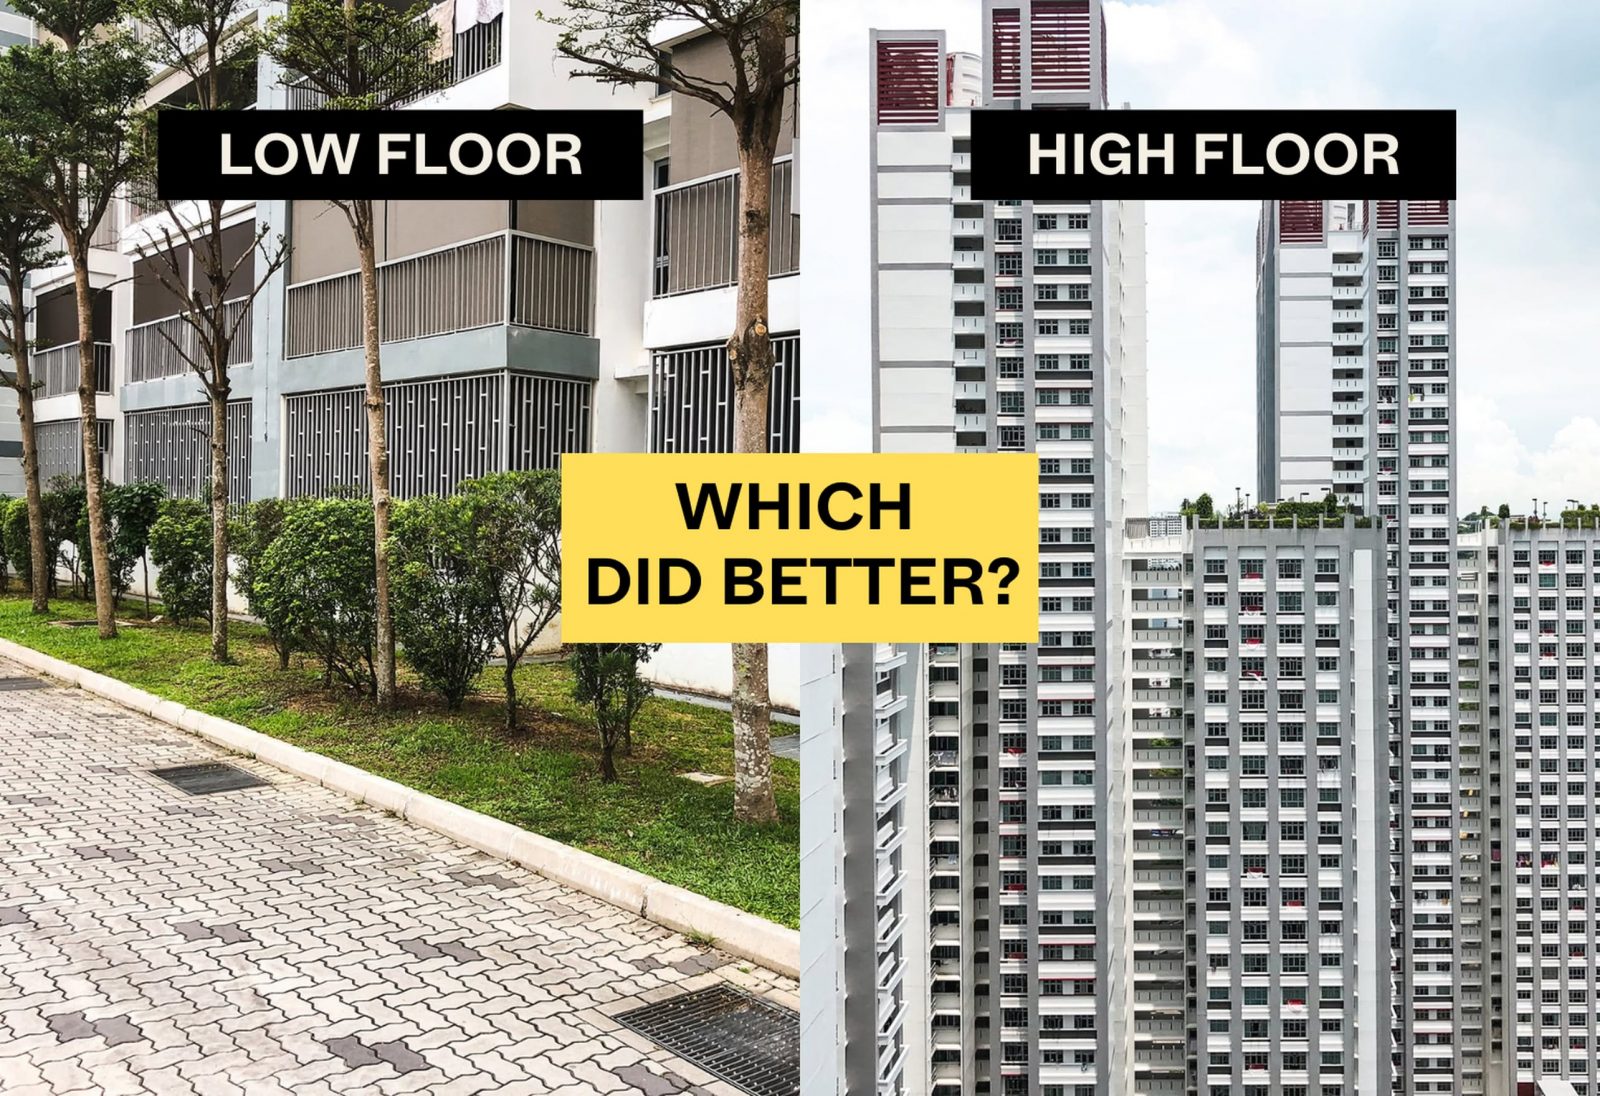
One common perception about HDB flats is that higher floors command a premium – often due to the view or privacy. However, HDB dwellers can be a practical bunch: in our interactions with homeowners and readers, many cite the hassle of long lift rides, or they feel top-floor living can be isolating. At the same time, we also know that many buyers do still chase units on higher floors.
Given these competing perspectives, we decided it’s high time we did a deep dive. However, we recognise some limitations when it comes to the data – while flats seem to be homogeneous due to their similarities, they can vary significantly in terms of location, age, amenities, views and so on.
As such, we narrowed our focus to HDB flats that were 10 to 19 years old, and looked at their price growth between 2020 and 2024. Flats between 10 to 19 years had a good mix of strong transaction volume and flats that were built over 30 storeys (such as Pinnacle @ Duxton).
We also broke down the data by flat type (3-room, 4-room, and 5-room) and by estate, as some towns have more high-floor options than others. This way, we could isolate the floor-level impact more effectively while ensuring as fair a comparison as possible.
Disclaimer:
- We only covered flats with enough resale transaction data in each estate-floor-type combination. As a result, some data points are missing where transactions were minimal or didn’t exist.
- The results are also time-specific (2020–2024). If market conditions shift drastically, the floor premium (or lack thereof) could change.
- Other factors – like orientation, remaining lease beyond the 10- to 19-year mark, or block-specific features – can overshadow the effect of being on a high floor. This is hard to account for due to the vast amount of flats available.
That said, here’s what we uncovered (skip to the picture graphs to see the patterns unless you’re interested in the actual growth numbers)
The challenge for many buyers today isn't access to information.
It's interpreting that information in a way that makes sense for their finances, goals, and stage of life.
Over time, that's also why we decided to work with agents who shared the same data-driven and advisory-led approach behind our editorial, consultants who could help readers think through decisions more objectively, rather than simply push transactions.
Today, the team has worked with more than 2,000 clients across over $5B in property transactions.
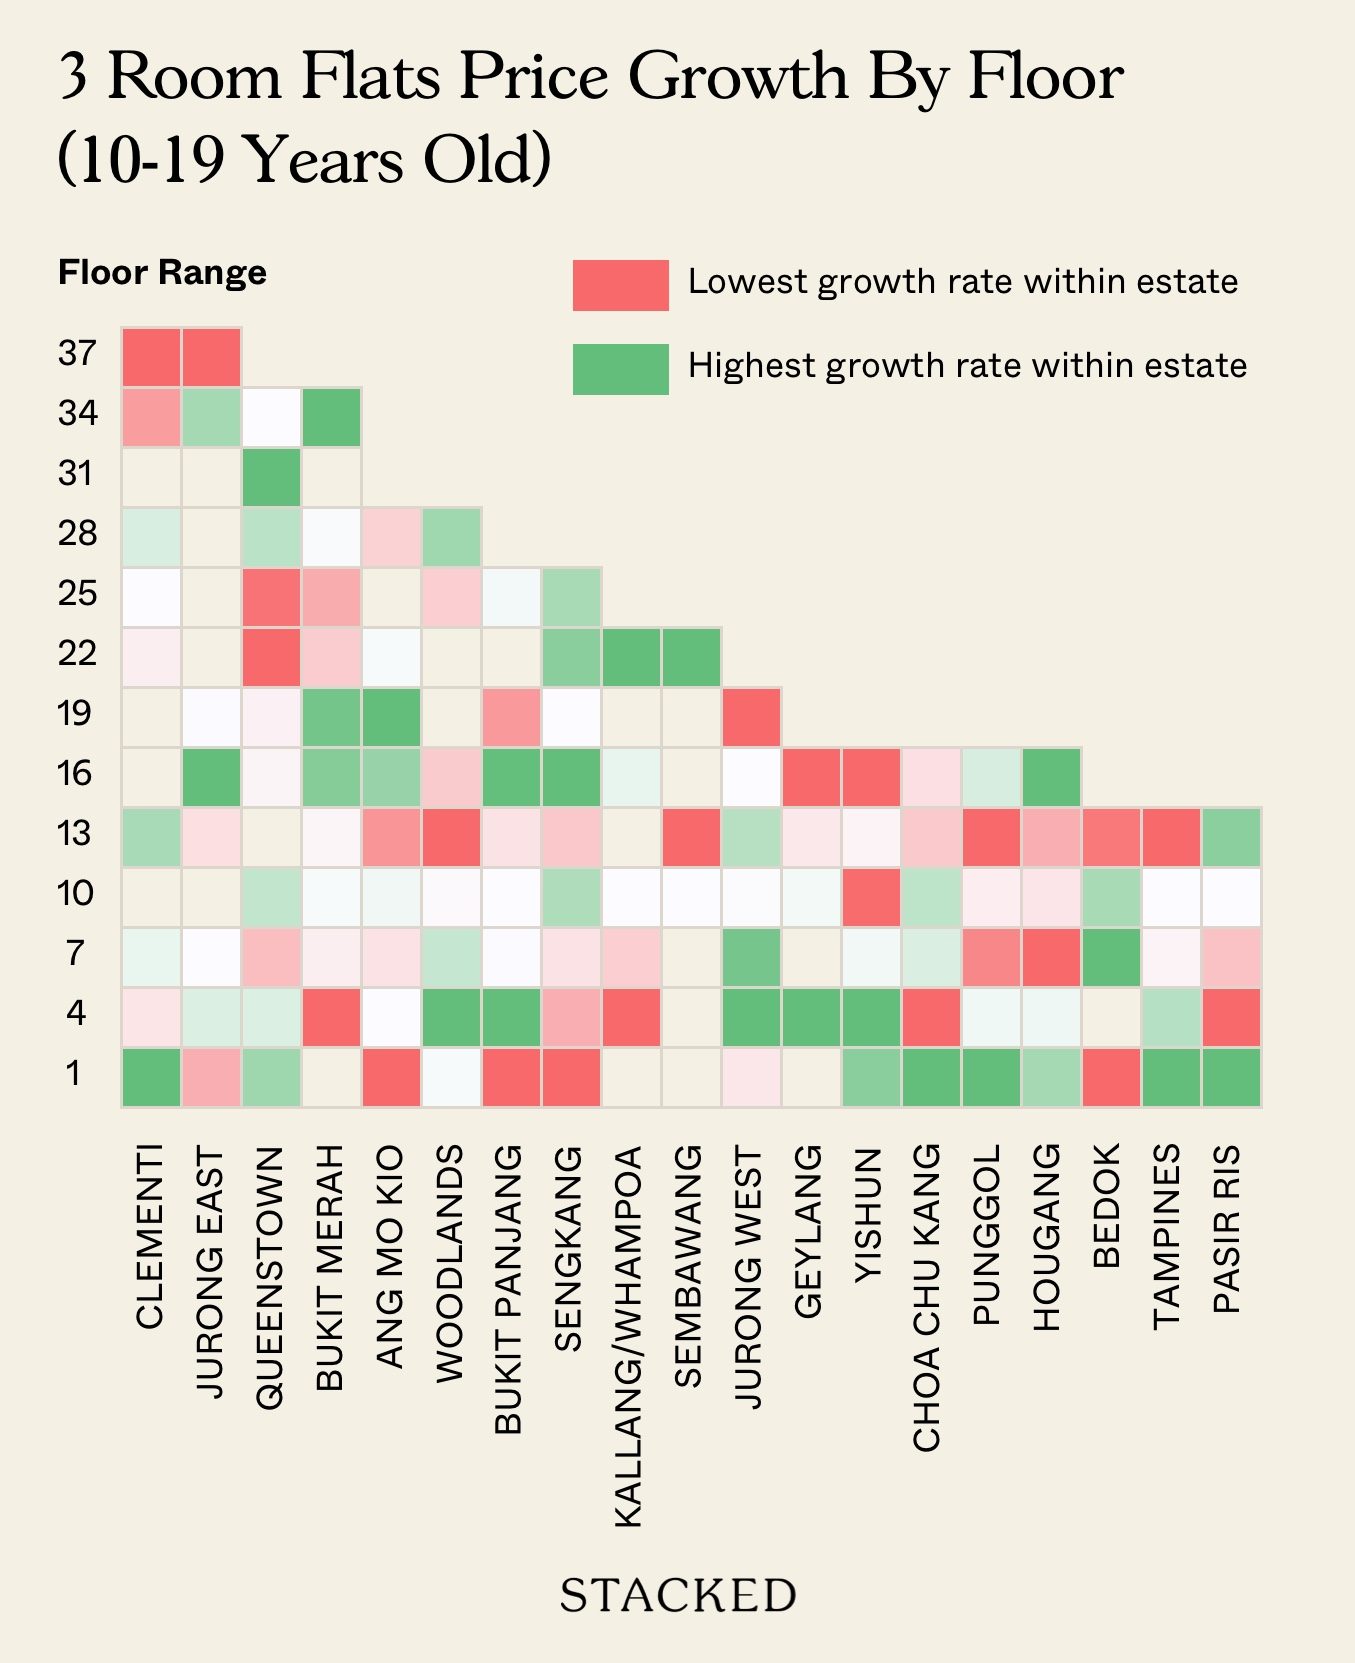
3-room flat price growth by estate and storey range
| TOWN | 01 TO 03 | 04 TO 06 | 07 TO 09 | 10 TO 12 | 13 TO 15 | 16 TO 18 | 19 TO 21 | 22 TO 24 | 25 TO 27 | 28 TO 30 | 31 TO 33 | 34 TO 36 | 37 TO 39 |
| CLEMENTI | 38% | 23% | 26% | 32% | 24% | 25% | 28% | 18% | 15% | ||||
| JURONG EAST | 24% | 34% | 32% | 29% | 43% | 32% | 38% | 17% | |||||
| QUEENSTOWN | 32% | 25% | 18% | 27% | 20% | 20% | 14% | 14% | 28% | 39% | 21% | ||
| BUKIT MERAH | 13% | 23% | 25% | 24% | 36% | 38% | 21% | 18% | 25% | 39% | |||
| ANG MO KIO | 23% | 37% | 35% | 38% | 28% | 41% | 43% | 38% | 33% | ||||
| WOODLANDS | 47% | 52% | 49% | 47% | 36% | 43% | 44% | 50% | |||||
| BUKIT PANJANG | 37% | 54% | 44% | 44% | 42% | 54% | 39% | 44% | |||||
| SENGKANG | 35% | 39% | 43% | 46% | 41% | 48% | 44% | 47% | 46% | ||||
| KALLANG/WHAMPOA | 14% | 18% | 20% | 22% | 34% | ||||||||
| SEMBAWANG | 49% | 42% | 53% | ||||||||||
| JURONG WEST | 25% | 41% | 40% | 28% | 34% | 28% | 2% | ||||||
| GEYLANG | 52% | 32% | 29% | 21% | |||||||||
| YISHUN | 43% | 44% | 40% | 34% | 39% | 34% | |||||||
| CHOA CHU KANG | 48% | 36% | 44% | 45% | 40% | 41% | |||||||
| PUNGGOL | 51% | 46% | 41% | 45% | 40% | 46% | |||||||
| HOUGANG | 46% | 36% | 21% | 32% | 27% | 55% | |||||||
| BEDOK | 17% | 37% | 32% | 17% | |||||||||
| TAMPINES | 43% | 40% | 38% | 38% | 24% | ||||||||
| PASIR RIS | 50% | 35% | 41% | 45% | 49% |
For 3-room flats, there is sometimes strong price growth for higher-floor units in non-mature estates. Towns like Punggol, Sengkang, Choa Chu Kang, Pasir Ris, and Woodlands show they can sometimes exceed 40 per cent price growth, with some even going past 50 per cent.
Older “hot spots” like Clementi, Queenstown, Bukit Merah, and Kallang/Whampoa show more inconsistent patterns, with some high gains but also some weaker growth below 20 per cent.
An anomaly here is Jurong West, which shows only 2.42 per cent appreciation in the 19 – 21 floor height band. This is a one-off outlier, caused by the lack of transaction volumes.
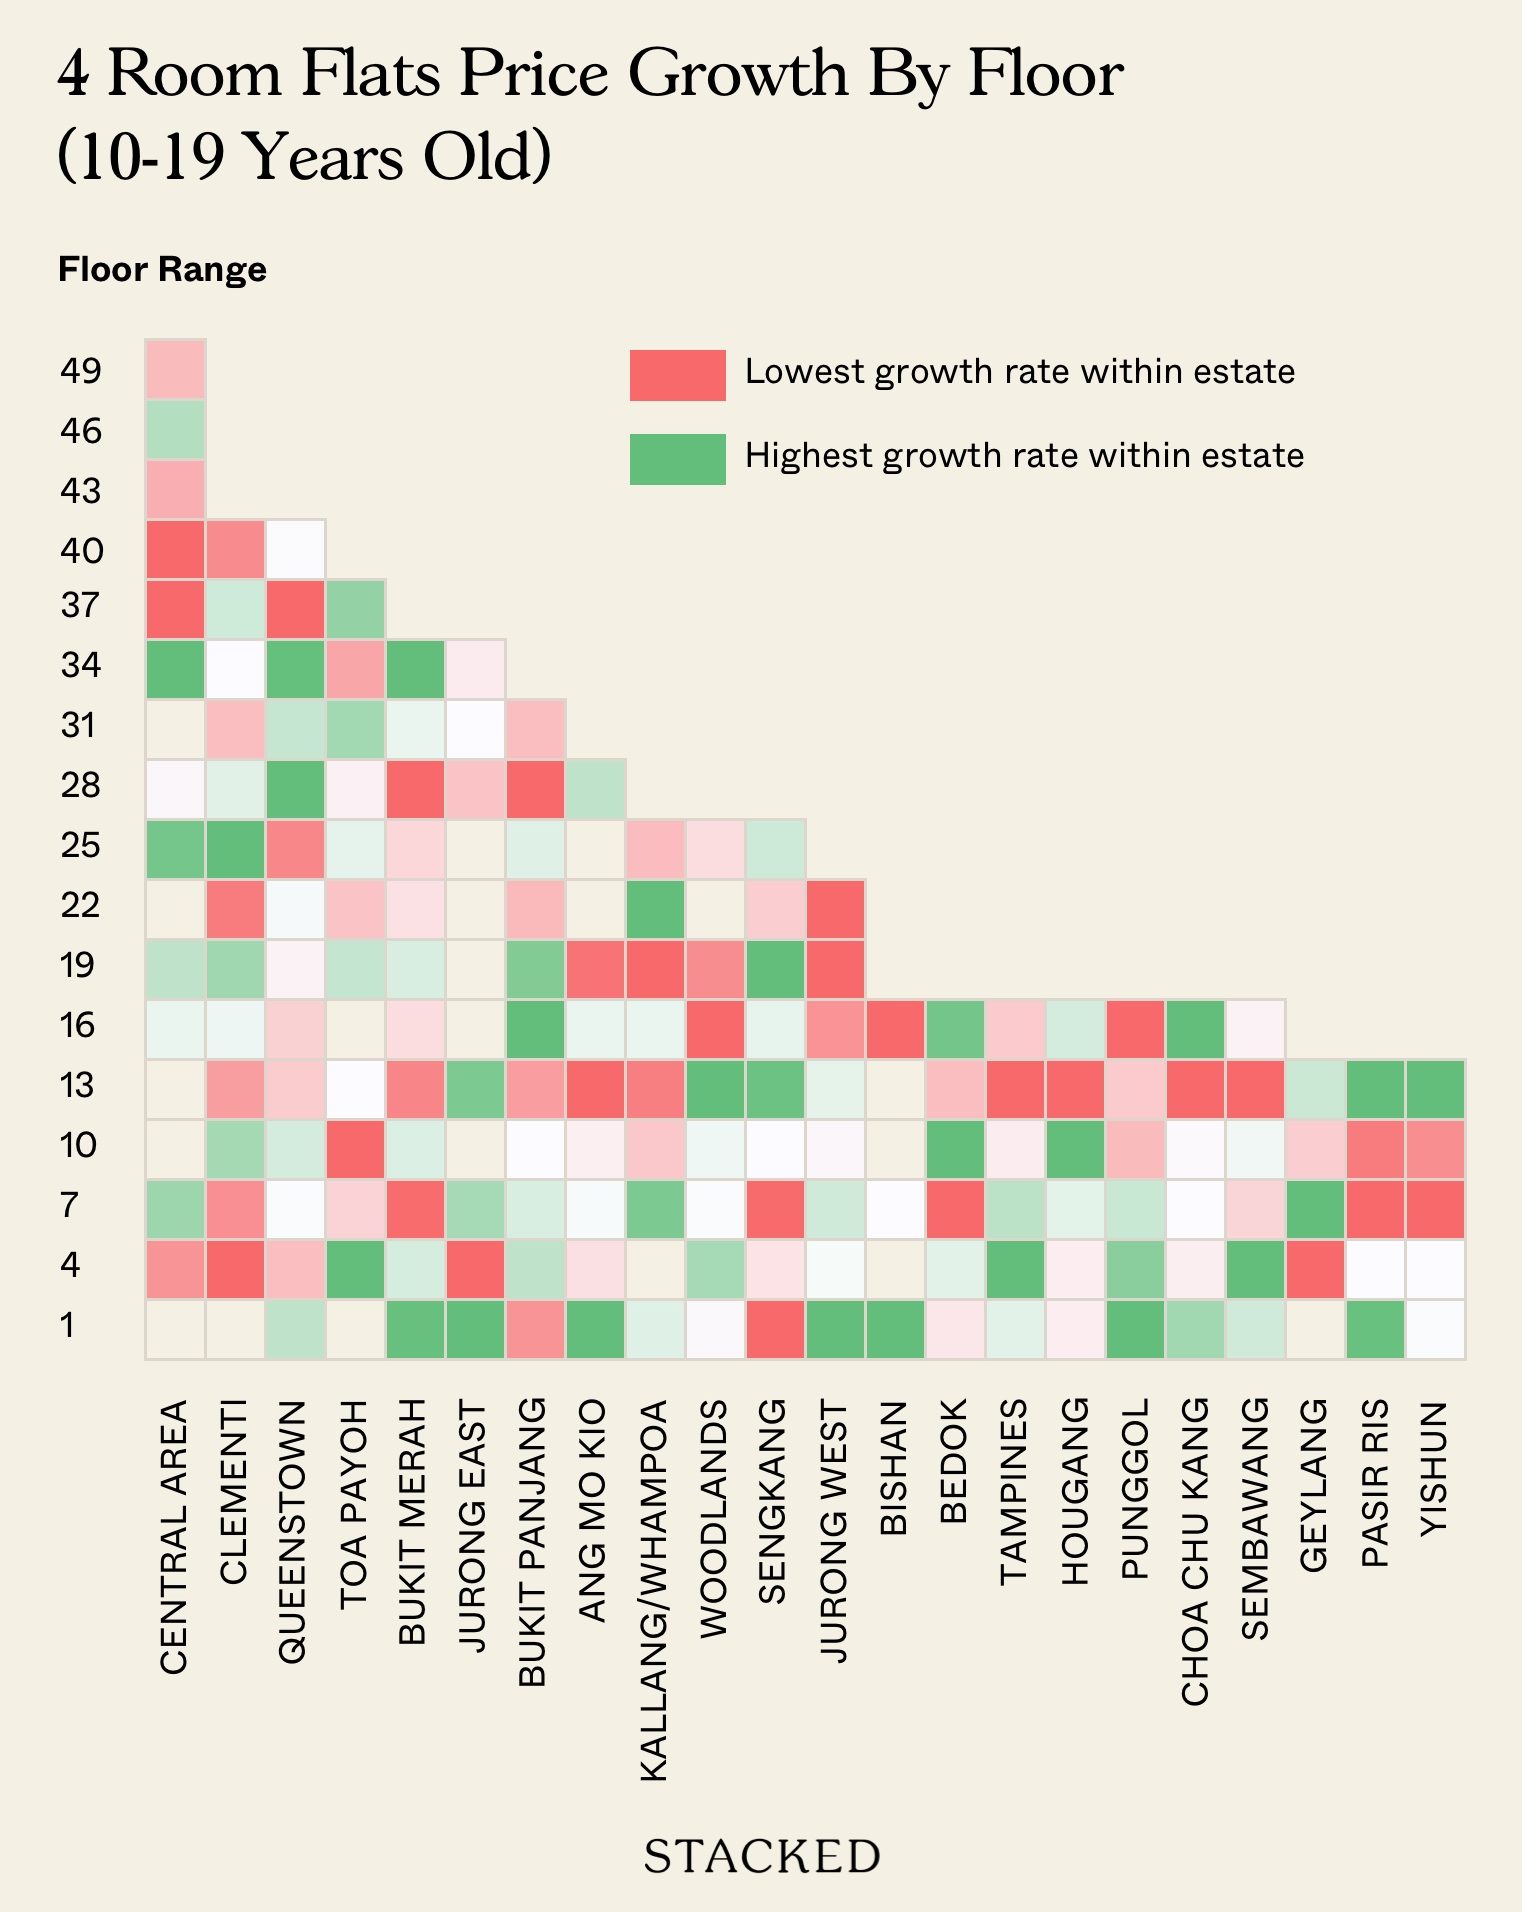
4-room flat price growth by estate and storey range
| TOWN | 01 TO 03 | 04 TO 06 | 07 TO 09 | 10 TO 12 | 13 TO 15 | 16 TO 18 | 19 TO 21 | 22 TO 24 | 25 TO 27 | 28 TO 30 | 31 TO 33 | 34 TO 36 | 37 TO 39 | 40 TO 42 | 43 TO 45 | 46 TO 48 | 49 TO 51 |
| CENTRAL AREA | 28% | 37% | 36% | 37% | 38% | 35% | 39% | 25% | 25% | 30% | 37% | 31% | |||||
| CLEMENTI | 18% | 19% | 30% | 20% | 25% | 30% | 19% | 34% | 26% | 21% | 24% | 27% | 19% | ||||
| QUEENSTOWN | 28% | 21% | 26% | 27% | 22% | 22% | 25% | 26% | 17% | 32% | 28% | 32% | 14% | 26% | |||
| TOA PAYOH | 34% | 18% | 12% | 20% | 26% | 17% | 22% | 20% | 29% | 16% | 30% | ||||||
| BUKIT MERAH | 35% | 28% | 21% | 28% | 22% | 25% | 28% | 25% | 25% | 20% | 27% | 35% | |||||
| JURONG EAST | 45% | 35% | 43% | 44% | 39% | 41% | 40% | ||||||||||
| BUKIT PANJANG | 32% | 37% | 36% | 36% | 33% | 38% | 37% | 34% | 36% | 31% | 34% | ||||||
| ANG MO KIO | 48% | 29% | 31% | 30% | 23% | 33% | 24% | 38% | |||||||||
| KALLANG/WHAMPOA | 29% | 38% | 24% | 22% | 28% | 21% | 40% | 24% | |||||||||
| WOODLANDS | 43% | 46% | 43% | 43% | 49% | 36% | 38% | 42% | |||||||||
| SENGKANG | 40% | 42% | 40% | 42% | 45% | 43% | 45% | 41% | 43% | ||||||||
| JURONG WEST | 43% | 29% | 33% | 28% | 31% | 16% | 11% | 11% | |||||||||
| BISHAN | 41% | 29% | 23% | ||||||||||||||
| BEDOK | 23% | 23% | 20% | 26% | 22% | 25% | |||||||||||
| TAMPINES | 36% | 41% | 38% | 34% | 25% | 32% | |||||||||||
| HOUGANG | 31% | 31% | 32% | 35% | 25% | 32% | |||||||||||
| PUNGGOL | 44% | 43% | 42% | 39% | 39% | 36% | |||||||||||
| CHOA CHU KANG | 34% | 28% | 28% | 28% | 26% | 38% | |||||||||||
| SEMBAWANG | 44% | 48% | 41% | 43% | 36% | 42% | |||||||||||
| GEYLANG | 20% | 34% | 25% | 29% | |||||||||||||
| PASIR RIS | 44% | 43% | 39% | 39% | 44% | ||||||||||||
| YISHUN | 44% | 44% | 38% | 40% | 50% |
Non-mature towns like Sengkang, Punggol, and Choa Chu Kang had some examples of appreciation among upper floors, often exceeding 40 per cent.
For Hougang and Bukit Panjang flats, there are some strong spikes in price for mid-floor flats (e.g., 16 – 24), which may be even higher than upper-floor units.
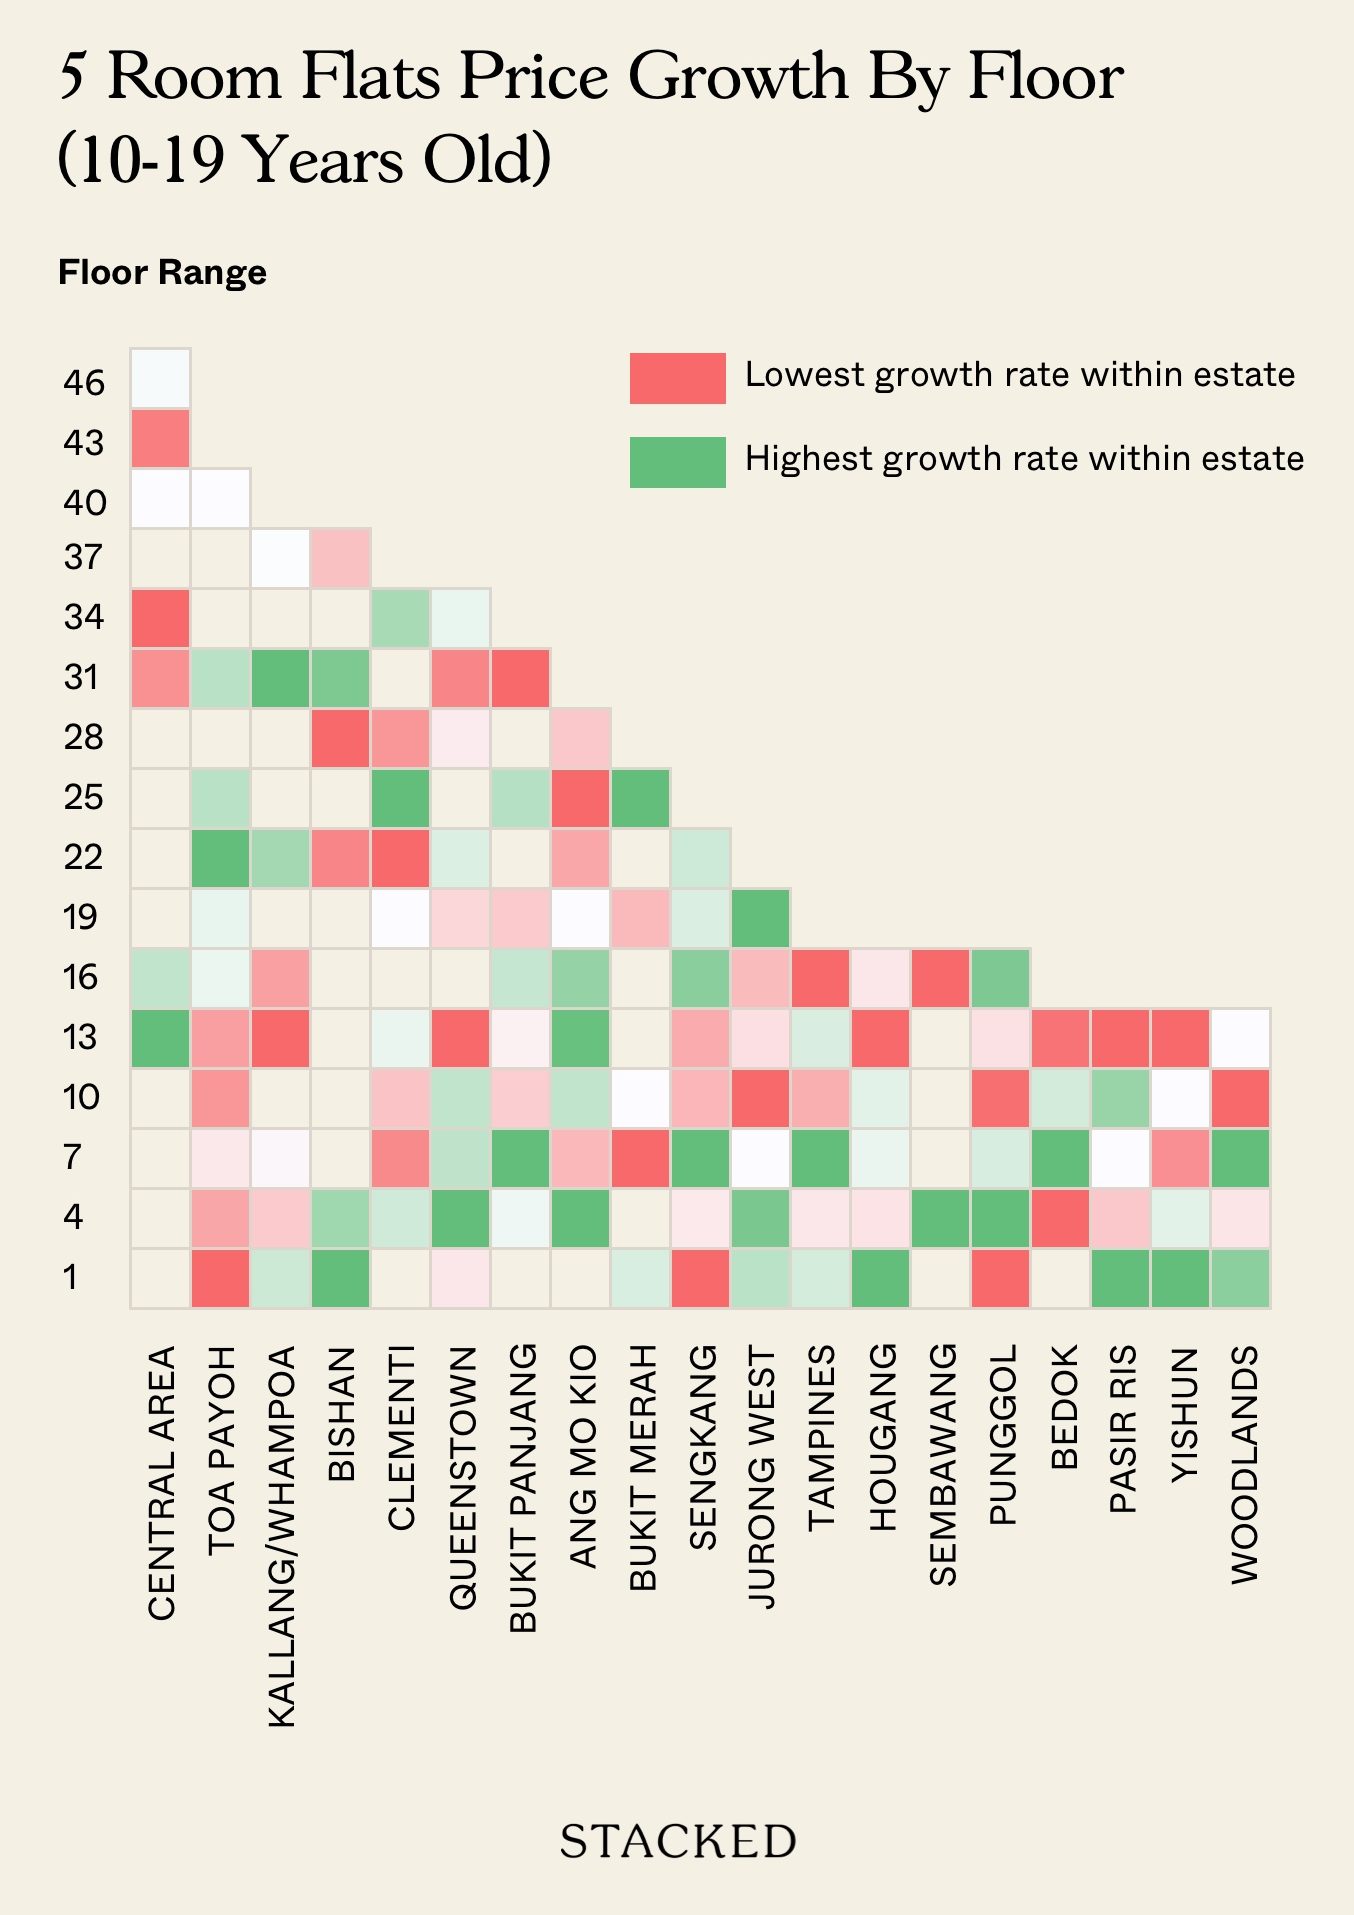
5-room flat price growth by estate and storey range
| TOWN | 01 TO 03 | 04 TO 06 | 07 TO 09 | 10 TO 12 | 13 TO 15 | 16 TO 18 | 19 TO 21 | 22 TO 24 | 25 TO 27 | 28 TO 30 | 31 TO 33 | 34 TO 36 | 37 TO 39 | 40 TO 42 | 43 TO 45 | 46 TO 48 |
| CENTRAL AREA | 40% | 31% | 23% | 22% | 26% | 23% | 26% | |||||||||
| TOA PAYOH | 18% | 25% | 33% | 23% | 24% | 37% | 37% | 49% | 41% | 41% | 35% | |||||
| KALLANG/WHAMPOA | 30% | 20% | 23% | 16% | 18% | 37% | 47% | 23% | ||||||||
| BISHAN | 64% | 60% | 39% | 36% | 62% | 46% | ||||||||||
| CLEMENTI | 28% | 16% | 21% | 27% | 27% | 13% | 32% | 17% | 29% | |||||||
| QUEENSTOWN | 27% | 53% | 40% | 39% | 5% | 24% | 35% | 28% | 10% | 33% | ||||||
| BUKIT PANJANG | 31% | 38% | 28% | 30% | 33% | 28% | 34% | 22% | ||||||||
| ANG MO KIO | 53% | 22% | 40% | 52% | 46% | 32% | 19% | 9% | 24% | |||||||
| BUKIT MERAH | 24% | 3% | 20% | 12% | 38% | |||||||||||
| SENGKANG | 29% | 35% | 40% | 33% | 32% | 39% | 37% | 38% | ||||||||
| JURONG WEST | 29% | 32% | 27% | 13% | 24% | 21% | 33% | |||||||||
| JURONG EAST | 43% | |||||||||||||||
| TAMPINES | 30% | 28% | 33% | 25% | 30% | 22% | ||||||||||
| HOUGANG | 49% | 28% | 32% | 33% | 15% | 28% | ||||||||||
| SEMBAWANG | 42% | 28% | ||||||||||||||
| PUNGGOL | 30% | 38% | 35% | 31% | 34% | 37% | ||||||||||
| BEDOK | 20% | 25% | 22% | 20% | ||||||||||||
| PASIR RIS | 43% | 29% | 31% | 39% | 25% | |||||||||||
| YISHUN | 41% | 35% | 31% | 34% | 30% | |||||||||||
| WOODLANDS | 49% | 43% | 50% | 31% | 45% |
Bishan has sharp price spikes that can see over 60 per cent appreciation, but Ang Mo Kio has extreme variations – some flats exceed 50 per cent growth whilst others are below 10 per cent. Queenstown and Clementi have erratic movements too, with some mid-floor units outperforming high floors.
Observations and conclusions:
Across various estates for 3-room flats, the data shows no universal rule that higher floors always have stronger gains.
For instance, in Punggol, 3-room units on the ground floor have outperformed nearly all other floors in terms of growth, suggesting that some buyers continue to prize accessibility and affordability over lofty views.
Meanwhile, Sembawang shows the highest appreciation closer to the 20th-storey range, surpassing both the lower and the very top levels. Over in Hougang, the 16th-storey band leads the pack, overshadowing not just the lower floors but also the highest ones. In Kallang/Whampoa, it’s around the 22nd floor that garners the best appreciation, again demonstrating a mid-to-high preference for that estate.
By contrast, Woodlands appears to reward those in the 4th to 7th storey range, with these floors sometimes outdoing the top floors. Geylang shows a similar pattern, where the 4th to 7th-storey band records some of the most substantial gains.
Overall, this demonstrates that local estate factors tend to matter more than floor height alone. In one town, convenience and lower cost may drive demand for ground-floor units; in another, mid-level or near-top floors might attract buyers looking for a balance between accessibility and better views. We also need to consider ongoing changes, such as the construction of a new project that impedes a previously unblocked view.
Factors like block design, demographics (e.g., retirees right-sizing), and local amenities are likely at play – underscoring how difficult it is to generalise about “best” floors for 3-room flats across all of Singapore.
4-room flats also showed mixed signals, with some cases of higher growth on mid/high floors
For 4-room units, the picture remains varied. Some estates (e.g., Jurong West) showed lower floors (1 to 3) outpacing higher floors in resale growth, suggesting budget-conscious buyers are still drawn to the more affordable ground-level or mid-level units.
In Woodlands, however, there’s a clear mid-floor advantage, with those floors generating stronger appreciation than both the lowest and highest units; while in Sembawang, it’s the lower-mid floors that lead the pack. Elsewhere (like Sengkang), the difference between lower and higher floors was relatively modest – about 40 to 45 per cent growth across most storey ranges—indicating the entire town is in demand.
Overall, 4-room flats are the most common flat type, and the mixed data suggests both affordability and lifestyle preferences drive demand – hence no simple “go for the top floor” or “always buy the cheaper low floor” guidance here.
5-room flats show even greater variation, but high floors shine in certain estates
Among 5-room flats (10–19 years old), we observed that Bishan had some of the highest recorded gains at the lower floors (1–3) yet also notably high appreciation at selected mid-to-upper floors (like 31–33). This points to strong overall demand for larger flats in a prime, city-fringe location, regardless of floor.
Woodlands showed robust gains across many floors, but interestingly, the middle floors (8 to 10) sometimes outperformed the bottom or top.
In some newly popular areas (e.g., certain segments of Punggol or Sengkang), data indicated steady gains across the board, with a slight tilt toward upper floors.
Among this segment, we see that larger families or upgraders typically have bigger budgets, and are often more willing to pay for premium traits. However, the preference for a truly high floor is not universal. Some buyers prefer easy lift access or proximity to ground-level amenities, especially if they have mobility concerns or young children.
What could explain such variations?
Two main reasons come to mind:
Estate and Block-Specific Demand
Where location and amenities are prime (e.g., mature, centrally located towns), any floor can achieve strong appreciation. Factors like MRT proximity or a popular school can outweigh the difference between a 5th-floor vs. a 20th-floor view.
It’s also worth noting that in some specific blocks, being on the ground floor is more of a drawback than others. For example: blocks that face out to the car park on the ground floor, are close to the dumping area or very noisy coffee shops, may have more noise and pest problems. In contrast, a flat could be on a lower floor but far from any of these, so the drawbacks are not too significant.
Affordability vs. Premium
Especially for 3-room and 4-room flats, there’s clear evidence that an affordability-first mindset keeps lower floors popular – some buyers simply aren’t willing to pay more for higher floors if it strains their budget. Lower floor units tend to be more affordable and thus have a larger pool of buyers. With prices heading up, these lower-priced units would be seen more favourably.
Ultimately, there’s no linear, consistent relationship between top and bottom floors and appreciation. For 10 to 19-year-old HDB flats between 2020 and 2024, our data shows no blanket rule that higher floors automatically command higher gains. In fact, many estates exhibit strong low-floor performance, and in others, mid-level floors even outperform top floors.
Rather than floor height, look beyond factors like the location, amenities, block orientation, and buyer demographics. Several unit-specific details, like the state of maintenance or renovations, can also play a bigger part in the eventual price.
At Stacked, we like to look beyond the headlines and surface-level numbers, and focus on how things play out in the real world.
If you’d like to discuss how this applies to your own circumstances, you can reach out for a one-to-one consultation here.
And if you simply have a question or want to share a thought, feel free to write to us at stories@stackedhomes.com — we read every message.

5 Comments
Hi. The Green-red-white colour chart for the 4-room analysis is not included; instead the 3-room chart is duplicated in its place.
Best view is not necessarily highest floor. Some like lower-level tree canopy view esp. to have nice green view and also to block view of blocks opposite. Nice views of nearby park, river etc also have better view from mid-levels rather than highest floor. So these may explain to certain extent.
Yes, interesting and informative article but the chart mistake in 4-room analysis needs to be corrected. Please update with correct chart for the 4-room flats. Thanks !
My flat which is in Pasir Ris,on the 2nd floor, is in the market for 8 months and I have less than 10 viewers because my agent says its low floor, noisy and old.
Very disappointed.
Purchasing an apartment on the highest floors is pointless if there are no views or if privacy isn’t a priority for you. However, for units that offer these features, buyers especially deep pockets down graders are often willing to pay a premium for the exclusivity.