(Updated) We Ranked Every District By How Much They’ve Gained (Or Lost) – Here Are The Results
January 22, 2020
Some of you might have remembered us doing a piece on the noisiest district in Singapore some time back (*Mini-spoiler Alert*: No. 1 was quite the surprise).
Safe to say, it received overwhelmingly positive feedback from you guys.
So we thought, why not do one on appreciation stats as well?
The only difference this time being that we would actually cover all the districts in this piece as opposed to a ‘Top 10 countdown’ (well, kind of anyways).
Now not many of the younger folks might know this.
But the reason we actually have all these district numbers today is because of the old postal system that goes way back in time (in fact even before Singapore’s birth).
How it All Began (A Brief History)
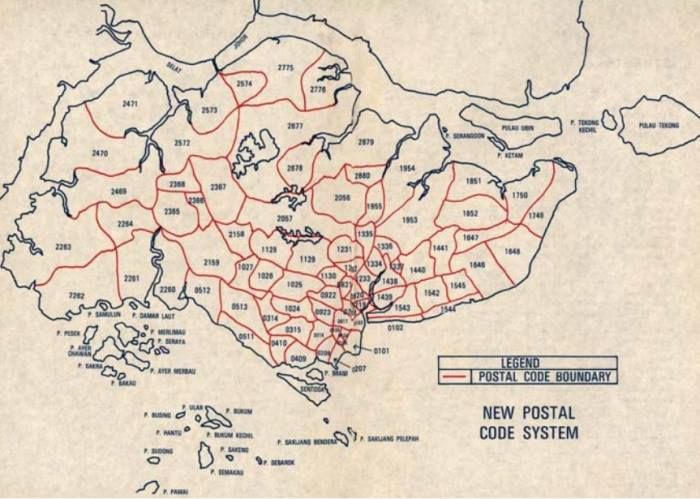
For those of us here who might remember, Singapore’s postal code numbers wasn’t always a 6-digit number.
Which meant that you couldn’t simply read the last 3 digits of your buddy’s postal code to figure out which block he was staying at (well for most HDB flats that is).
No. In fact, there were quite a few changes to the postal code system over the years – no doubt courtesy of the ever-increasing residential development numbers.
(We’ll just breeze through the highlights for now)
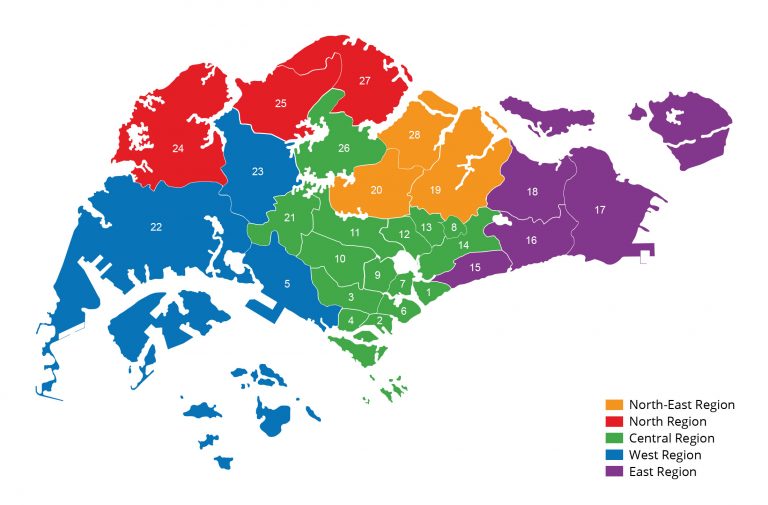
Back in 6 March 1950, Singapore was initially divided into 28 postal districts (the numbers we know today) – with a specific number given to each ‘major’ section of the island.
Almost 3 decades later, we observed a new 4-digit postal code system overhaul.
At this point, the districts had been further divided into 81 sectors with the last 2 digits of the postal code indicating one of these particular sectors.
Fast forward to 1 September 1995, and we saw the final upgrade to the 6-digit postal code that we have come to know and love – the first 2 numbers of which, now represented the sectors of old.
Of course, the initial district numbers never completely disappeared – and we now refer to them fondly in industry speak whenever we need to single out a particular region of origin.
District Rankings (List)
Now just a few quick pointers to note before we get into things:
- Firstly, we have omitted Districts 6 and 24 on the precursor that there are limited residential developments in these two regions (Clarke Quay/City Hall and Lim Chu Kang/Tengah respectively), hence our inability to rank them fairly.
- Secondly, the figures are based off combined/averaged residential development appreciation statistics across 26 districts over the past 5 years (January 2015 – December 2019).
- Finally (and based off the previous point), the fact that these statistics are taken over a 5-year period across various developments make it hard to ascertain the actual appreciation-related reasons – though we’ll be sure to leave you some nice tidbits throughout!
Let’s do this.
#26 – D16 (Bedok/Upper East Coast/)
Safe to say it’s a little disconcerting when that one area that holds most of your childhood memories ranks as the current lowest in the list. But I guess someone has to take the spot either way!
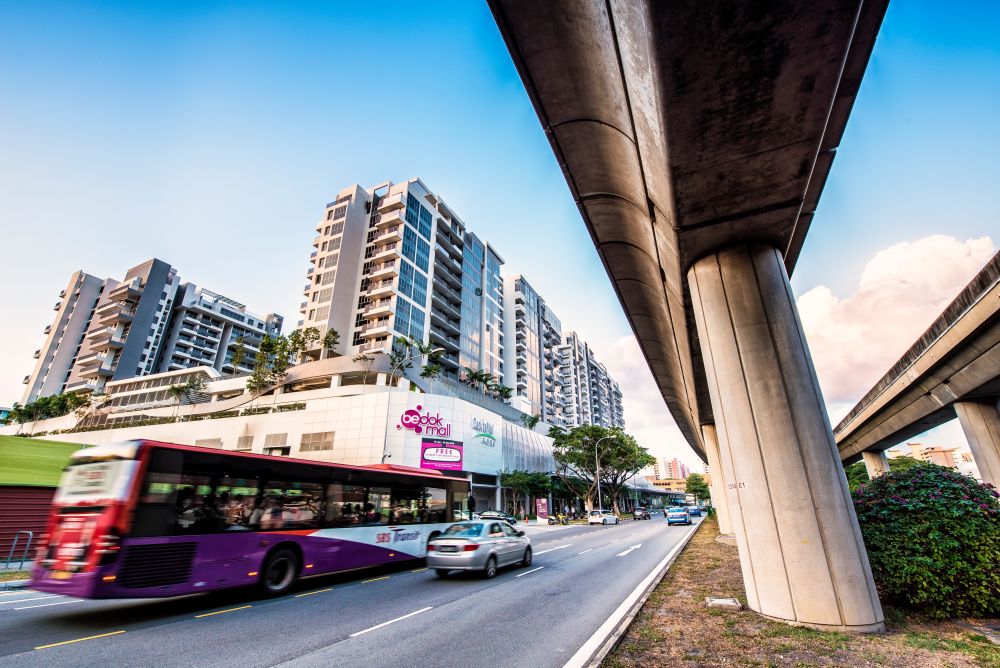
Home to a diverse number of shopping malls and food outlets, District 16 currently ranks as the lowest appreciating district over the last 5 years at -7.57%.
Price Movements: $1,150 average psf in January 2015 to $1,063 average psf in December 2019.
#25 – D25 (Admiralty/Woodlands)
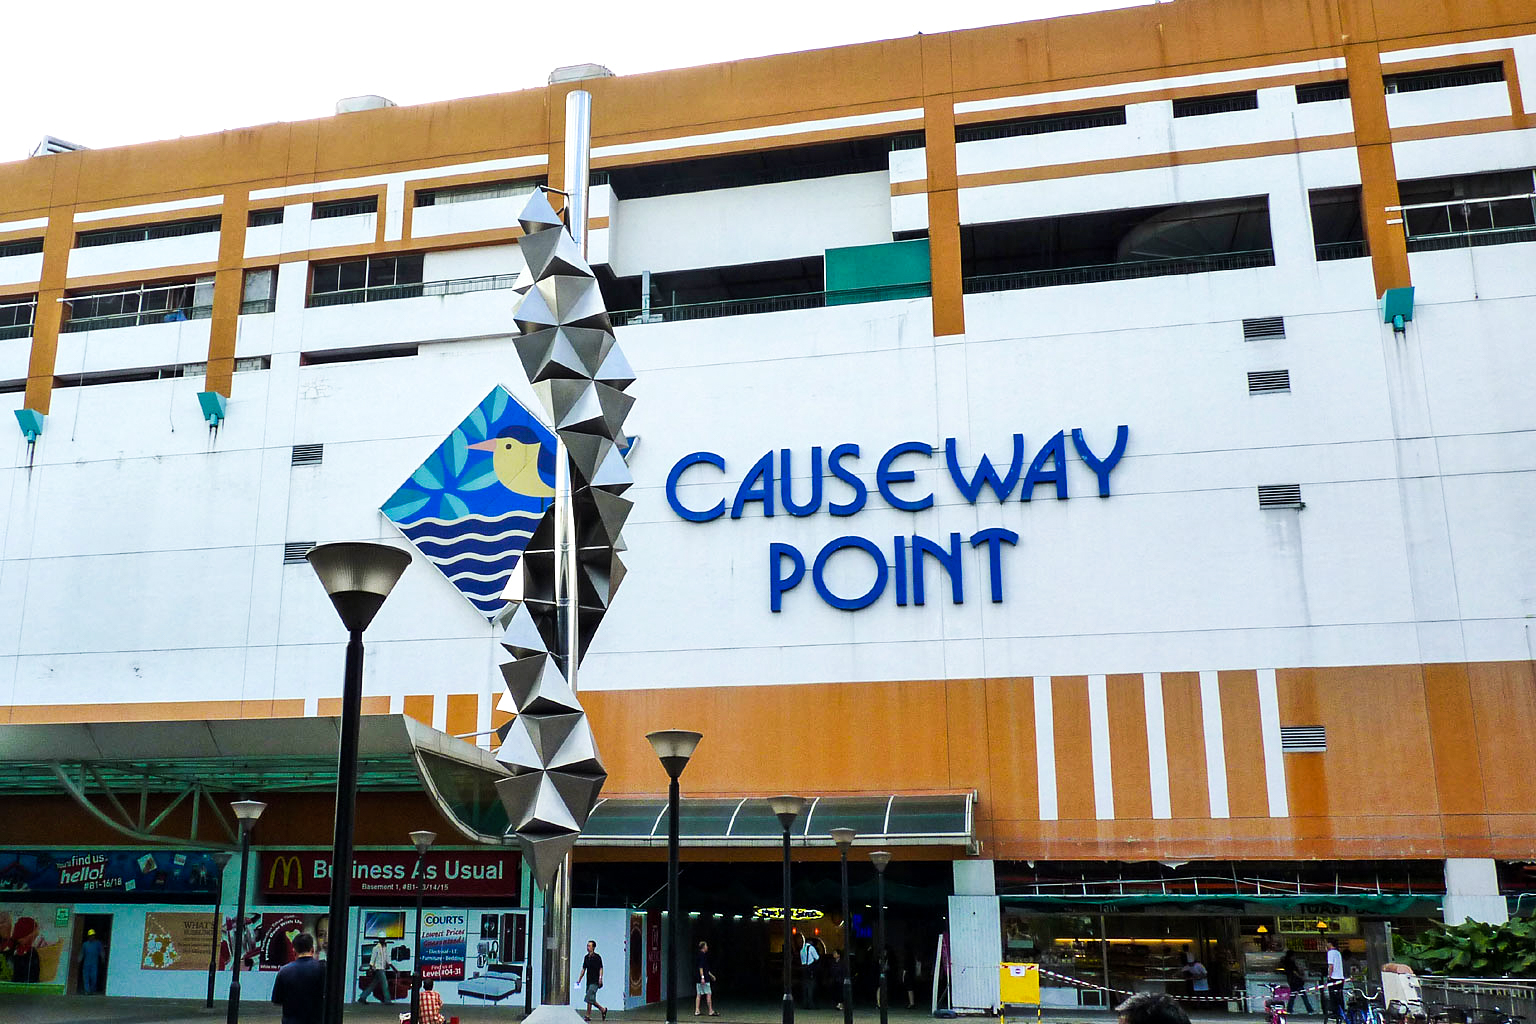
Most people living outside of District 25 automatically think of JB when they see the word Woodlands but there is a fair share of residential developments, schools and shopping malls in this part of town.
It is also one of Singapore’s older districts with the impending 43km-long Thomson-East Line set to make its mark here with 2 extra stations (Woodlands North and South) opening their doors at the end of this month.
Of course, the rewards of this extra amenity will mostly take full effect once the entire line is eventually opened and functioning.
For now, the area’s appreciation statistics stand at -2.17%.
Price Movements: $783 average psf in January 2015 to $766 average psf in December 2019.
#24 – D12 (Toa Payoh/Balestier)
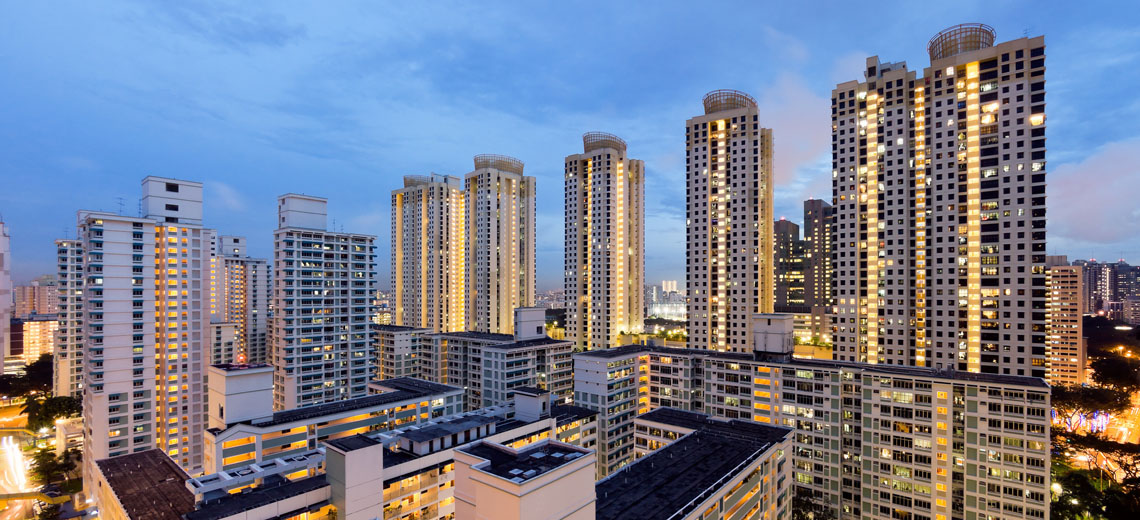
I’ll be the first to raise my hand up to say that I am surprised how lowly ranked District 12 is.
Perhaps even more so that on overall terms its percentage growth is in negative territory – albeit ever so slightly.
One reason for its stagnant growth could be the lack of new launches in the area.
Especially since the Toa Payoh/Balestier area is pretty packed with residential developments and older shophouse-like enclaves.
It is also home to the HDB Hub where most go to put down their deposits or to enquire about particular flats of interest.
Finally, its relative ‘centrality’ (next to Newton) further classifies the area under the Rest of Central Region (RCR) category.
District 12’s appreciation figures: -0.36%.
Price Movements: $1,388 average psf in January 2015 to $1,383 average psf in December 2019.
#23 – D8 (Farrer Park/Serangoon Road)
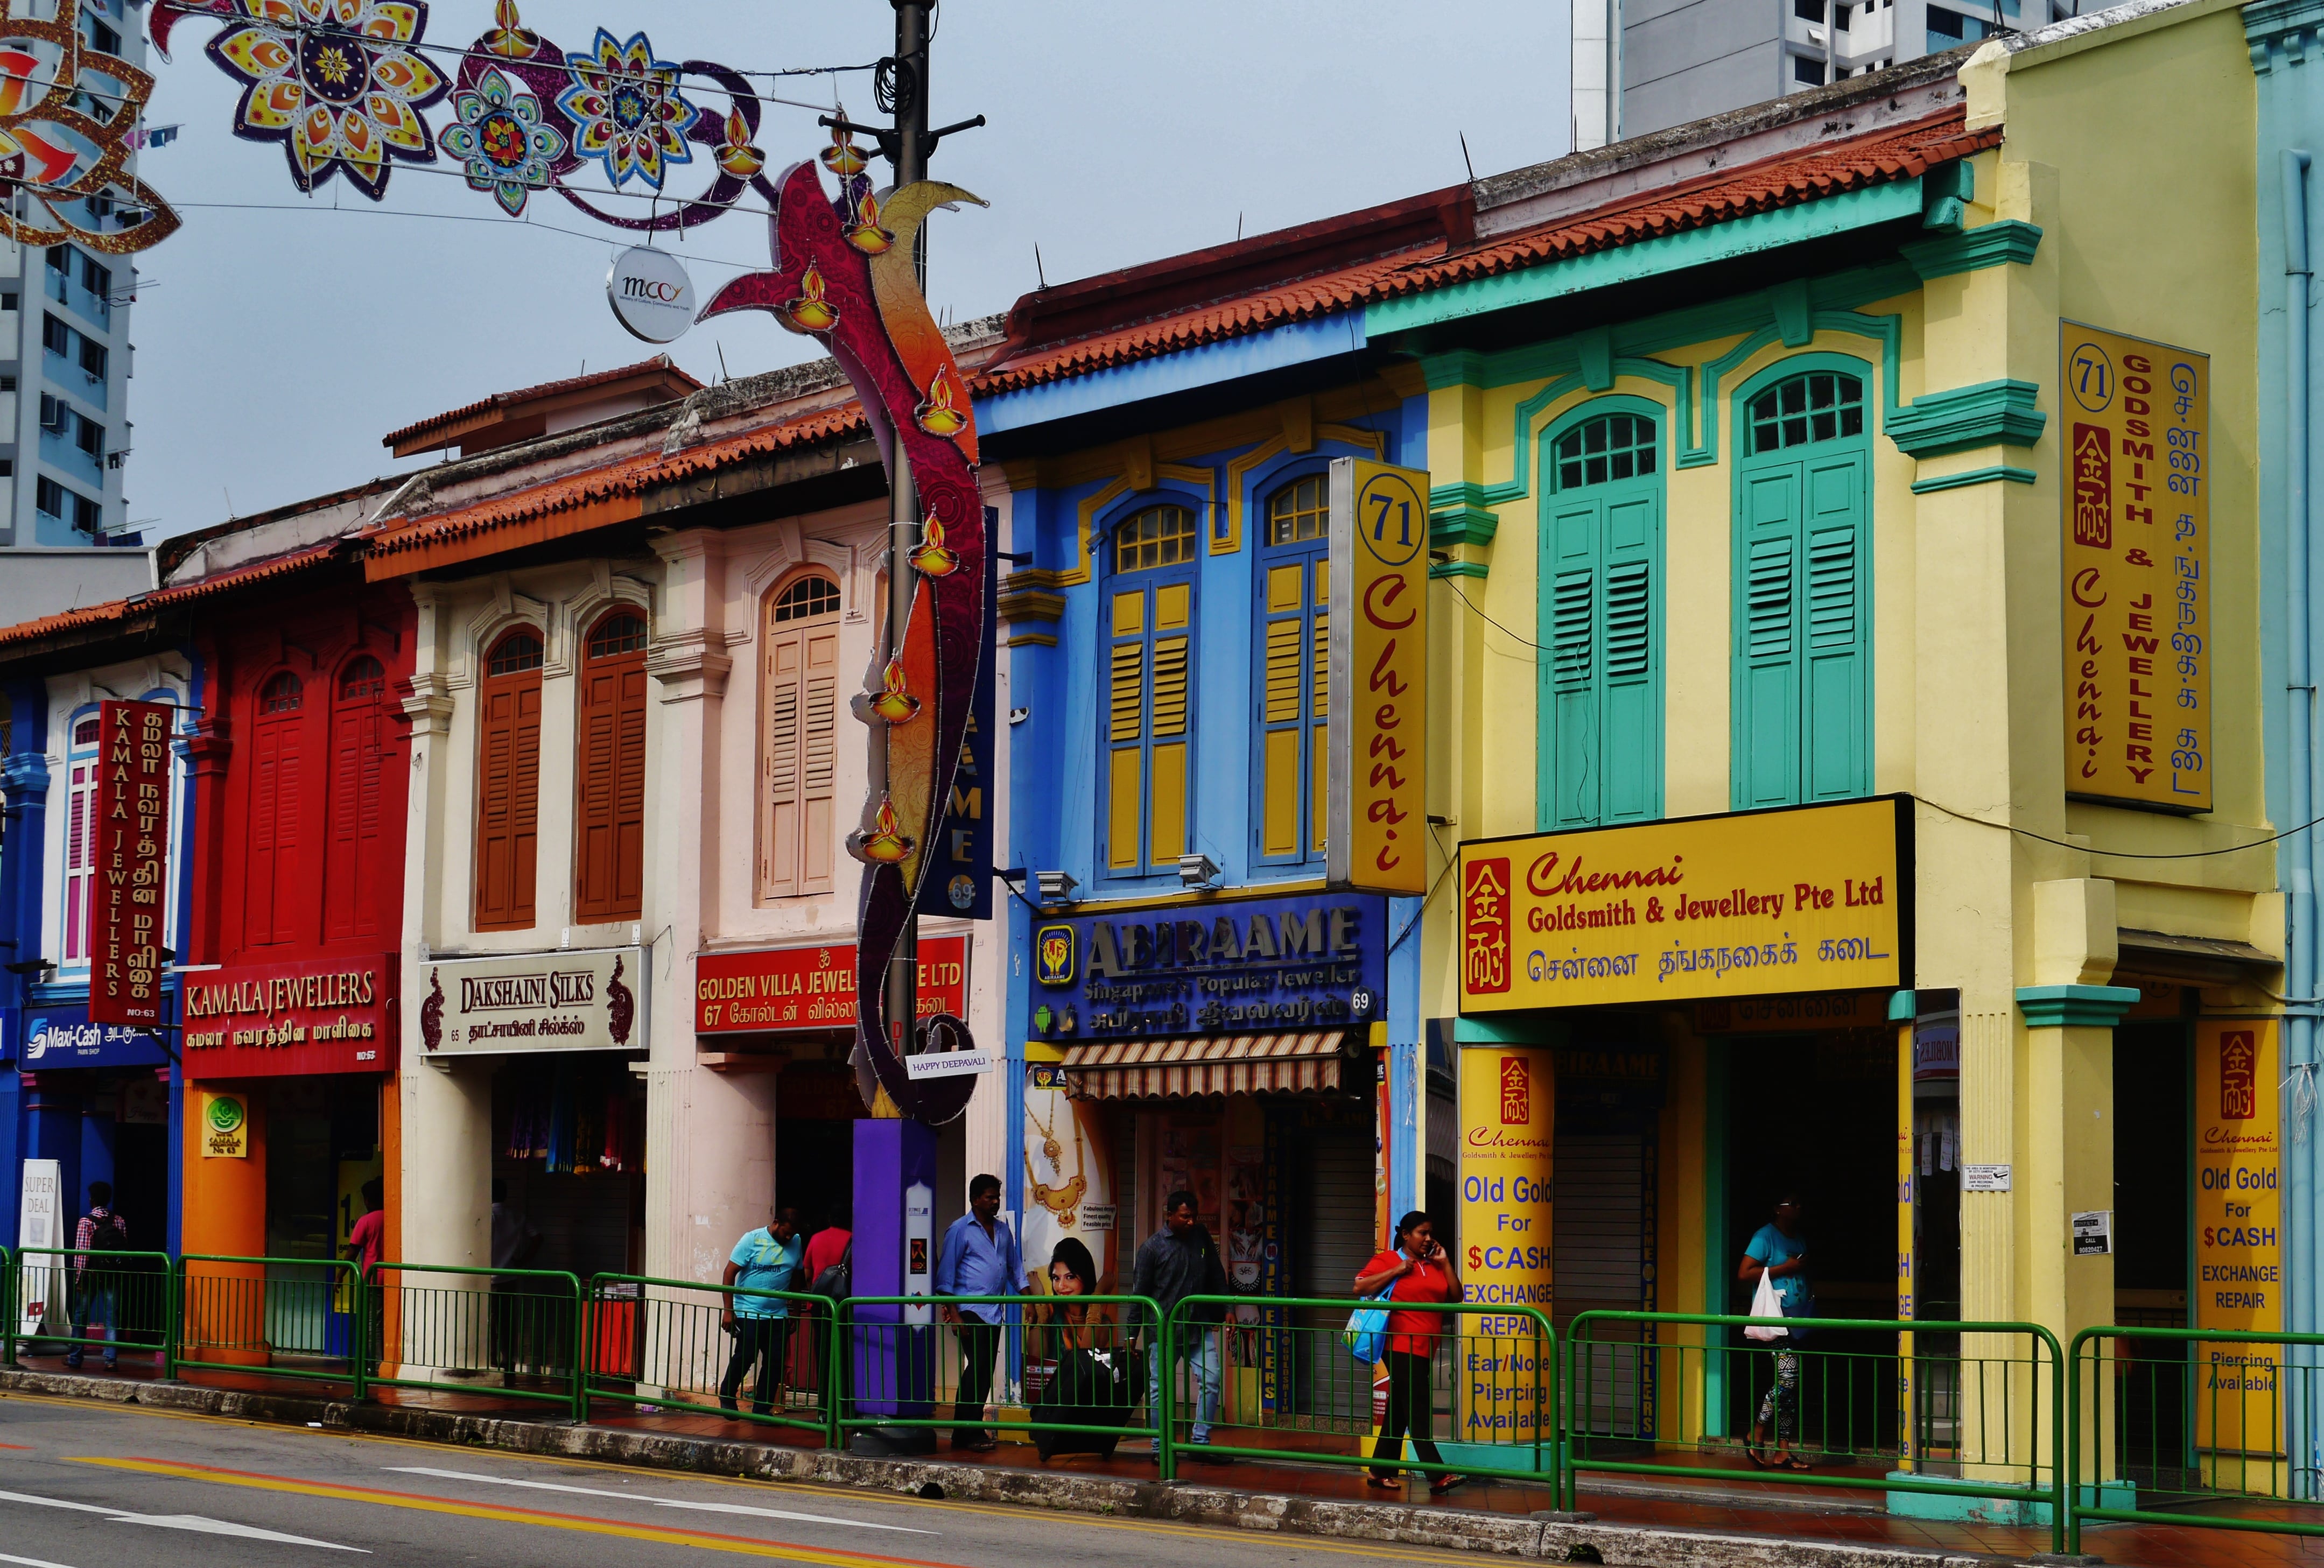
District 8 – a culturally extravagant sector that is home to some of the tastiest restaurants in Singapore (let the cravings begin).
Particular of Indian heritage, you’ll find affordable, yet highly sought-after groceries in the area. From assorted vegetables at road-side grocers to choice meats at the local Tekka market, residents are spoilt for choice in the fresh produce department.
Add in the relatively central location as well as ease of both private and public transport (stemming from that ‘new’ Downtown Line station at Little India), and you can see why that there is demand for property in the area.
It’s 3.52% appreciation figure while modest, is a positive one nonetheless.
Price Movements: $1,479 average psf in January 2015 to $1,531 average psf in December 2019.
#22 – D1 (Boat Quay/Raffles Place/Marina)
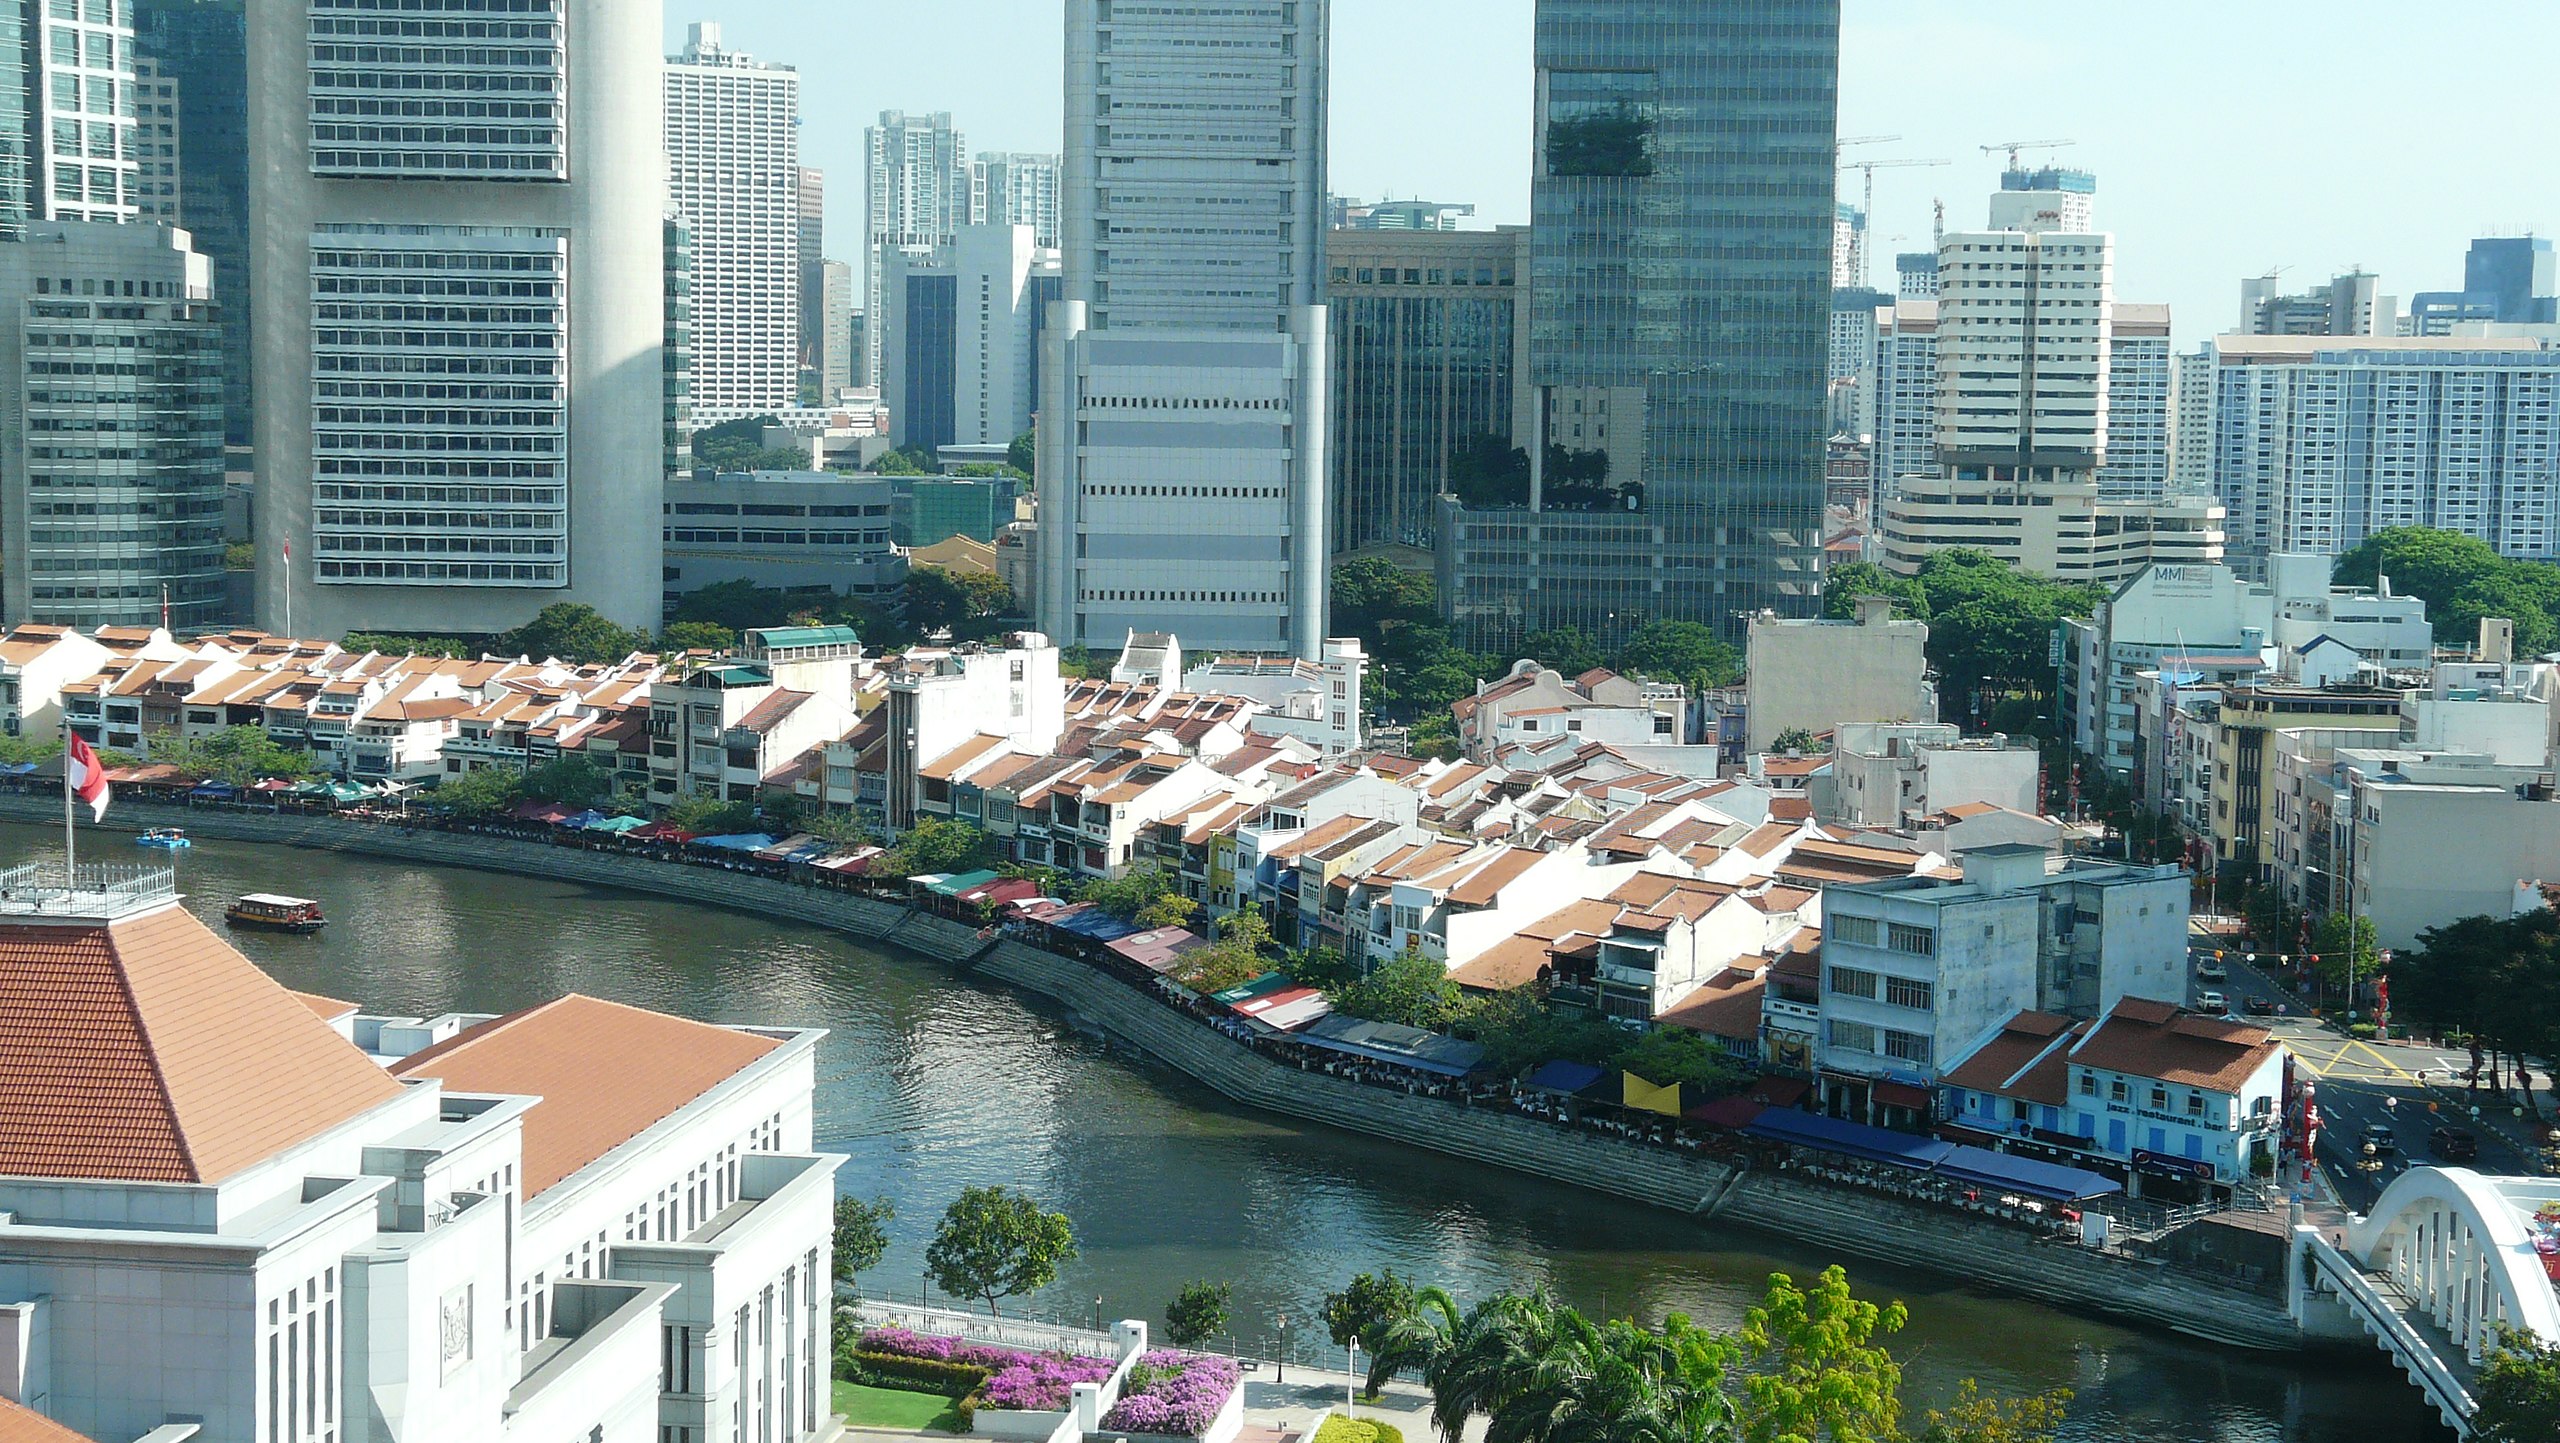
Singapore’s ‘No. 1’ District (or the CBD as we call it) is the homebase of many illustrious companies spread across a string of Grade-A office Towers. It also plays host to a variety of classy riverfront hotels and bars.
While the latter-most is best left for after work hours, the area is also a hotspot for tourists with the presence of authentic food, cultural experiences and more importantly, solid public transport convenience/offerings.
From the Master Plan, you can see that there will be more residential plots in the future – with more emphasis on a work/play/live environment.
Some people might have been thinking that District 1 would have better numbers – but the truth is the sample size for D1 is quite small – you don’t get as many transactions here compared to the rest.
District 1’s appreciation figures: 4.16%.
Price Movements: $2,116 average psf in January 2015 to $2,204 average psf in December 2019.
#21 – D23 (Dairy Farm/Bukit Panjang/Choa Chu Kang)
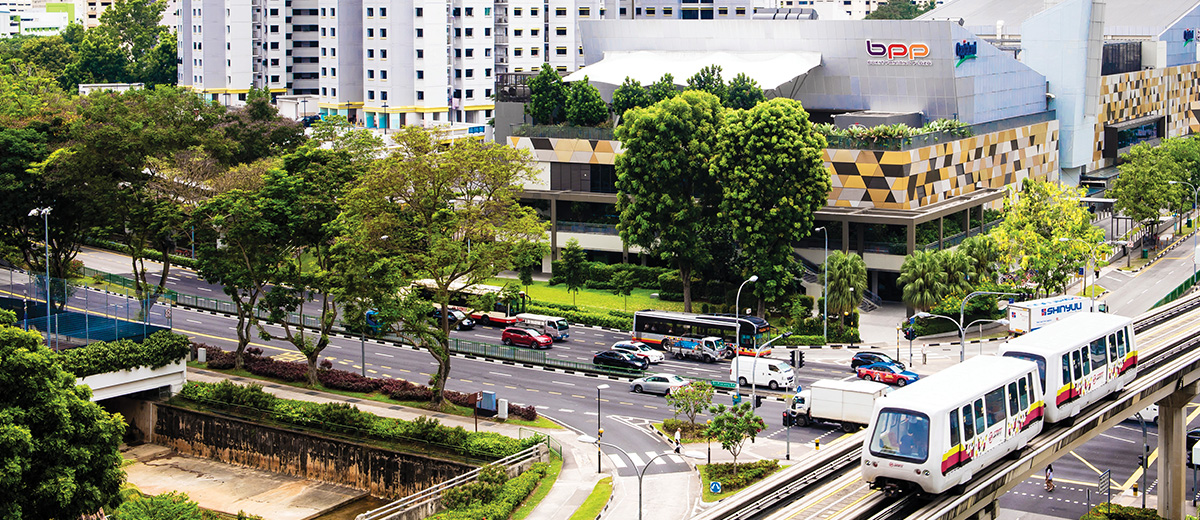
The Dairy Farm area and its surroundings are home to a good mix of old and new private residential developments. This includes the award-winning Tree House condo that even set a Guinness record 5 years back.
More than an abundance of greenery and goats (pardon me) in the area however, there are some interesting mall and culinary offerings, as well as a decent amount of primary/secondary educational institutes in the vicinity.
It now seems so long ago (2015) that the Downtown Line was added to boost connectivity to the area – and that has definitely made District 23 a lot more liveable as an option for people. But the past few years has not seen many new launches since, which has also contributed to the modest appreciation numbers.
District 23’s appreciation figures: 6%.
Price Movements: $983 average psf in January 2015 to $1,042 average psf in December 2019.
#20 – D15 (East Coast/Marine Parade)
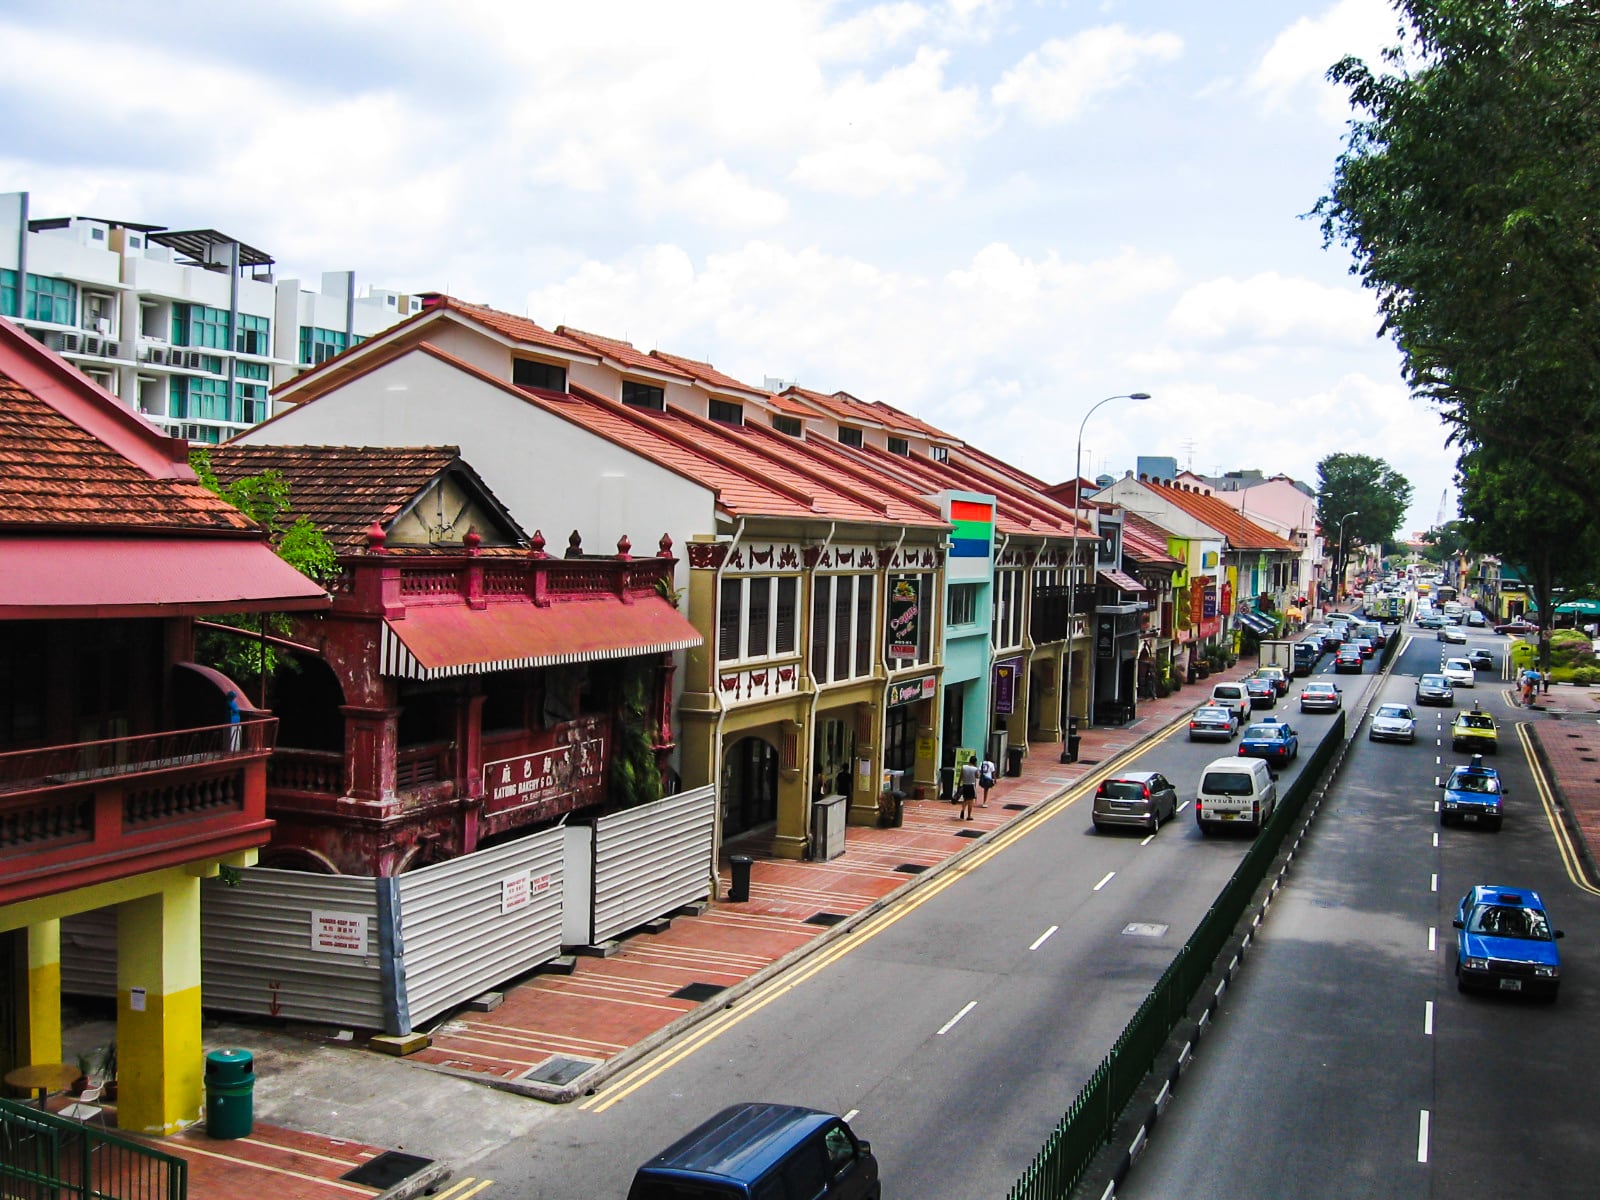
Out of the ‘city’ and toward the sea!
District 15 is home to a diverse amount of freehold developments and was a key instrument/participator in the En Bloc Craze of 17/18’.
One of the resulting developments includes the highly anticipated Meyer Mansion along the illustrious Meyer Road.
Well known for its incredible (unobstructed) views, it is a hotspot for those looking to escape the ‘cluttered’ feeling that is present in all of Singapore’s other RCR districts.
District 15’s appreciation figures: 7.44%.
Price Movements: $1,318 average psf in January 2015 to $1,416 average psf in December 2019.
#19 – D9 (Orchard/River Valley)
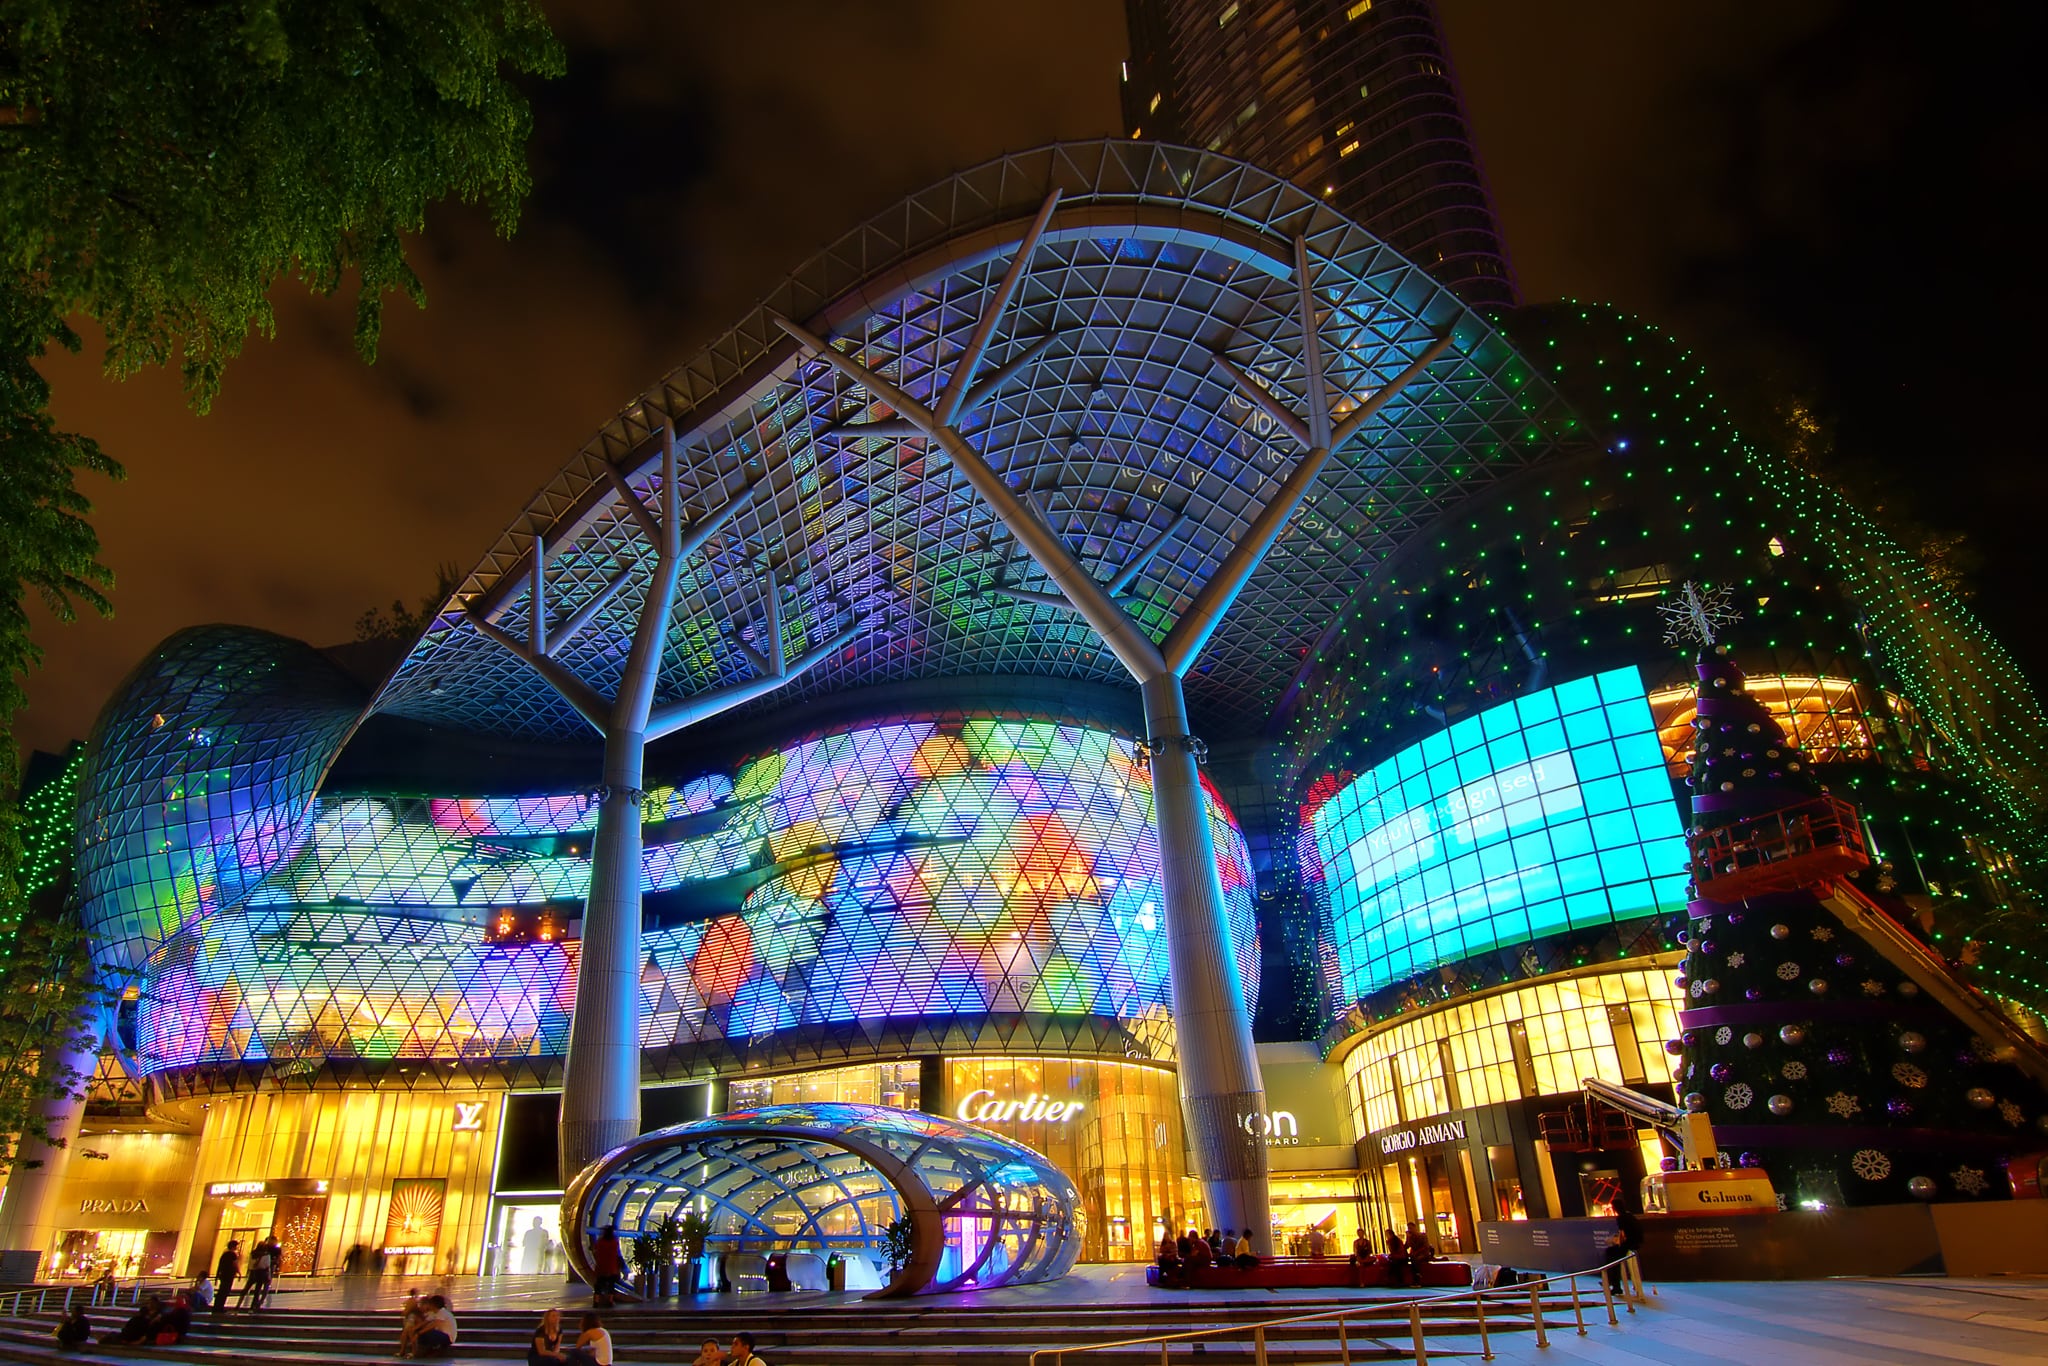
On to Singapore’s glitziest district!
If you’ve been following us for some time, you would have observed that quite a number of our recent reviews like Boulevard 88 and Paterson Suites have been about condos in (or at least surrounding) the area.
Known for its lavish hotels, intense shopping scene and all-out luxurious lifestyle, there is an entire range of freehold developments in the area for one to peruse.
No doubt engineered by tip-top developers, the unique characteristics and architecture that each project offers make them all a spectacle to behold.
As does the entirety of the Orchard Road area in itself.
District 9’s appreciation figures: 9.67%.
Price Movements: $2,057 average psf in January 2015 to $2,256 average psf in December 2019.
#18 – D27 (Sembawang/Yishun)
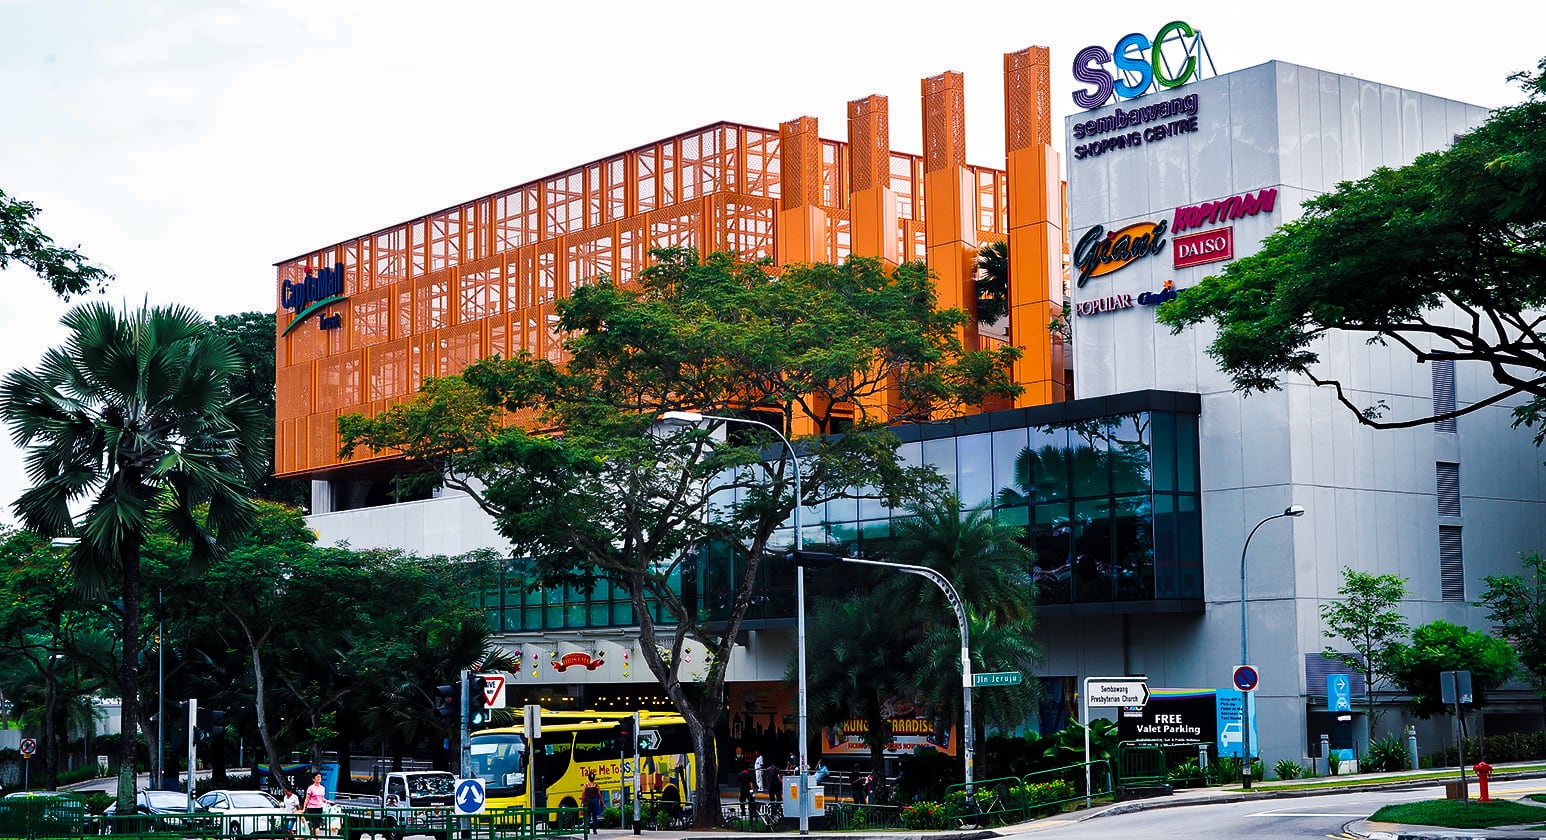
Things are now beginning to heat up in the appreciation department – the first to hit double digits!
We often hear about the crazy things that are happening in the area, and perhaps more interestingly, that it was the president’s home for over 20 years.
With convenient public transport (especially in the bus department) and a variety of malls, neighbourhood shops and educational institutes that range from Primary Schools to Junior Colleges, residents in this heartland will attest to the convenience of the area.
Looking at the numbers, prices in the area have started to trend up in 2018 with new developments like Parc Life, Signature at Yishun, and Kandis Residence.
District 27’s appreciation figures: 10.07%.
Price Movements: $864 average psf in January 2015 to $951 average psf in December 2019.
#17 – D22 (Boon Lay/Jurong/Tuas)
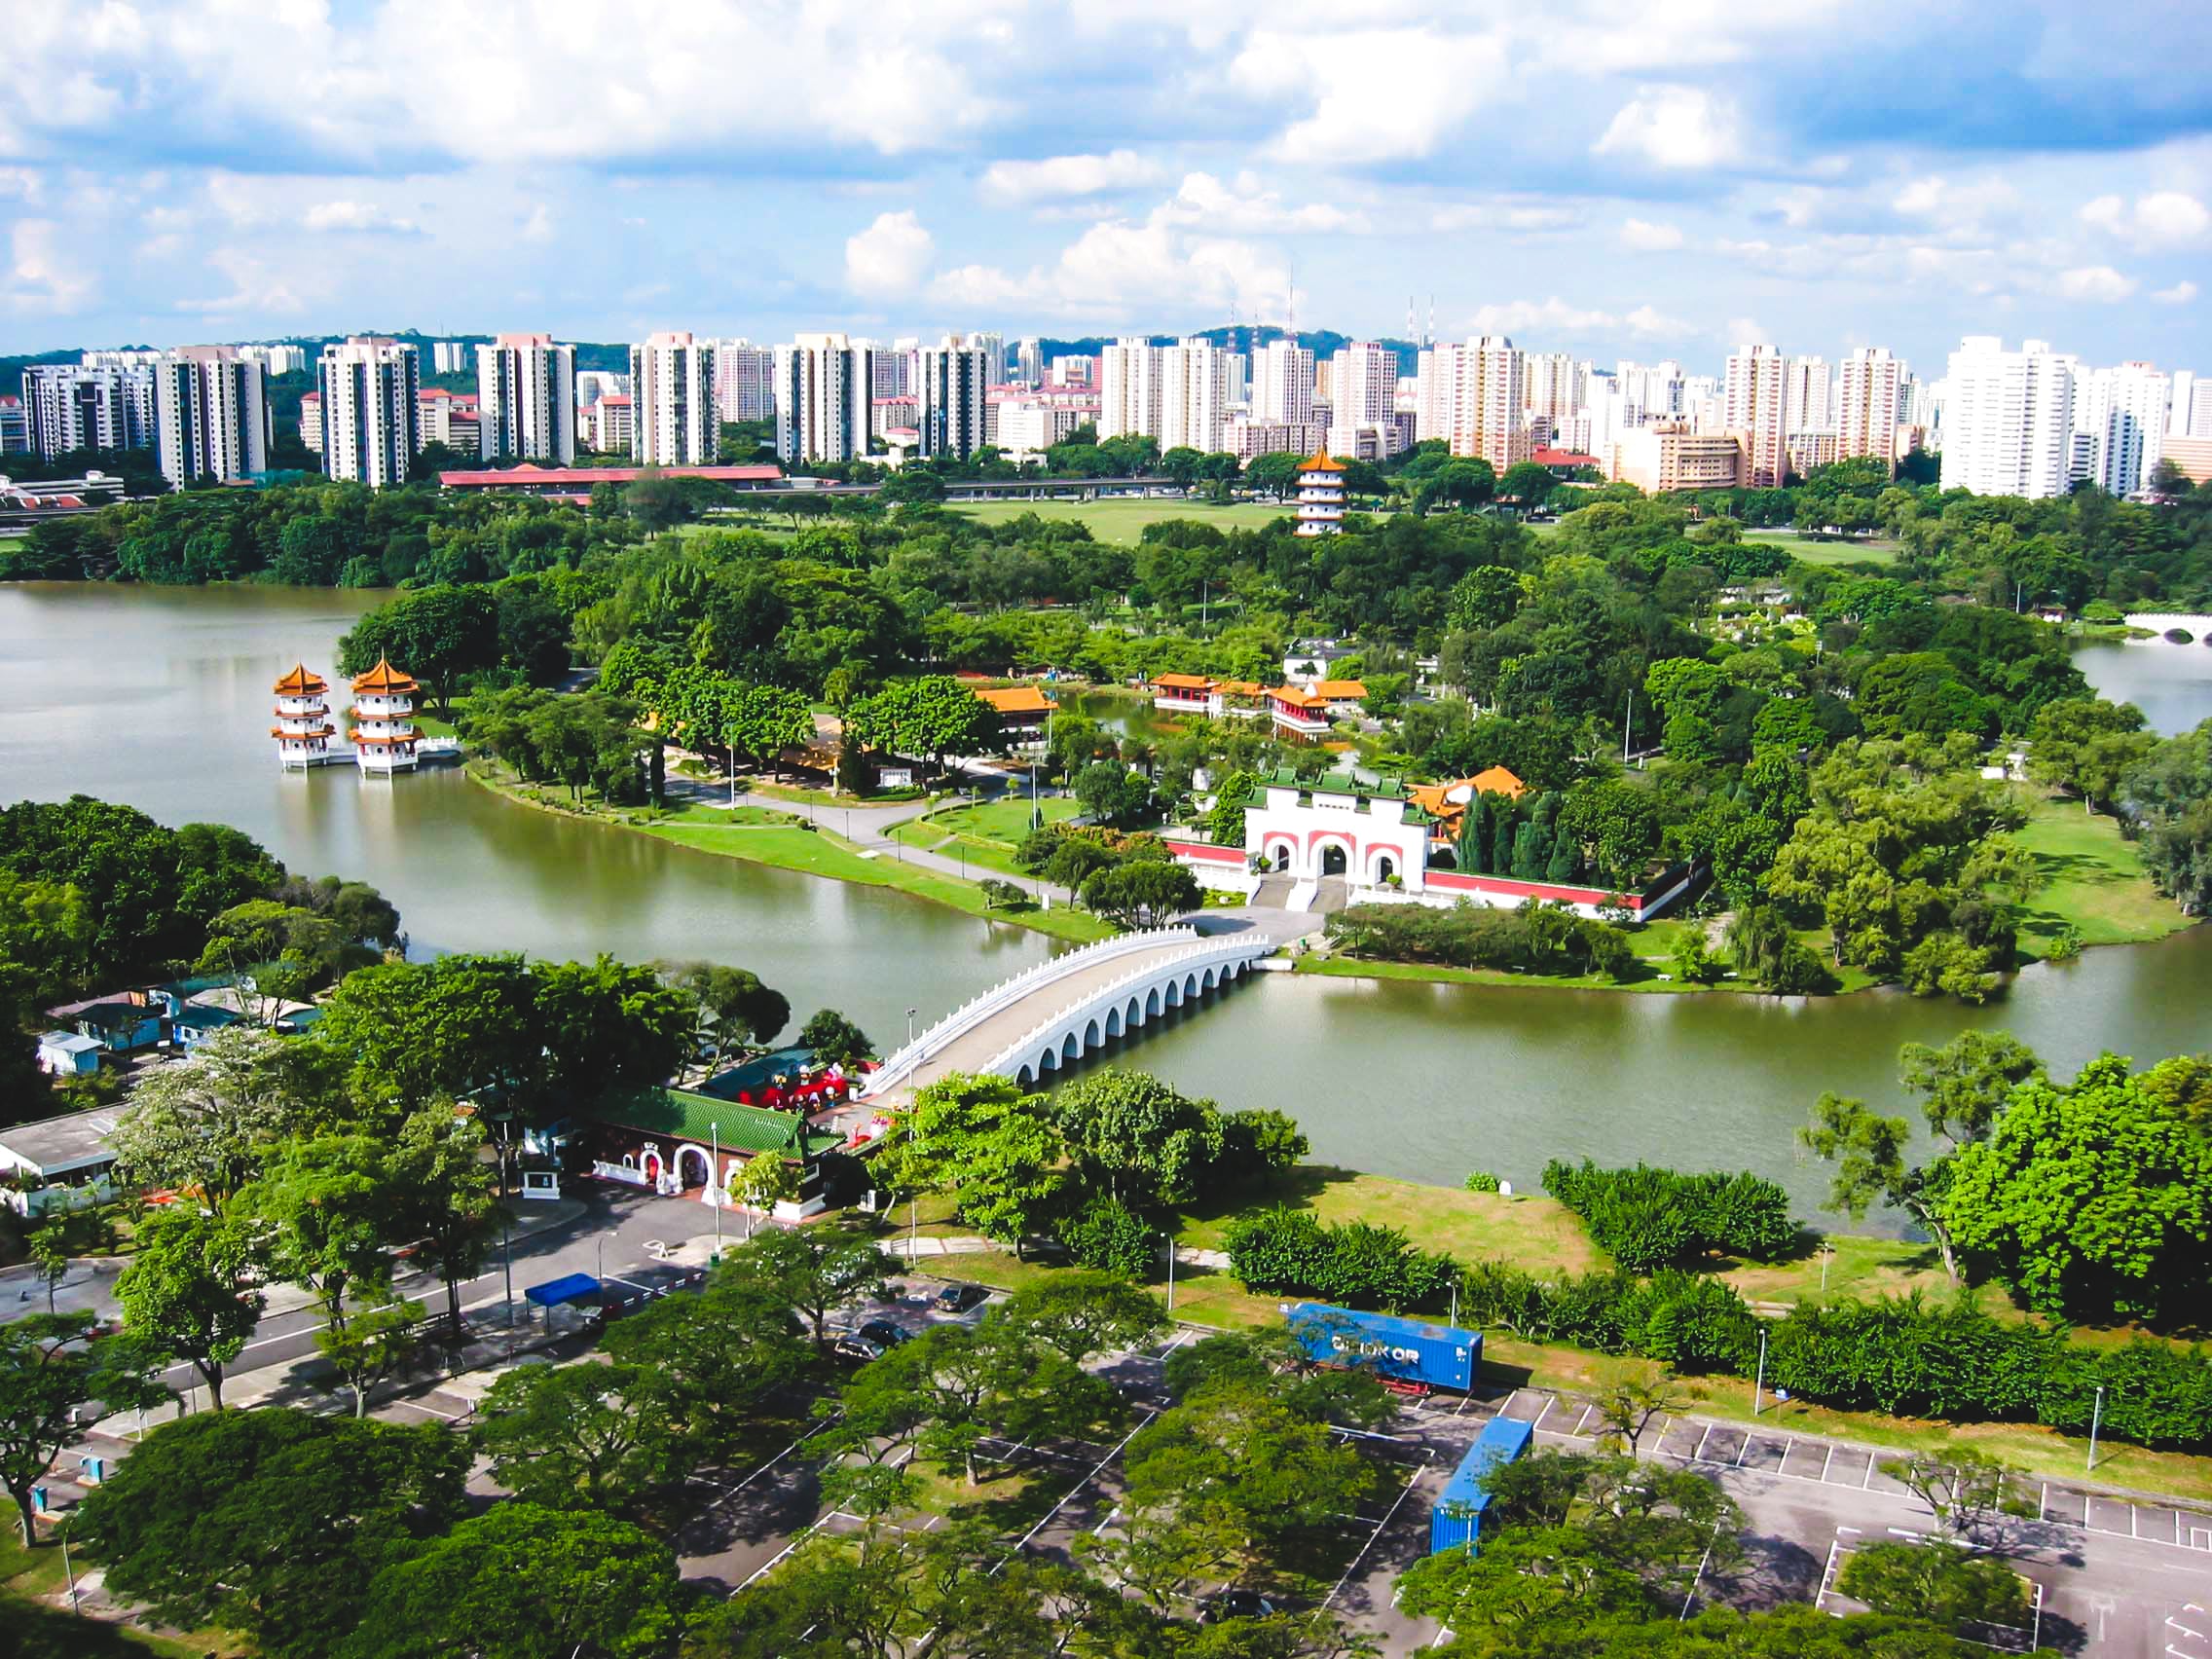
If District 17 is the Eastern Gateway of Singapore, District 22 is its Western counterpart.
But with an entire plethora of upgrades (Jurong Regional Line, Innovation District and Mega Tuas Port) set to rock this part of the city, we’ll definitely be expecting a pickup in housing activity here in the near future.
District 22 appreciation figures: 12.51%.
Price Movements: $927 average psf in January 2015 to $1,043 average psf in December 2019.
#16 – D17 (Changi Airport/Changi Village)
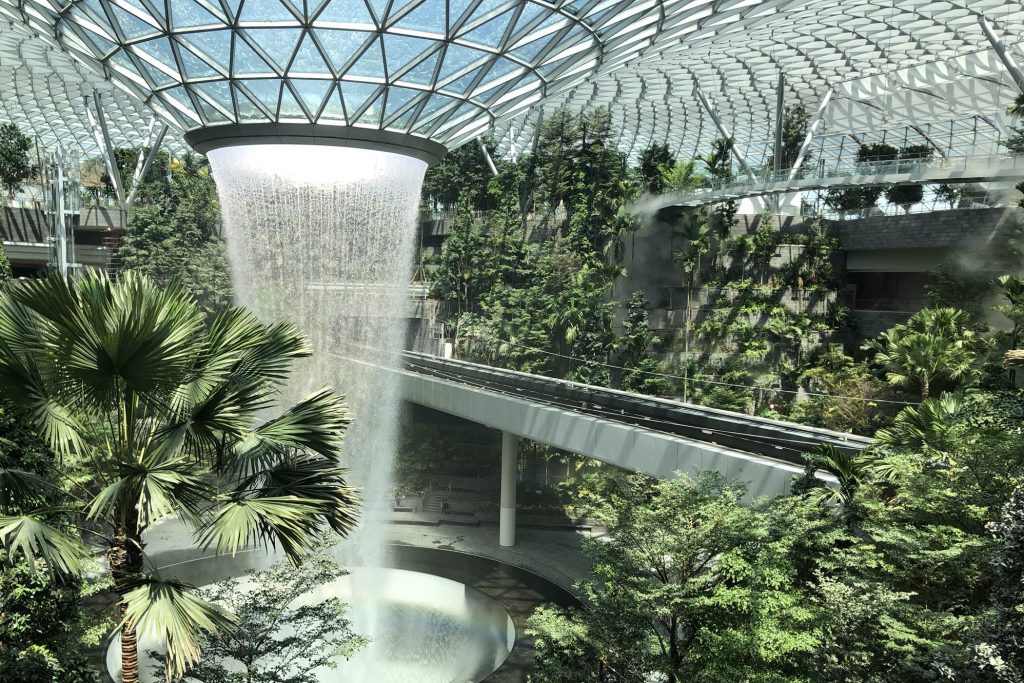
Home to Singapore’s key commercial aviation industry and one of the best hawker centres in town (I’ll attest to that!), this part of eastern Singapore has only started to pick up in 2018 because of the new launches in the area. These include the Jovell, Casa Al Mare, and Parc Komo.
As a side note, rental demand in the area has always been relatively high from staff at the nearby air and marine ports so the region does shine in other real estate sectors.
District 17 has a current appreciation statistic of 13.64%.
Price Movements: $880 average psf in January 2015 to $1,000 average psf in December 2019.
#15 – D26 (Mandai/Upper Thomson)
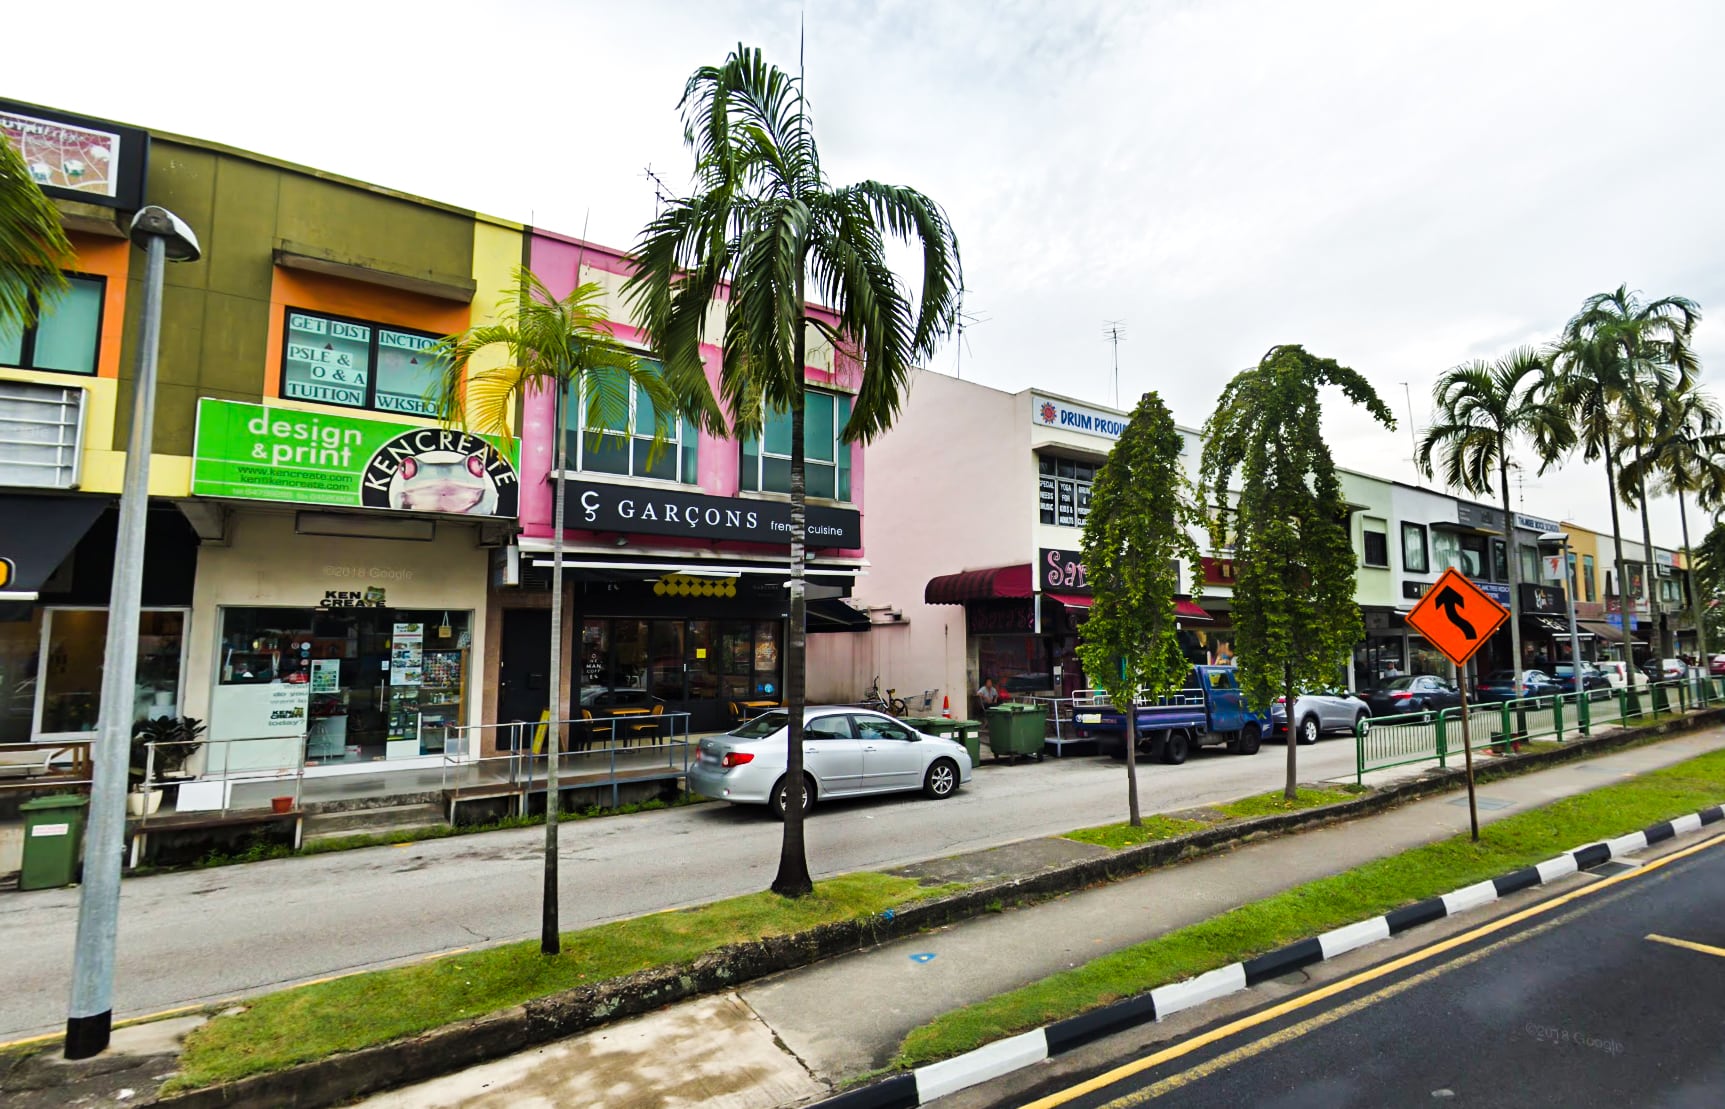
If you did your National Service in Singapore, chances are that you might have crossed into the Mandai/Upper Thomson district.
Suited in a large expanse of green (which is probably why there are so many camps here), the area offers itself a peaceful respite from the hustle and bustle of the city with its numerous quaint shophouses and enclaved eateries.
It is also set to greatly benefit from the Thomson-East Line given its current lack of immediate MRT transportation. Probably one of the reasons for its good appreciation rate of 15.43%.
Price Movements: $901 average psf in January 2015 to $1,040 average psf in December 2019.
#14 – D5 (Buona Vista/West Coast/Clementi New Town)
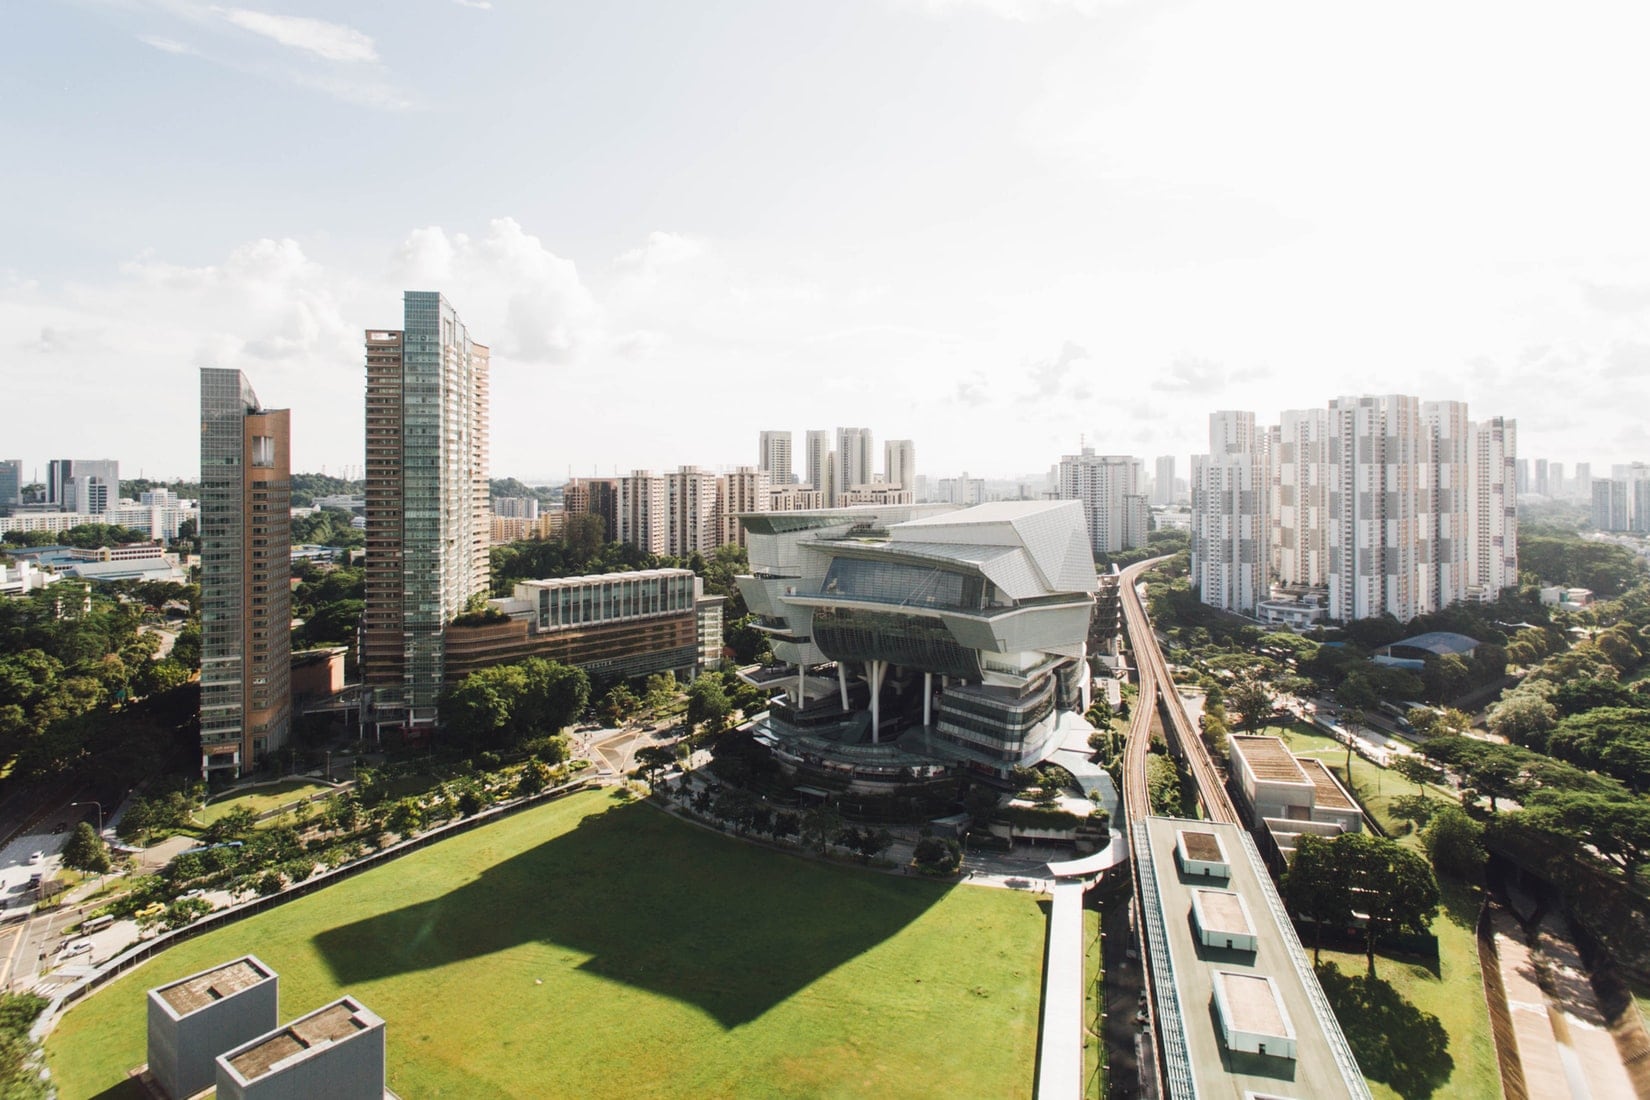
District 5 and District 12 have quite similar characteristics if you think about it.
One big difference, however, is the greater number of educational institutes here.
Interestingly enough however, the fact that we are seeing a better appreciation percentage of 16.19% from District 5 as compared to District 12 is testament to the very healthy demand of residential units in the area.
Price Movements: $1,285 average psf in January 2015 to $1,493 average psf in December 2019.
#13 – D14 (Eunos/Geylang/Paya Lebar)
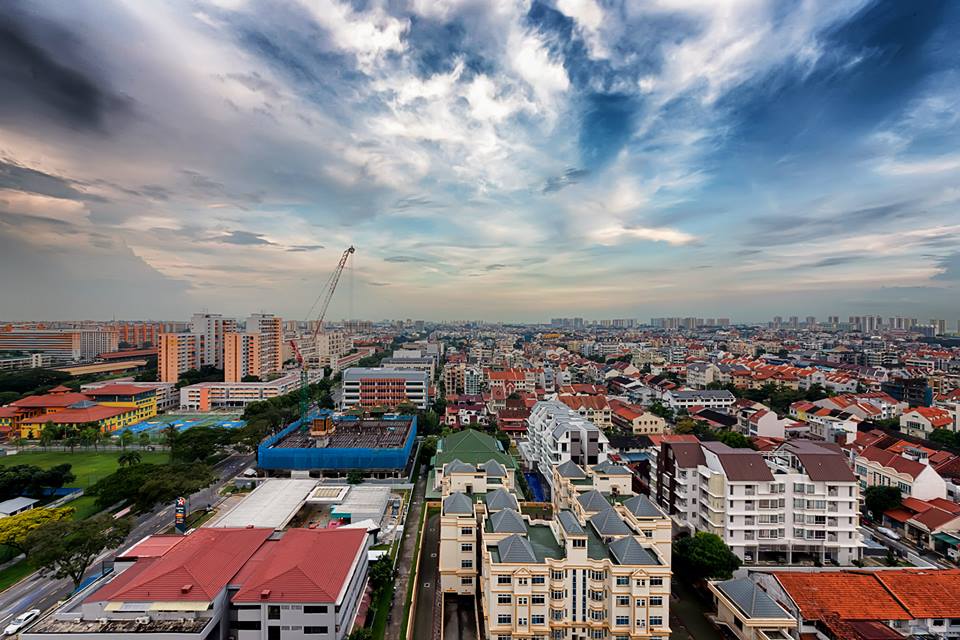
District 14 is hands-down one of Singapore’s most popular city-fringe regions.
It is also set to see massive reconstruction in the coming years. And I’m not just talking about that Paya Lebar airbase move.
In an area where good food, amenities and familiar heritage precincts are abundant, residents here can look forward to new communal/medical facilities, recreational and commercial offerings in the near future.
It is also a relatively close drive to the East Coast Beach area, and the importance of Paya Lebar MRT’s centrality on the area’s demand should not be underestimated.
District 14’s appreciation figures: 19.55%.
Price Movements: $1,294 average psf in January 2015 to $1,547 average psf in December 2019.
#12 – D4 (Sentosa/Harbourfront)

District 4 takes us a little to the south-west of the CBD.
Home to iconic (luxurious) waterfront properties like the Reflections at Keppel Bay, we will soon observe the moving of Keppel Club as well as a range of other developments to make way for over 9,000 new housing units.
This, as part of the Greater Southern Waterfront initiative that is set to roll out in phases over the next 10 years.
District 4 has appreciation figures at 20.12%.
Price Movements: $1,352 average psf in January 2015 to $1,624 average psf in December 2019.
#11 – D11 (Newton/Novena)
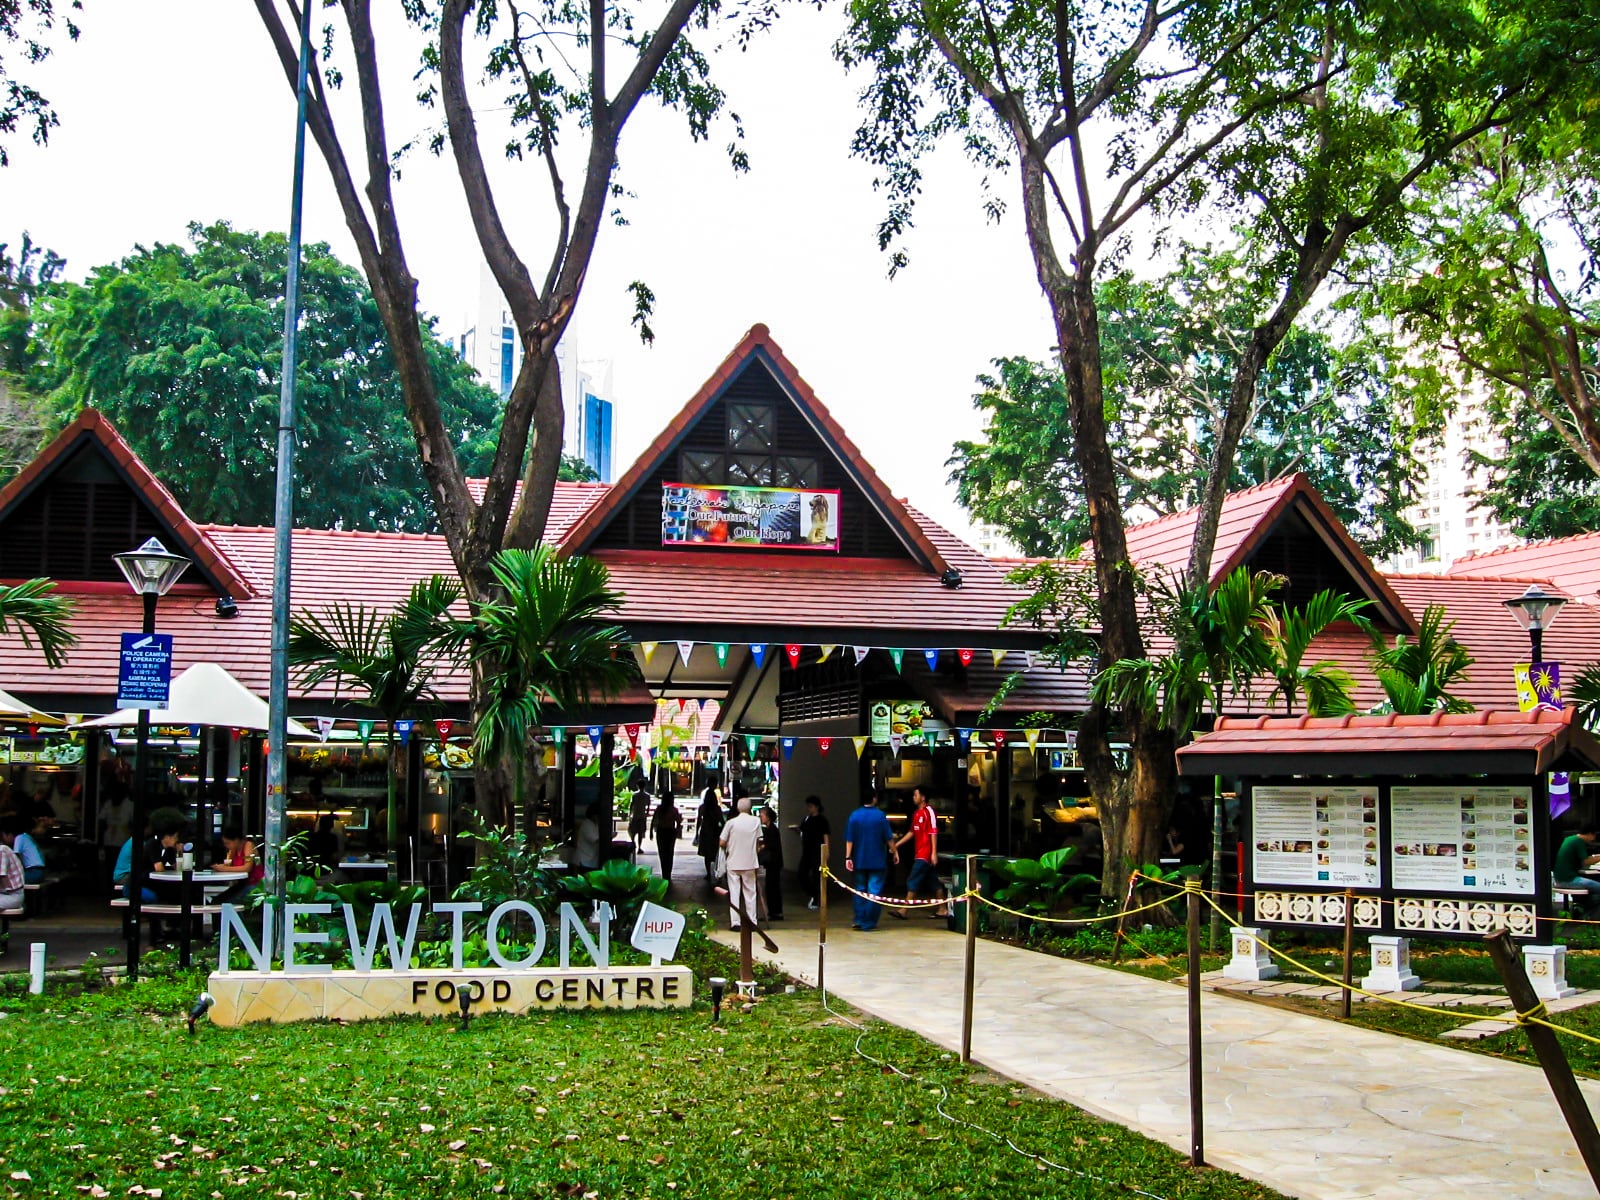
Famous for its diversity (and expertise) of medical services in the area, the Newton/Novena district is one that we’ve also increasingly covered in recent times.
Some of its residential developments include Park Infinia at Wee Nam as well as our recently visited Trilight Condo.
Considering the high demand and pockets of reserved space in this (very) central area, it would not come as a surprise if we saw a couple more developments in the area in the coming years.
Of course, appreciation rates could then look to increase past its current figure of 20.16%.
Price Movements: $1,468 average psf in January 2015 to $1,764 average psf in December 2019.
#10 – D18 (Pasir Ris/Tampines)
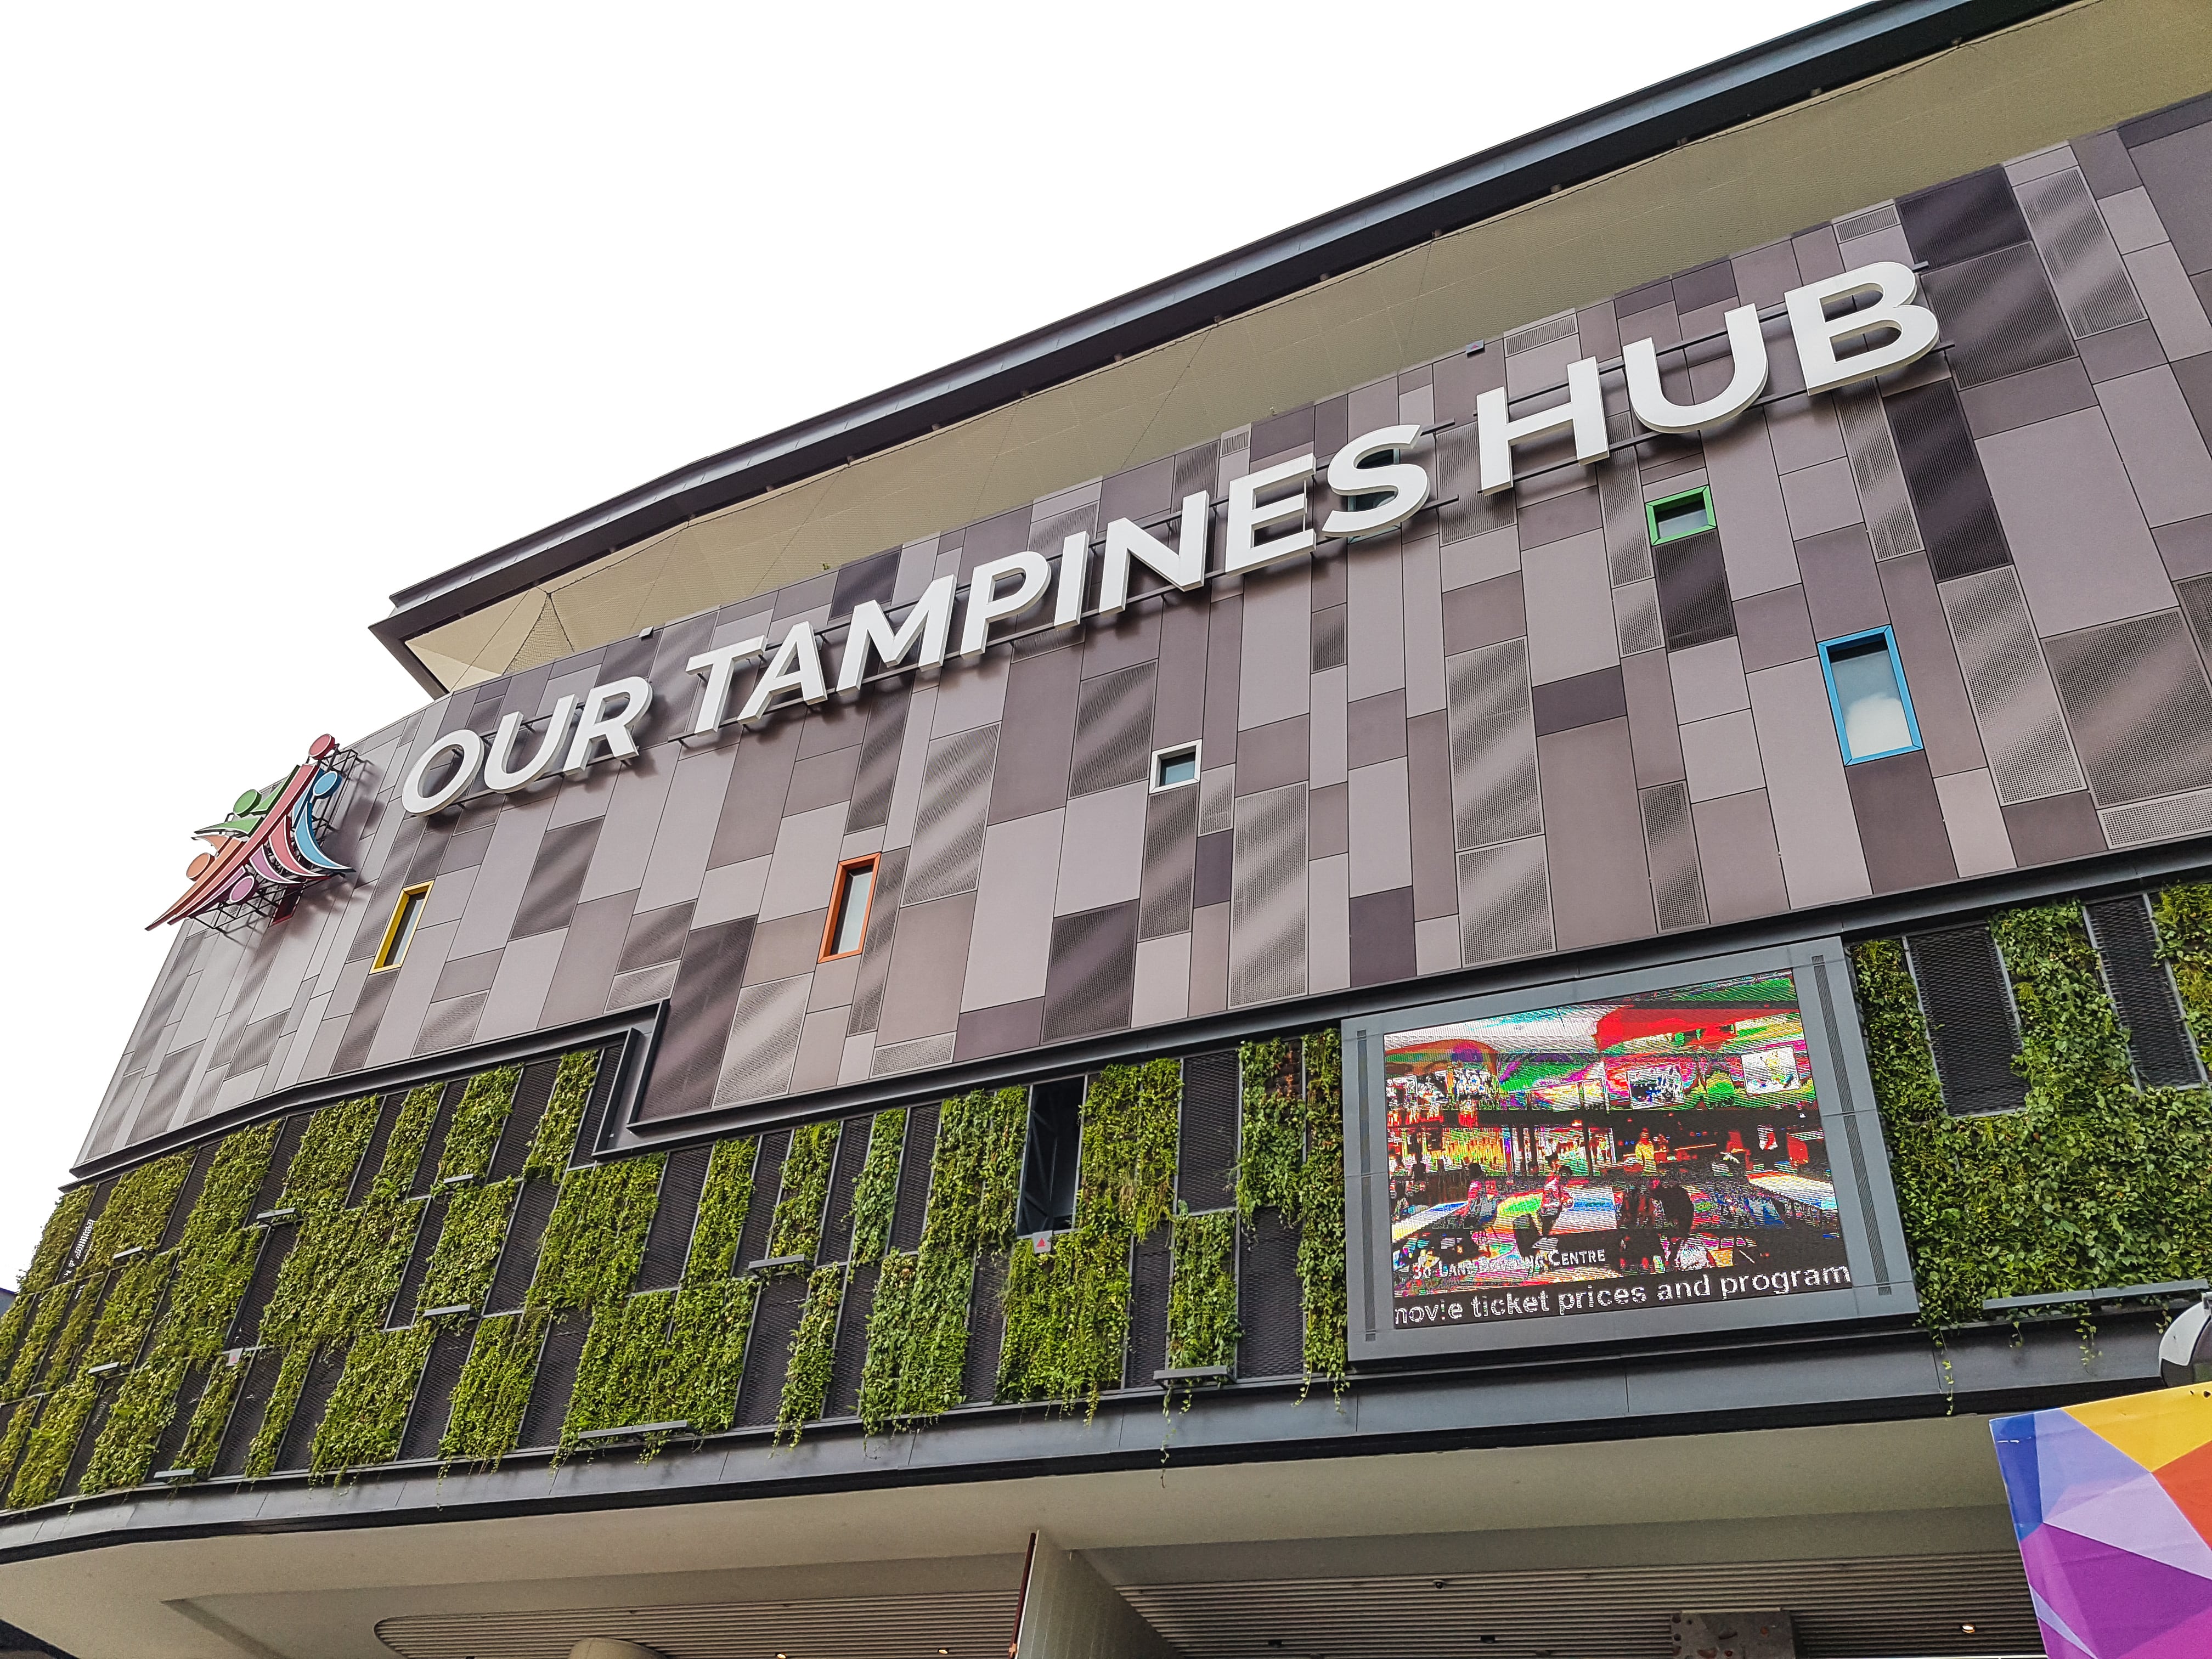
Granted, it lacks much residential unit seclusion, or even good proximity to the city centre for that matter (which naturally explains the area’s lower PSF), but there are incredible amenities in this part of town nearly unmatched by most other districts.
Not to mention, it’s proximity to both the Changi Airport and the East Coast recreation area.
What’s more, with the entire Downtown East and Tampines cluster of malls at residents disposals, there is a famous saying that “those in the east never venture out of their homes”.
Add in the recently implemented Downtown Line stations, upcoming Pasir Ris Water Fab Park (contributing to increased jobs) as well as Circle Line stations, and you can see why District 18 has done well for itself.
District 18 has an 20.52% appreciation score.
Price Movements: $931 average psf in January 2015 to $1,122 average psf in December 2019.
#9 – D13 (Macpherson/Potong Pasir)
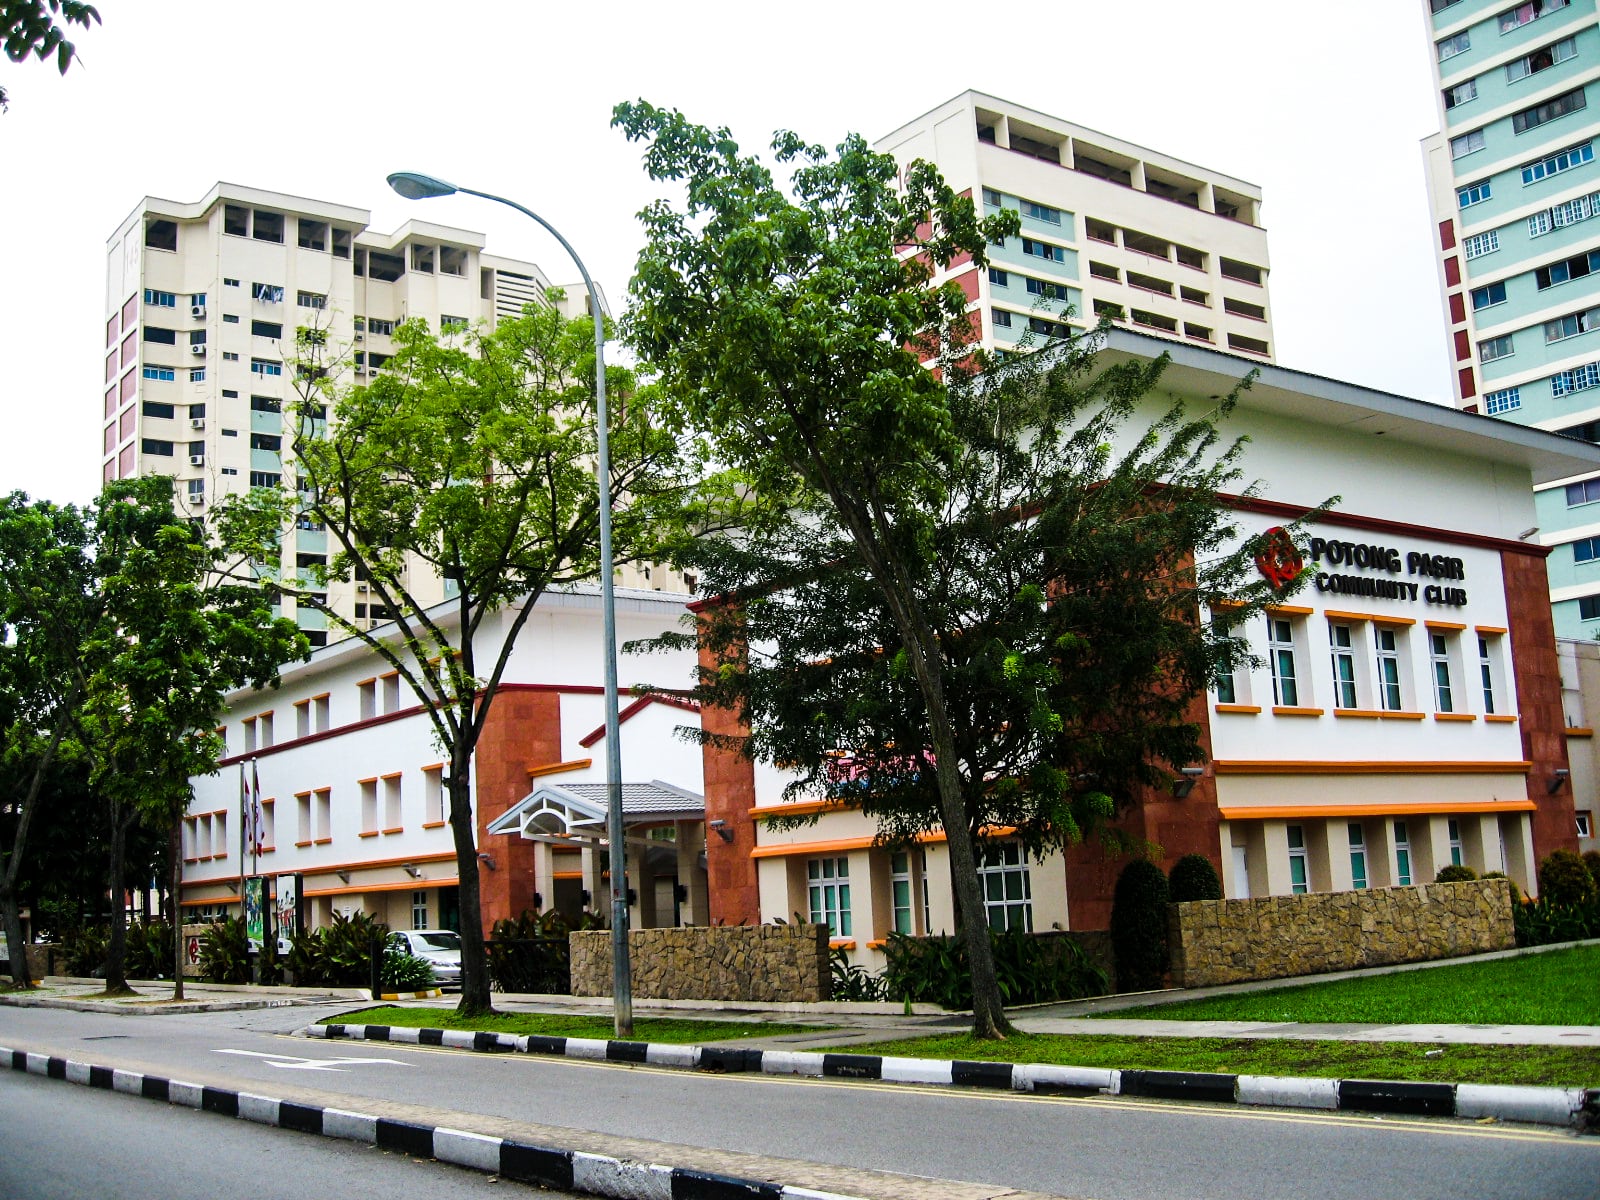
If you had managed to catch the piece we wrote a couple months back on integrated developments, you’ll realise that The Poiz Residence (at Potong Pasir) was actually the 2nd worst integrated development appreciator in the whole of Singapore at that time.
Given the situation, we predicted a price rise in the near future, citing it as a great option for investment based on its then current psf of $1,388.
True enough, two back to back sales right off the end of last year and the beginning of this one averaged $1,759 psf – engineering a drastic $379 psf jump in just over a few months.
While the project’s long-term appreciation trend does remain to be seen, it has no doubt contributed to the area’s solid appreciation rate of 20.96% in the meanwhile.
Price Movements: $1,317 average psf in January 2015 to $1,593 average psf in December 2019.
#8 – D21 (Clementi Park/Upper Bukit Timah)

Unlike its glamorous partner, D10 (which we will touch on soon enough), the Clementi Park/Upper Bukit Timah area is a tad scaled down.
For many post/existing students, the presence of Ngee Ann Polytechnic, Bukit Timah Plaza and the Beauty World/Centre food district will ring a familiar (and heartwarming) bell.
A couple of GCB clusters located along the Clementi Park area is also set to be positively impacted by the walking/cycling corridor implementation along Sunset Way.
In fact, it is highly likely that the pathways will link up with Coast-to-Coast trail and Rail Corridor – making for an incredible recreational opportunity for residents here.
District 21’s appreciation figures: 26.73%.
Price Movements: $1,141 average psf in January 2015 to $1,446 average psf in December 2019.
#7 – D28 (Seletar/Yio Chu Kang)
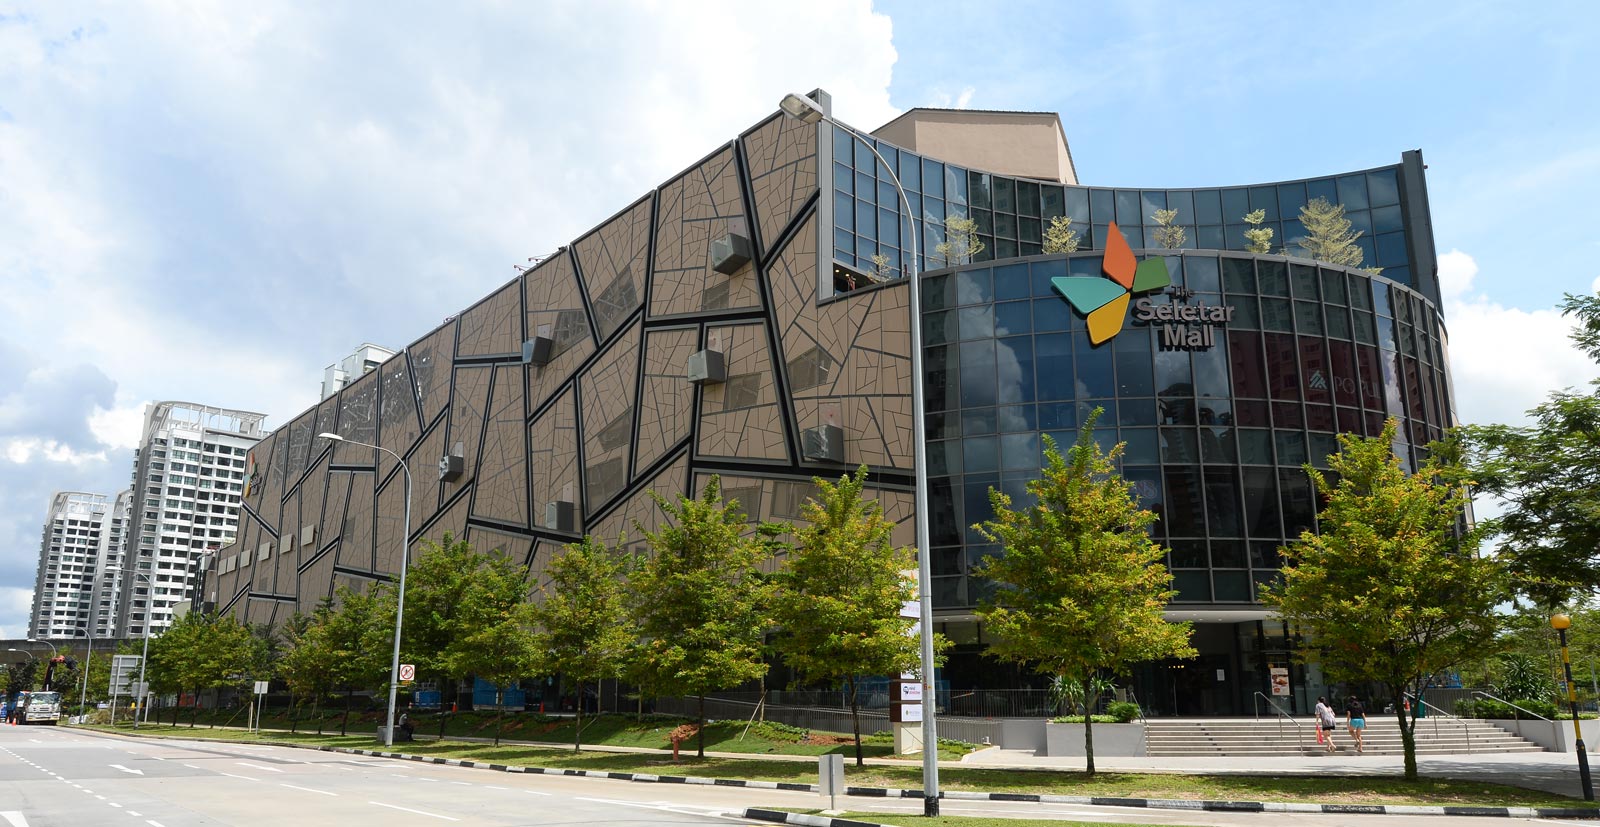
Seeing how high it is on the list, there is surprisingly almost no news about District 28 on the 2019 Masterplan.
Perhaps the biggest pull from the Seletar area comes from its serenity.
With lush spaces and numerous nature offerings (think the entire Upper/Lower Seletar Reservoir area), as well as numerous country clubs like Seletar Base and Seletar Country Club Golf Course (no doubt stemming from the green spaces), it is easy to see both the appeal and potential of the place.
On the other hand, Yio Chu Kang offers itself as a distinct comparison with its convenient bus interchange, public sports facility megahub and numerous well-ranked schools in the area (ranging from primary to tertiary).
Prices in District 28 was the 10th lowest in all the district back in January 2015 at $981 psf.
With a 29.46% climb in half a decade, it is one of those districts that surprised me on this list.
Price Movements: $981 average psf in January 2015 to $1,270 average psf in December 2019.
#6 – D3 (Alexandra/Commonwealth)
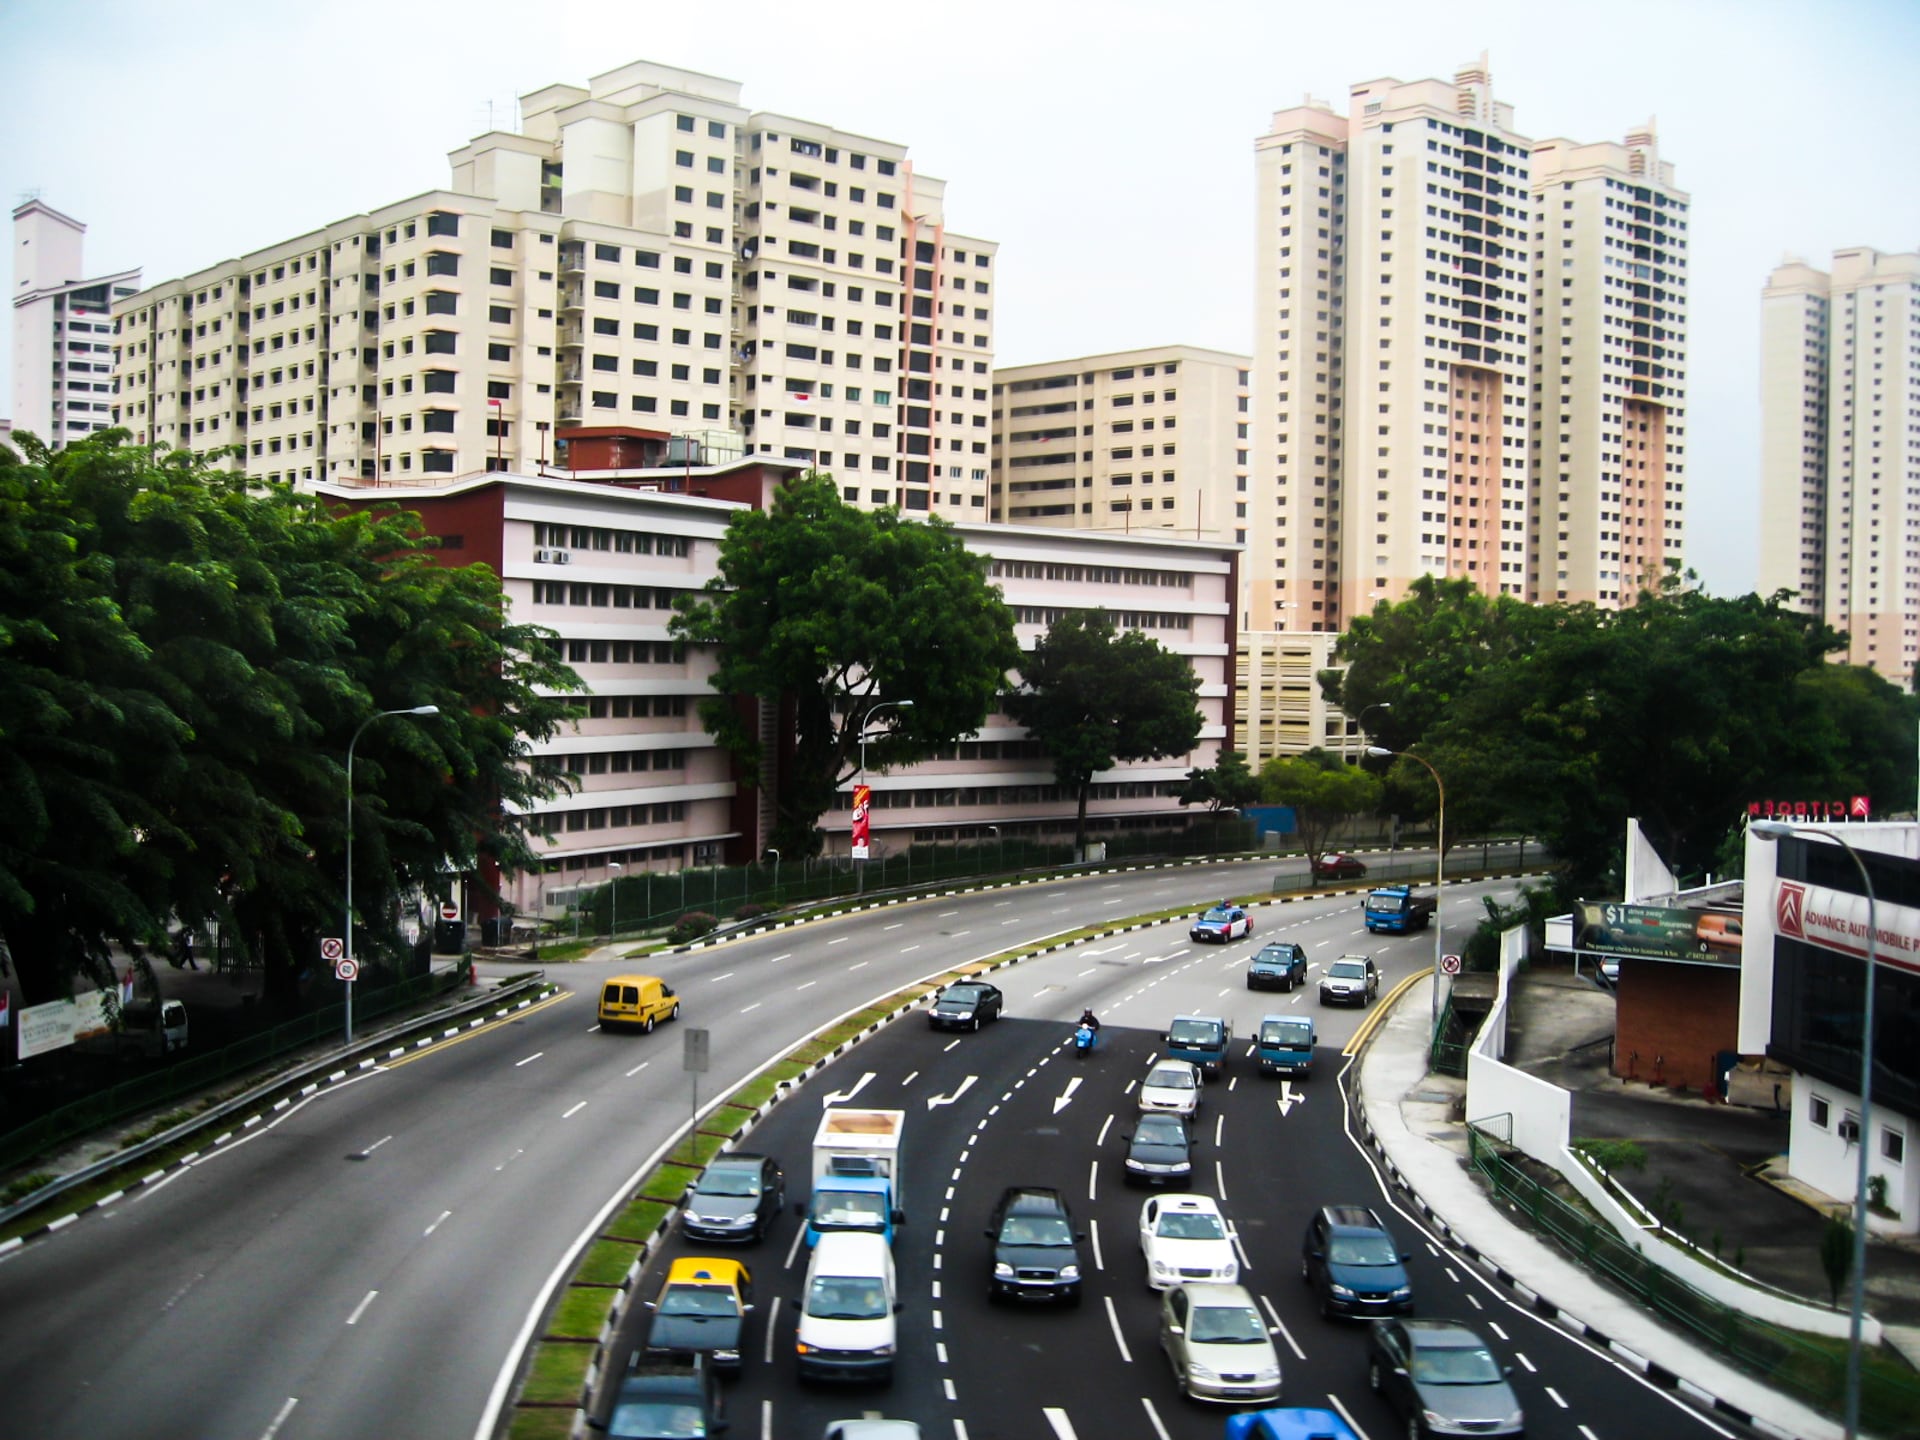
Those who studied in the numerous educational institutes in the area would attest to the convenience of the Alexandra/Commonwealth district.
Made famous by the Alexandra Ikea and Queensway Shopping Centre (sport fans you might recall the place), the district offers a good mix of retail, food and residential options (such as the Interlace) amidst abundant nature spaces in the south.
The AYE also serves ‘locals’ well, allowing enhanced connectivity to the core central regions.
It’s no real surprise that District 3 has such health appreciation figures – no thanks in part to the numerous new launches in the area in recent years. Just off the top of my head: Commonwealth Towers, Queens Peak, Margaret Ville, Artra, Echelon, Ascentia Sky, The Crest, and Principal Garden.
District 3’s appreciation figures: 31.08%.
Price Movements: $1,477 average psf in January 2015 to $1,936 average psf in December 2019.
#5 – D20 (Ang Mo Kio/Bishan/Thomson)
And we’ve officially cracked the top 5!
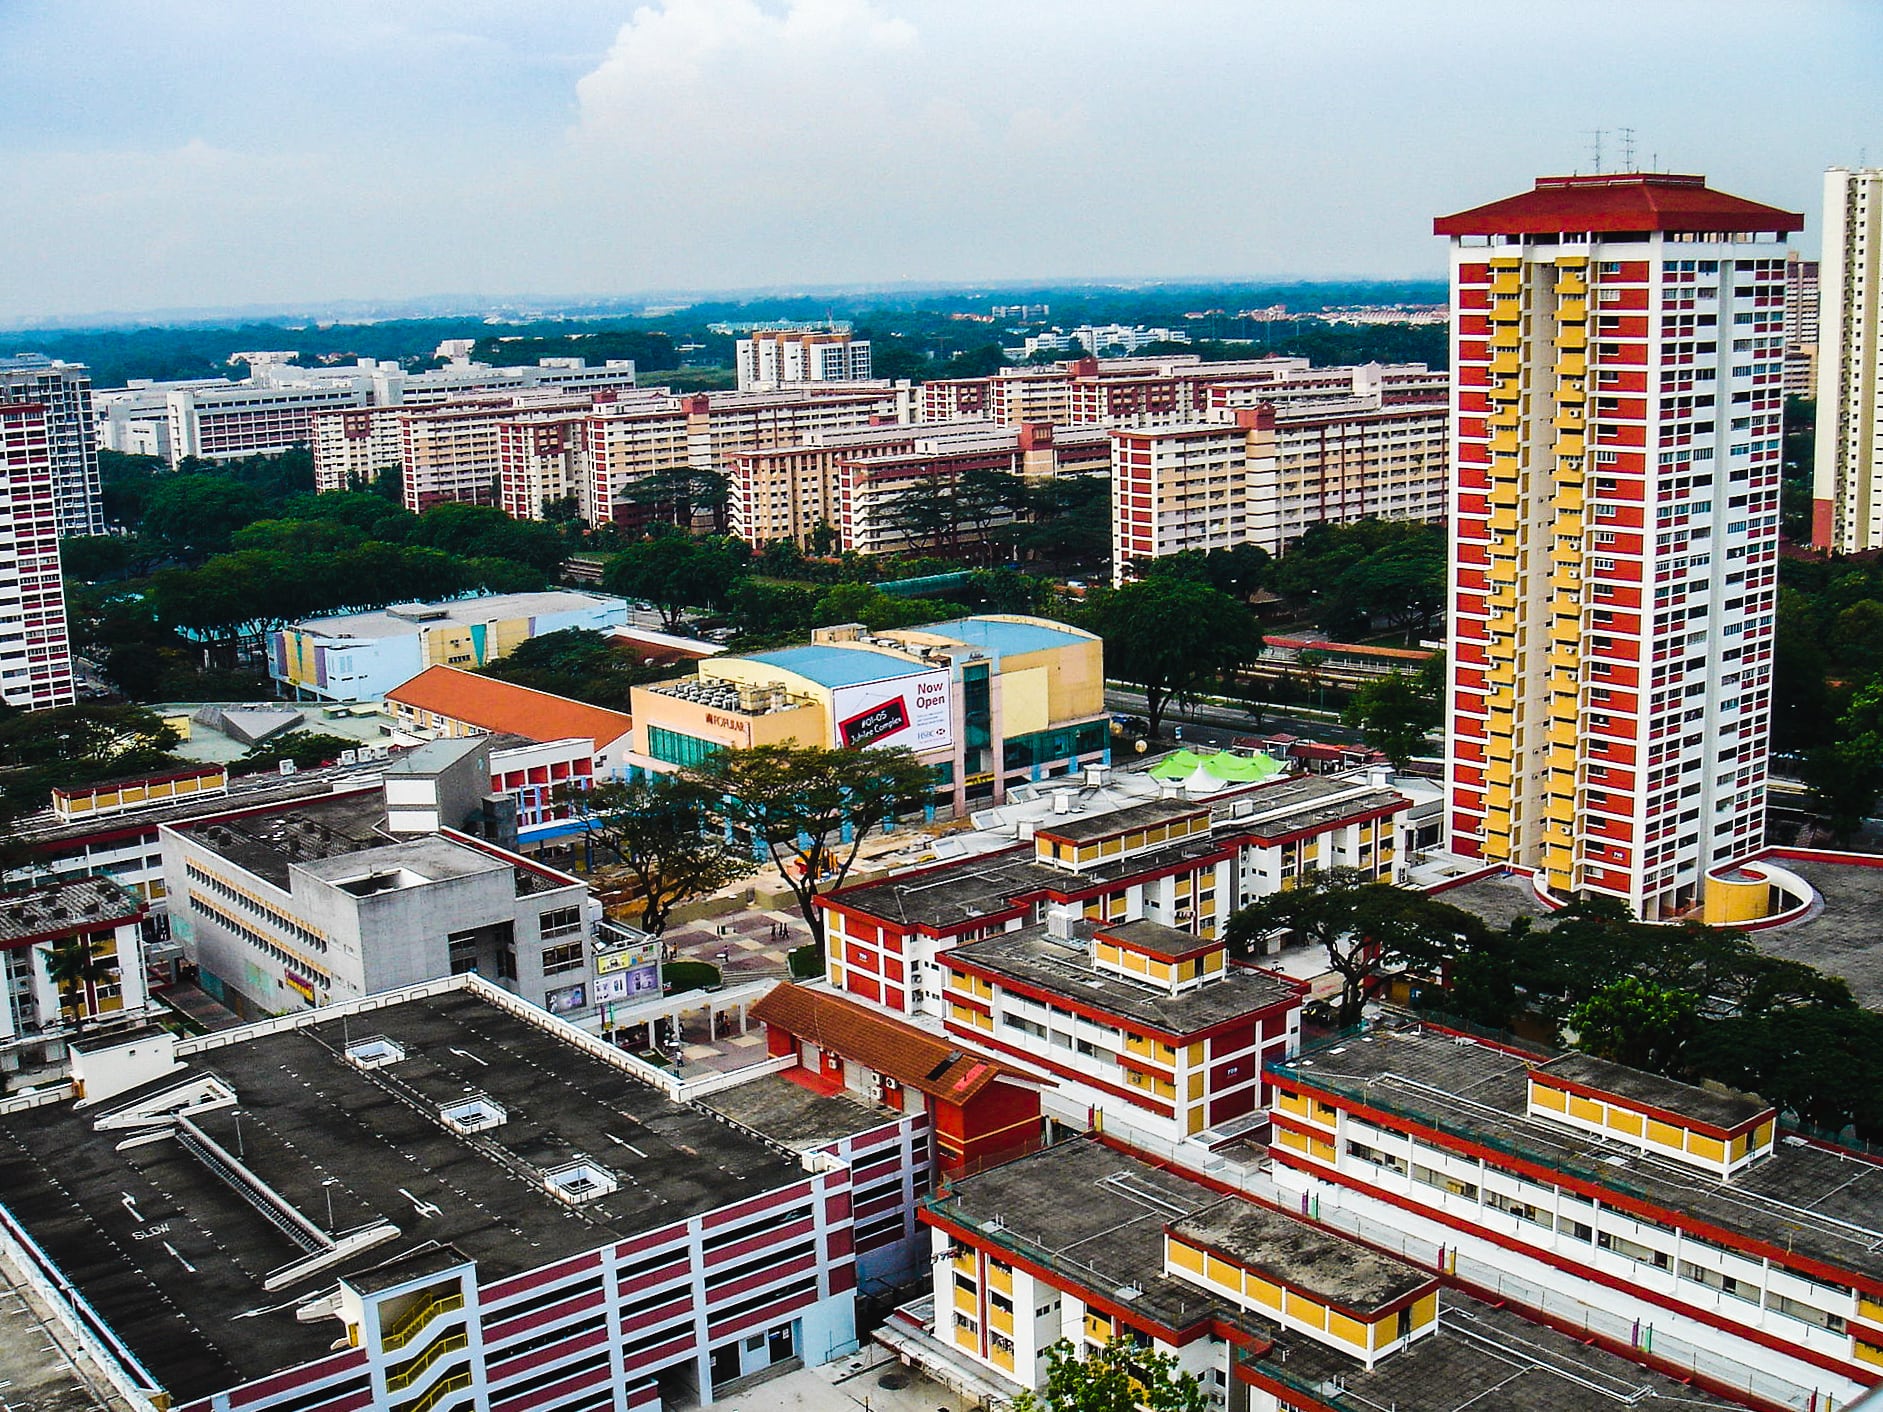
Setting the tone is the Ang Mo Kio region, which, similar to the Yishun district (D27) we discussed earlier, has an entire offering of malls, educational institutes as well as incredible public transport convenience which is about to get a whole lot better.
In fact, with the impending Thomson-East Line/Cross Island Line (which will add 2 new MRT stations to Ang Mo Kio), and the already massively utilised central Ang Mo Kio/Bishan MRT station and bus interchange, it wouldn’t be surprising if we went on to see further appreciation in this OCR area in the near future.
District 20’s appreciation figures: 34.70%.
Price Movements: $1,306 average psf in January 2015 to $1,614 average psf in December 2019.
#4 – D19 (Hougang/Punggol/Sengkang)
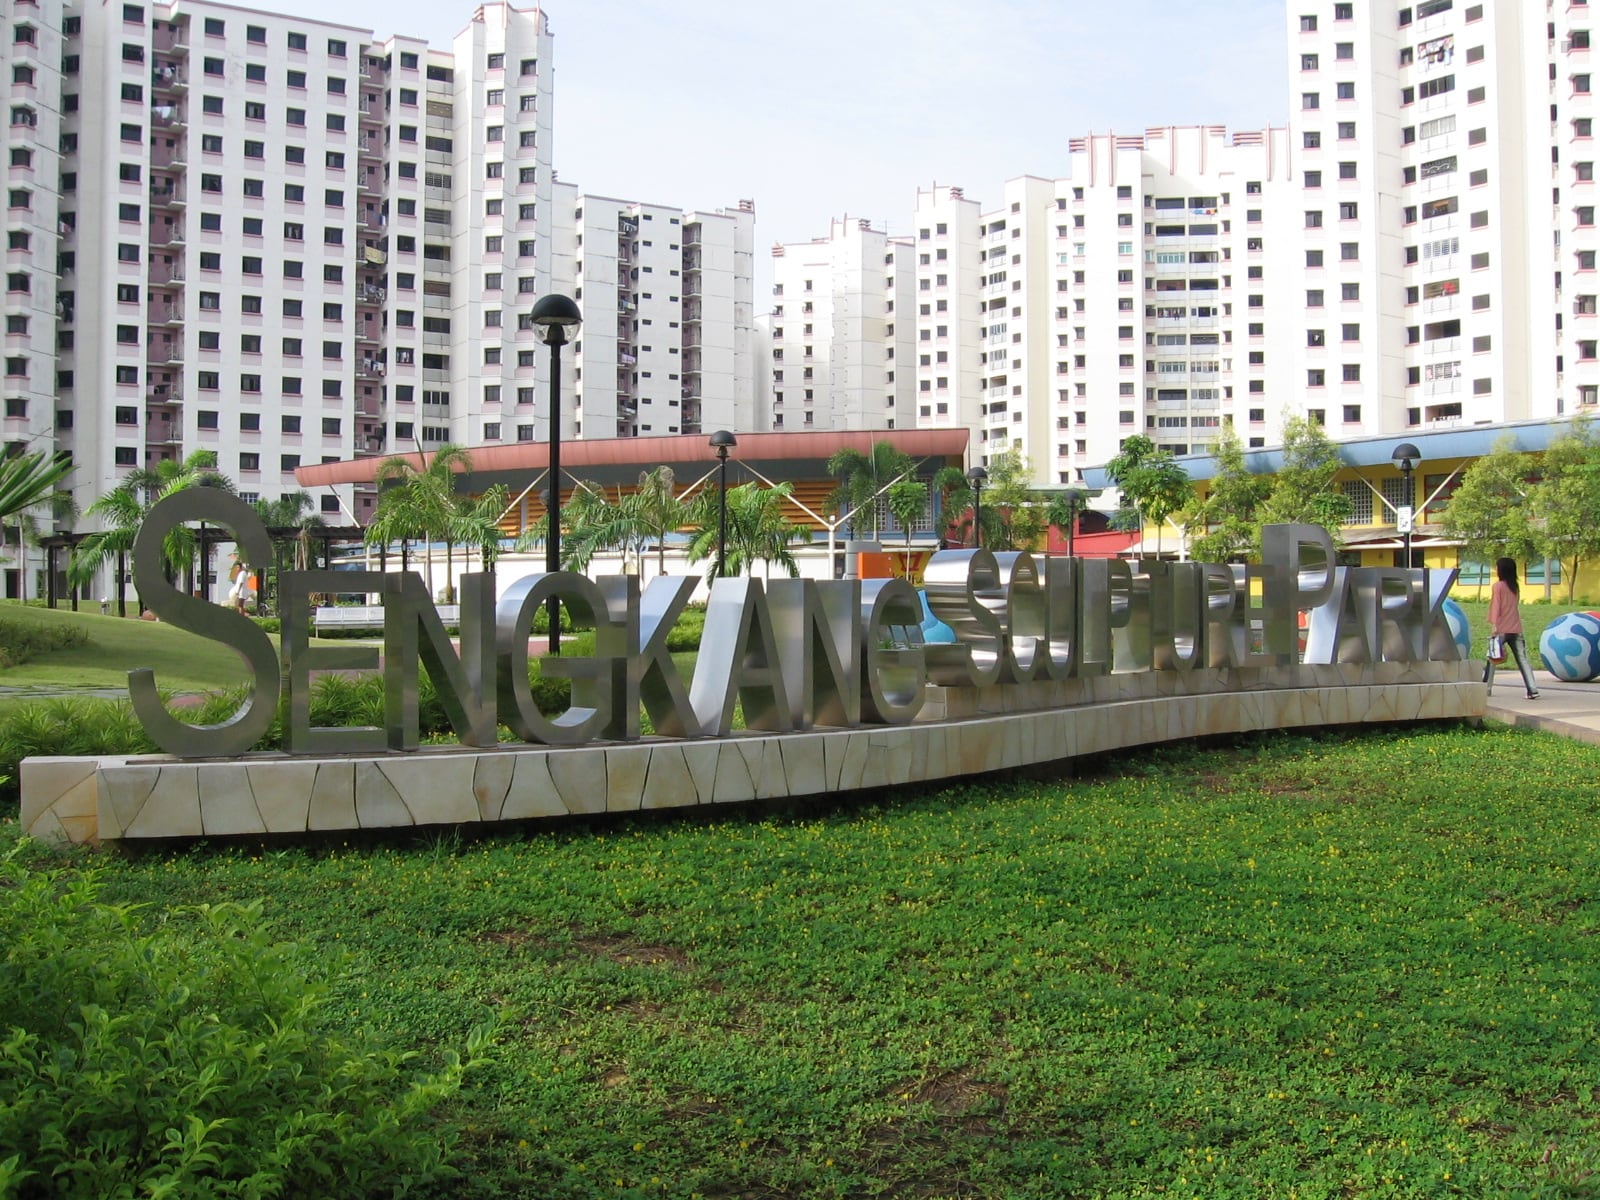
District 19 comes as a pleasant surprise to most.
With rapid expansion in the area, you often hear about all the new BTO flats popping up in the region, often overshadowing that of the private residential department.
Perhaps more importantly, we’ve also recently received news about the impending 50-hectare Punggol Digital District (that’s roughly 50 rugby fields) that is set to create a whopping 28,000 jobs in the digital sphere.
It’s easy access to Changi Airport (by highway) also makes it a great location for flight crew.
Finally, with the rise of its integrated development duo (WaterTown and Waterway Point) and the surrounding private residential developments, District 19’s outstanding appreciation value of 36.85% is thoroughly justified.
Price Movements: $909 average psf in January 2015 to $1,244 average psf in December 2019.
#3 – D10 (Tanglin/Holland/Bukit Timah)
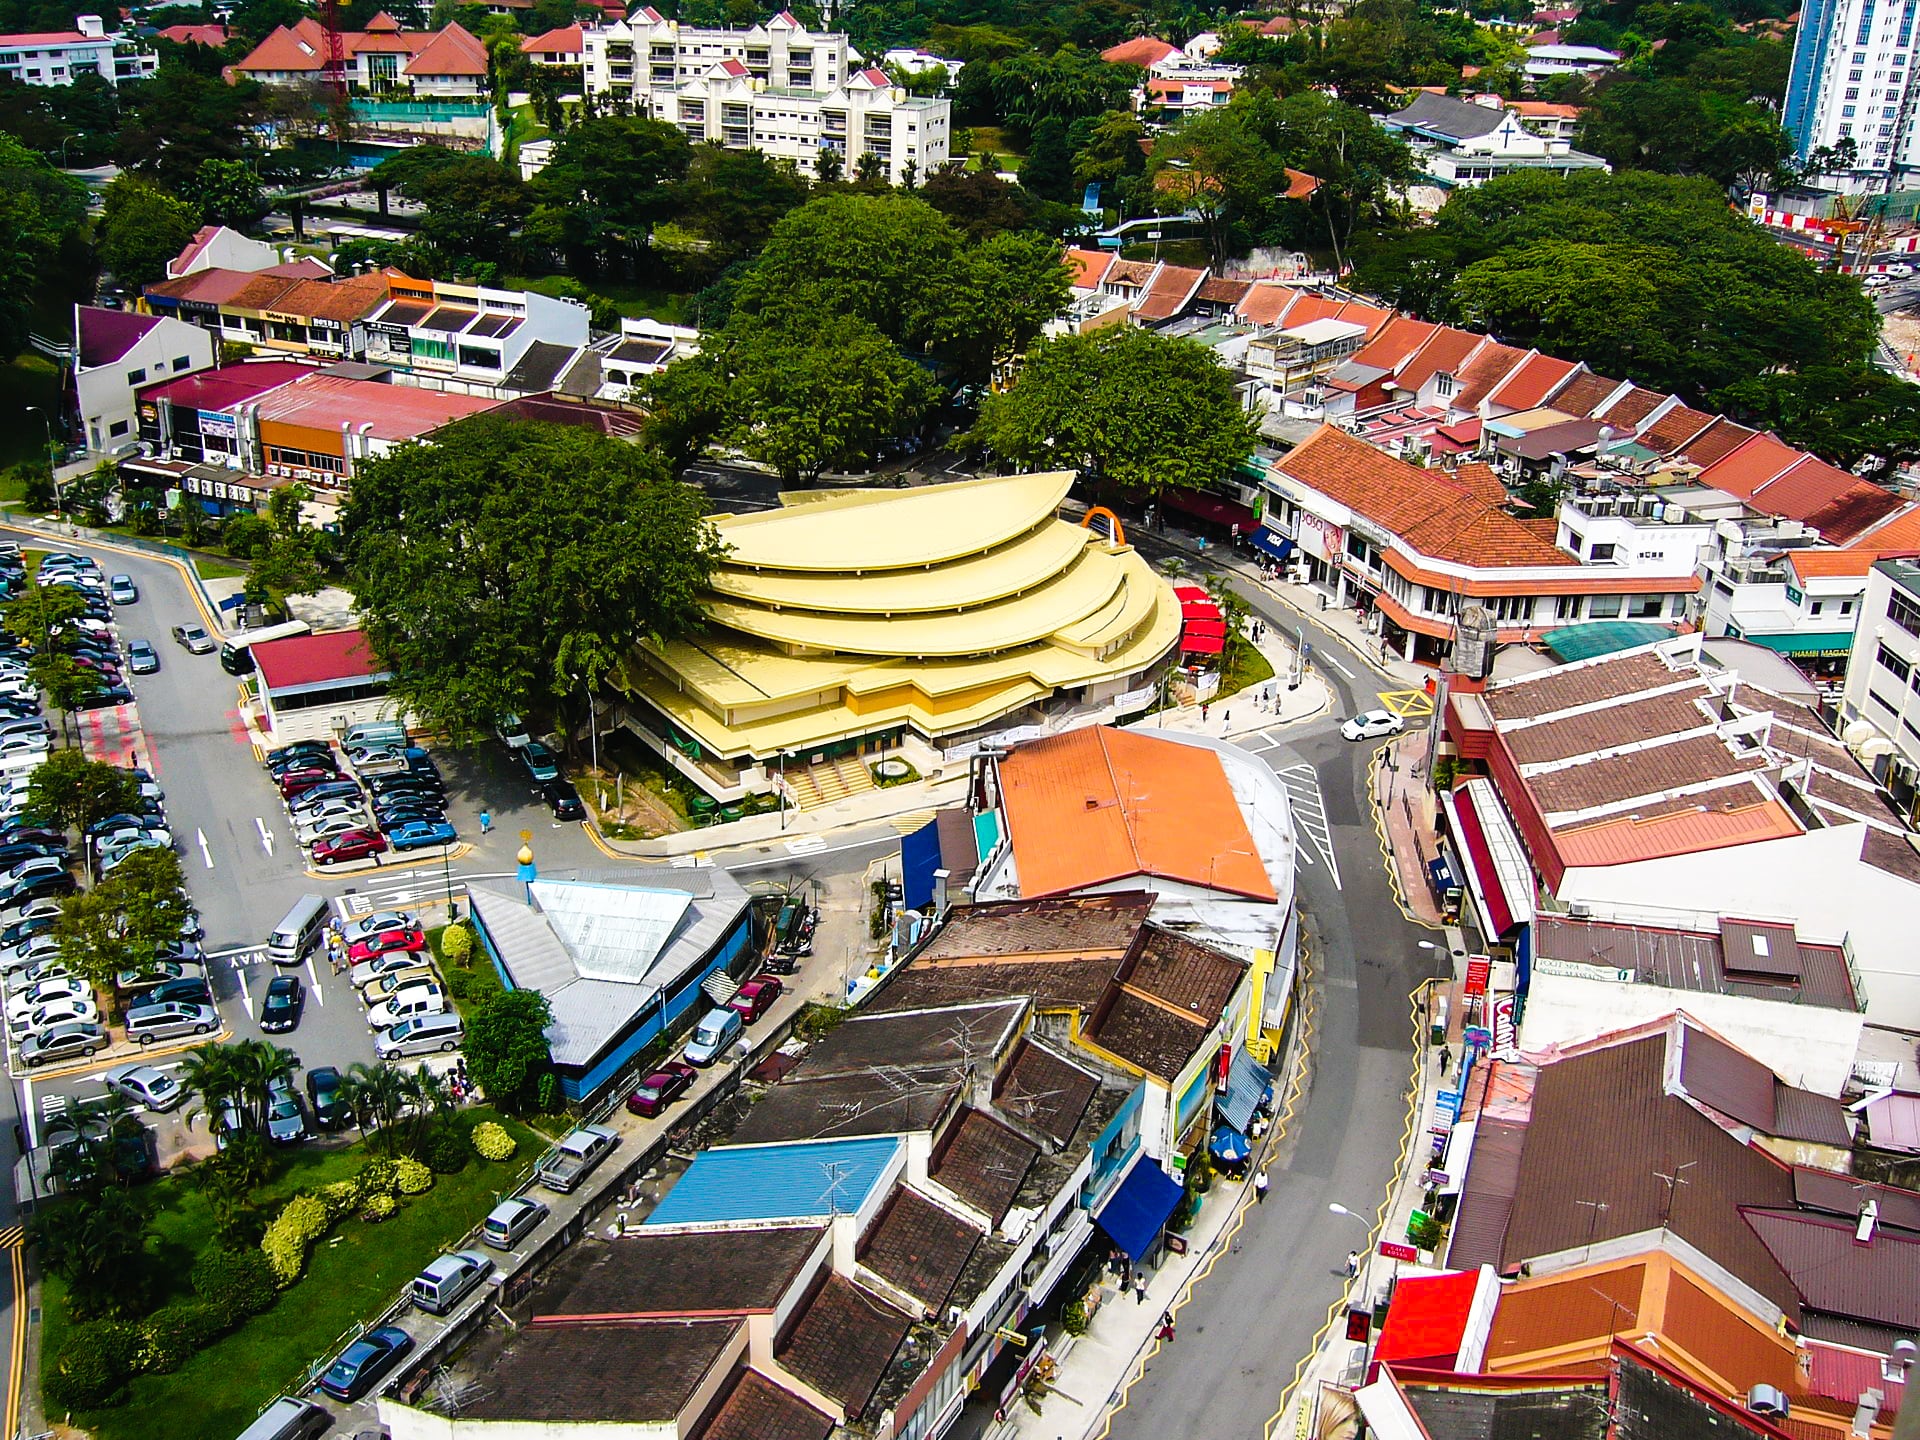
A well-stocked stretch that encompasses a multitude of top-notch amenities, all three regions provide luxurious high-end living matched by almost no other district in Singapore.
With the famous Sixth-Avenue stretch along Bukit Timah as well as an entire range of top-tiered schools and fancy road-side diners in the area, it is with little surprise that residential demand here from well heeled buyers has always been high.
Add in a solid mix of seclusion and convenience in this generally freehold area.
As well as the numerous new, unique developments like the recently reviewed Sloane Residences and the British-themed Mayfair Gardens that are quickly popping up – and the region does look extremely inviting.
Other big contributors can probably be attributed to the good sales from Boulevard 88 and One Holland Village Residences.
District 10’s appreciation figures: 44.35%.
Price Movements: $1,716 average psf in January 2015 to $2,477 average psf in December 2019.
#2 – D2 (Chinatown/Tanjong Pagar)
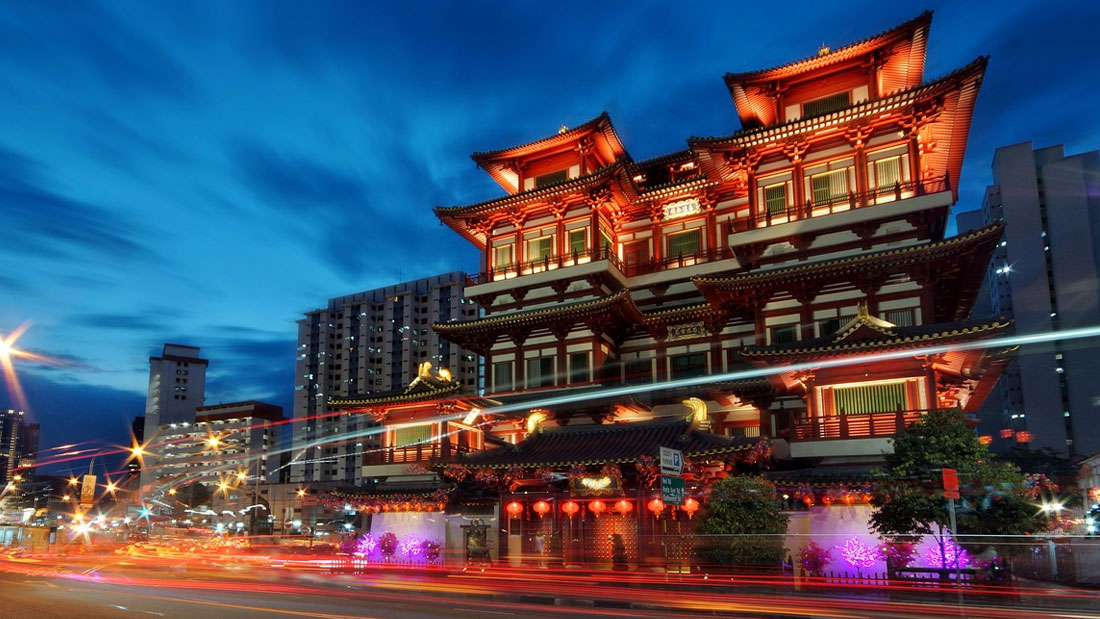
Interestingly enough, District 2 ranks 2nd on the list. This with the presence of top luxury developments in the area like Wallich Residences, Sky Everton and Onze @ Tanjong Pagar playing a big role.
As of this list, District 2 actually has the third highest average psf in Singapore, coming in at $2,402 psf.
District 2’s appreciation statistic stands at 58.13%.
Price Movements: $1,519 average psf in January 2015 to $2,402 average psf in December 2019.
#1 – D7 (Beach Road/Bugis/Rochor)
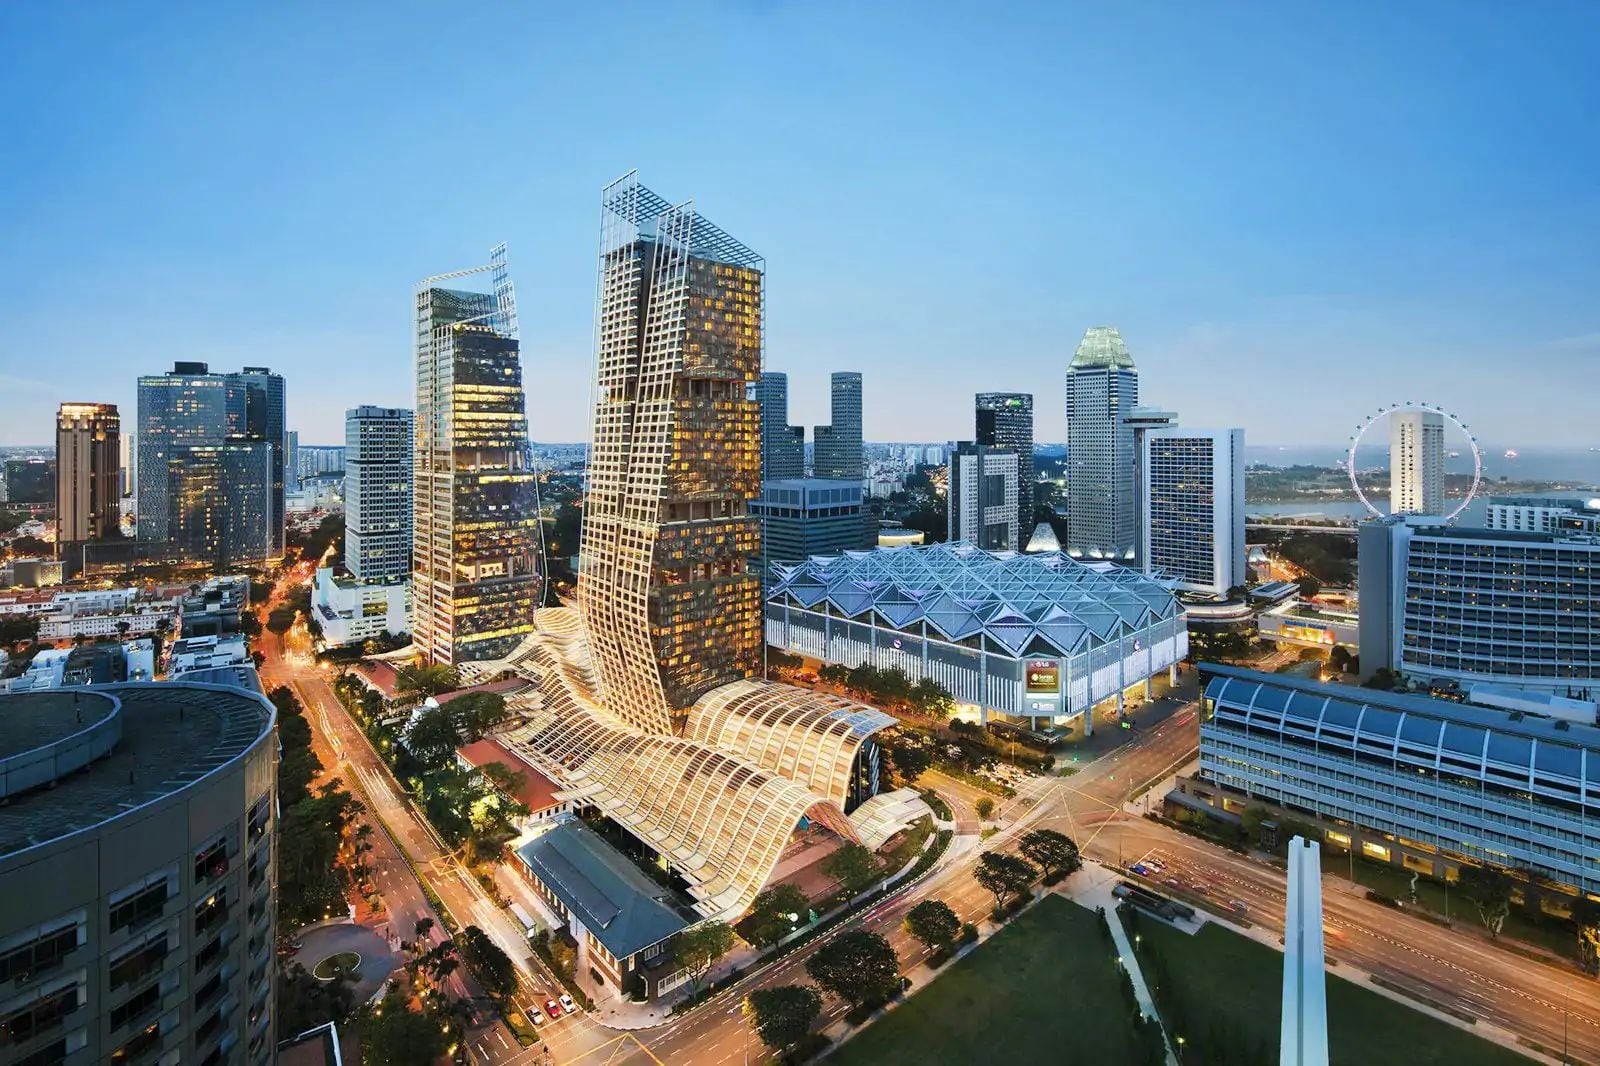
Some might say that District 7’s ranking was already cemented from the start.
In our recently covered Midtown Bay (which by the way has access to like 4 different MRT lines), we detailed the rise of the district based on the area’s proximity to the CBD as well as the increasing reconstruction interest (and successful GLS site bids) in the area.
In fact, if you were to pop into the area, you’d observe the long-standing Shaw Tower is currently undergoing refurbishment into a Grade A 35-storeyed office tower.
Move on down the street in either direction and you’ll also observe construction along Middle Road and Tan Quee Lan Street.
As a result of all this residential development construction (and the promise of greater demand), the limited number of existing residential developments in the area have naturally increased in appreciation.
The figures, an incredible 59.04% that makes it Singapore’s top appreciating district since 2015.
This, made all the more impressive by the area’s incredibly high average quantum value.
Price Movements: $1,709 average psf in January 2015 to $2,718 average psf in December 2019.
General Analysis
- High appreciation in places with promising developments
This one’s a no-brainer.
Demand (and hence prices) begin to rise for districts with new impending infrastructure, or even plenty of open, undeveloped space for that matter (the Seletar-half of D28 comes to mind).
Yet it’s not just any infrastructure that contributes to possible appreciation uptrends. Some of the bigger ‘amenities’ would include:
- Public Transport Offerings (MRT/Bus Stations)
- Massive Employment Generators (Eg. Punggol Digital District)
- Upgrade to Communal/Medical Facilities (Clinics, Community Clubs etc.)
Basically, an increase in convenience or a successful alteration/upgrade to an existing district favourite.
Naturally, the impact of these amenities on demand will also differ from locale to locale, depending on its necessity and ‘population life-enhancement’ value.
- Buying into high quantum districts could result in high gain/loss
As evident in Districts 2 (#2) and 7 (#1), we see how increased quantum mean more drastic differences in appreciation percentages.
To illustrate, a 10% increase in a 3,000 psf district would leave us at 3,300 psf. Assuming we purchase a 1,000 square foot unit, that equals to a jump from 3 million to 3.3 million dollars.
On the other hand, a 10% increase in a 1,000 psf district in a similar-sized unit would equal to a price rise from 1 million to 1.1 million dollars.
That’s a $200,000 difference.
Naturally, those who buy into ‘high quantumed districts’ usually have higher budgets and capitals to begin with, but as the saying goes “a little goes a long way”.
In crux, don’t just look at the percentages, it is also important to look at the actual overall quantum in a particular development to determine the monetary extent of your gains/losses.
- Be wary of the high appreciators
The first thing that many people do is rush into buying developments in ‘good appreciation trend’ districts.
Now chances are, if everyone is buying units in these areas, you might already be too late. So before you join the crowd, here are a number of factors to consider:
- What is the ‘cause of appreciation’ in this district – Is it a singular limiting factor or a multitude of reasons with long-standing, widespread impact?
- At what stage is the demand/appreciation trend at – If the district has been rapidly appreciating for the past 5 years and demand is much lower now, maybe think twice about getting good appreciation returns if you enter the district’s market now.
- How many people have already got there before you – Depending on the above factors, demand can get filled very quickly. With price dips a common phenomenon after an initial price index hike, entering/exiting at the right time is always pivotal.
As you can see, these are just some of the factors you should consider when looking into a high appreciation district for the sake of increased appreciation gains.
In essence, invest very carefully in these scenarios only after getting a sufficient amount of experienced advice.
- Exiting at the right point
This final point emphasises on the constant fluctuations of price trends in the real estate market.
Hold on to a unit for too long, prices dip and you’ll find yourself waiting for the entire cycle to repeat. Sometimes they never do.
Sell a unit too quickly and you’ll be kicking yourself for not holding on to it for a tad longer.
We’ll avoid going too in-depth into price trends for now, but here are some tips that will help those looking to ‘flip’ their current/future properties for maximum appreciation value.
A. Beat the ‘Endowment’ Effect
If you haven’t already heard about it, the ‘endowment effect’ is a common scenario in which someone refuses to part with any of his/her possessions due to emotional bias.
An incredibly valuable trade might be on the cards, but due to emotional attachment, the trade is almost never made.
If you are looking for maximum appreciation from a unit, don’t be prey to it. Understand that the time has come to sell of your property and make the necessary arrangements.
Understand your priorities and look forward to new adventures and brighter prospects.
B. Plan Your Strategy in Advance, be Prepared For Change
As the famous saying goes – ‘If you fail to plan, you plan to fail.’
Speak with people you trust.
Professionals or individuals who have had experience in the field. Whether your strategy is then selling your unit immediately upon SSD, or renting the unit out for a few years before a resale move, have it all planned even before you make your purchase.
Of course, it isn’t the easiest thing, so note that this resonates mainly for those who are serious about gaining monetary value from the real estate market.
Now the markets’ unpredictably often results in unforeseen opportunities/circumstances popping up along the way. Life might also throw you a curve ball in the meantime.
At such points, it is important to re-evaluate if you can still work with the plan, or if minor/major adjustments should be made to your exit strategy.
It won’t guarantee you complete success, but it sure as hell reduces the failure-rate come crunch-time.
Final Word
At the end of the day, there are a lot of existing and potential factors that go into determining appreciation trends.
We’ve also seen both overnight millionaires and overnight bankruptcies in the past.
Based off the unlikely latter scenario, it is therefore important to ascertain your budget/means before taking the plunge. Are you able to part with this amount of money if everything goes to sh*t?
Based on that, you can then work your way into which districts will best suit your current capital/income levels.
Only then, does the real fun begin. Countless condo visits, zoomed-in district analysis, price trend mind maps… the list goes on.
In essence, source within your budget, plan wisely, be prepared for changes and then go make one hell of a mark.
Till the next one!
*Editor’s note*:
We’ve taken a look at the most recent stats, and have since updated the article to ensure that only the latest and most accurate of district findings are shown.
Should you have an queries pertaining to this article or even just the Real Estate sector in general, do feel free to drop us a message at stories@stackedhomes.com, and we’ll get back to you the soonest we can!
At Stacked, we like to look beyond the headlines and surface-level numbers, and focus on how things play out in the real world.
If you’d like to discuss how this applies to your own circumstances, you can reach out for a one-to-one consultation here.
And if you simply have a question or want to share a thought, feel free to write to us at stories@stackedhomes.com — we read every message.
Frequently asked questions
Which district in Singapore experienced the highest appreciation over the past 5 years?
Why are Districts 6 and 24 not ranked in the appreciation list?
How has the appreciation trend been for District 17 (Changi Airport/Changi Village)?
What factors might influence the appreciation of properties in District 23 (Dairy Farm/Bukit Panjang/Choa Chu Kang)?
What is the significance of the postal code system in Singapore's district classification?
Reuben Dhanaraj
Reuben is a digital nomad gone rogue. An avid traveler, photographer and public speaker, he now resides in Singapore where he has since found a new passion in generating creative and enriching content for Stacked. Outside of work, you’ll find him either relaxing in nature or retreated to his cozy man-cave in quiet contemplation.Need help with a property decision?
Speak to our team →Read next from Property Trends
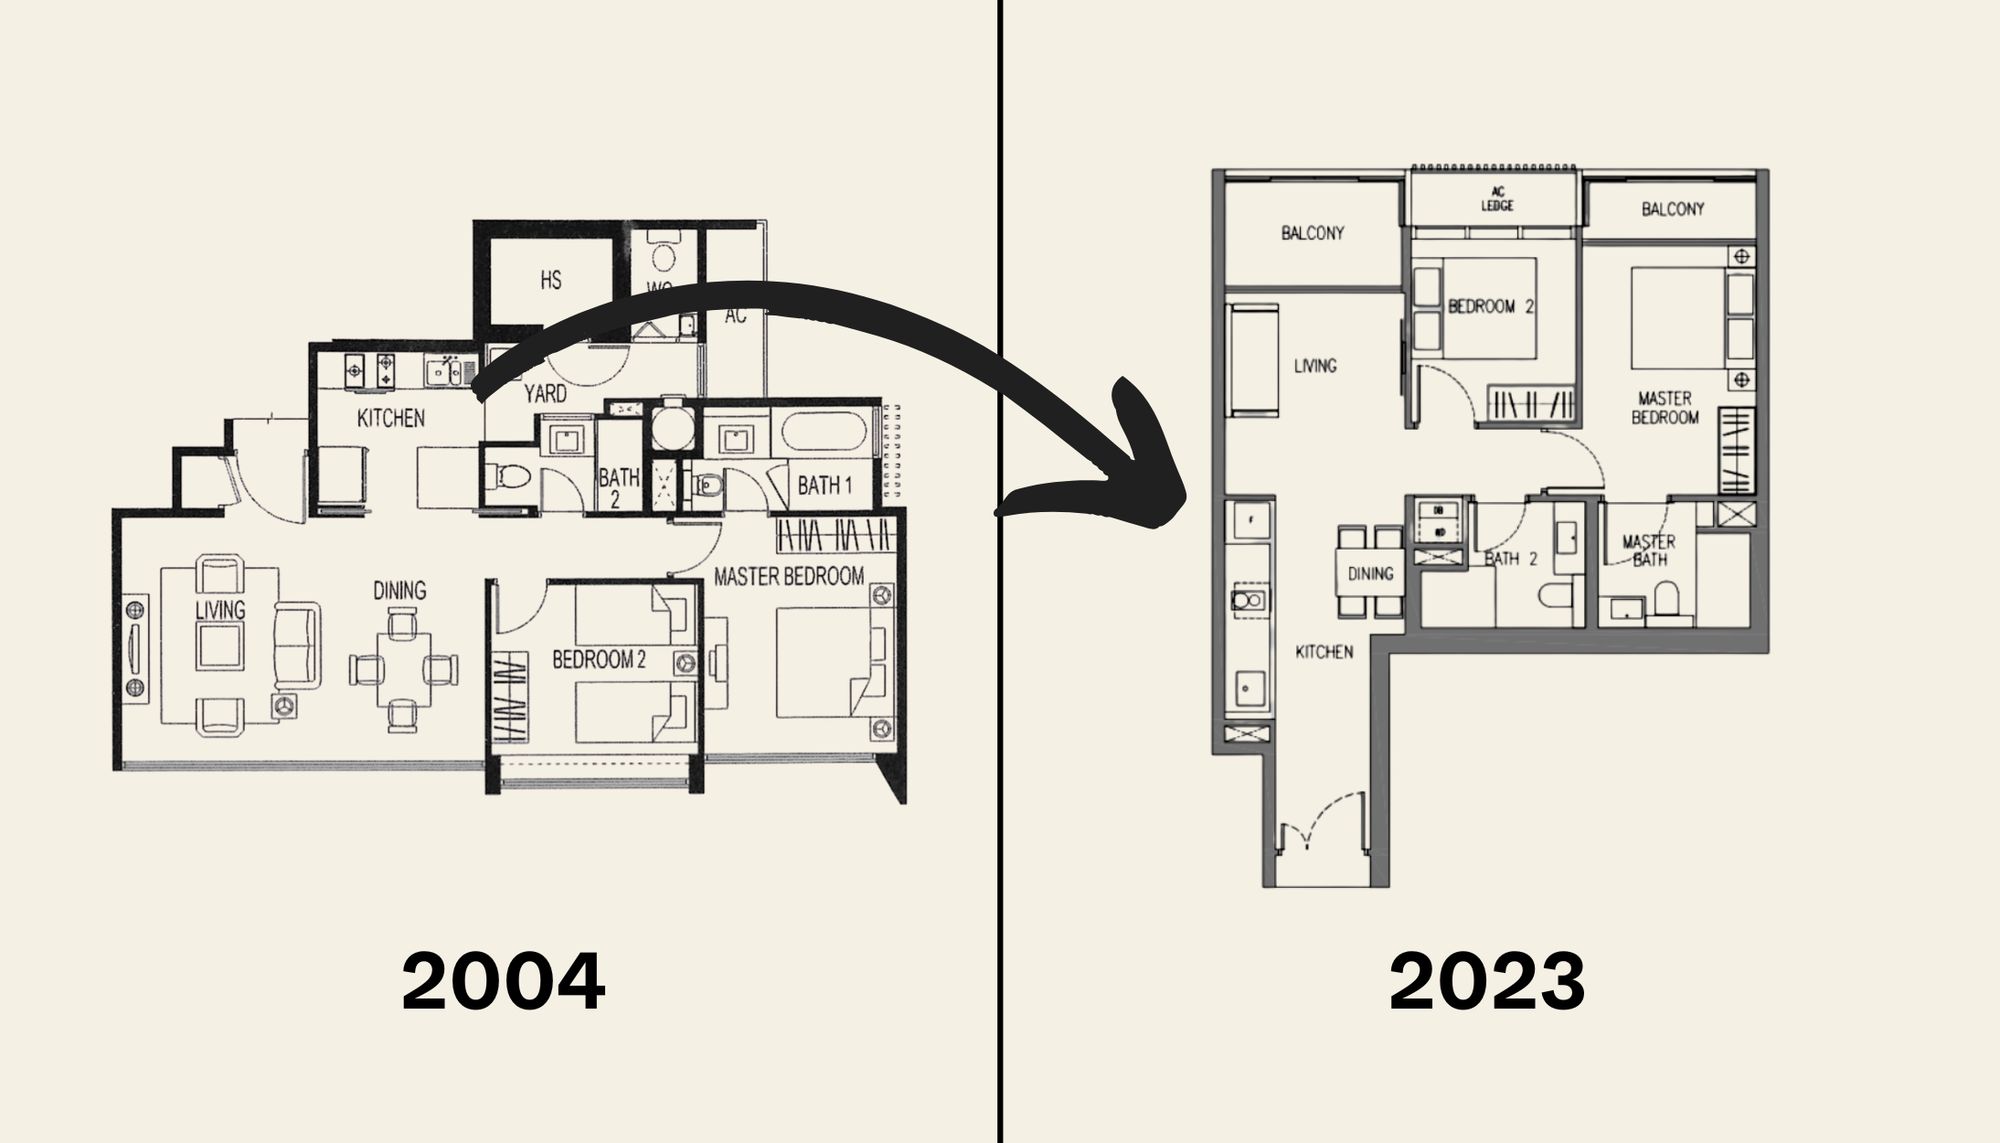
Property Trends The Room That Changed the Most in Singapore Homes: What Happened to Our Kitchens?
Property Trends Condo vs HDB: The Estates With the Smallest (and Widest) Price Gaps

Property Trends Why Upgrading From An HDB Is Harder (And Riskier) Than It Was Since Covid
Property Trends Should You Wait For The Property Market To Dip? Here’s What Past Price Crashes In Singapore Show
Latest Posts

Property Market Commentary We Review 7 Of The June 2026 BTO Launch Sites – Which Is The Best Option For You?

Singapore Property News The Most Expensive Resale Flat Just Sold for $1.7M in Queenstown — Is There No Limit to What Buyers Will Pay?

On The Market Here Are The Cheapest 4-Room HDB Flats Near An MRT You Can Still Buy From $450K






7 Comments
Would’ve never guesed seletar and yio chu kang to be number 1 …
wah how come D16 so bad. must be a lot of old residentials there?
Not surprising that the no.1 and 2 position are in OCR, this is due to decentralisation planning and regional hub effect. I wonder what is the consideration for limiting the period of study up to 2015 and not further?
I appreciate and enjoy reading many articles on this site but inevitably feel a lot of analysis are flawed and misleading because of the blanket inclusion of all property transactions .
Poiz Residences – property price changes from 1300 to 1700 in less than 6 months – is a good indication of how flawed the previous ranking on integrated development cann be. A better analysis will have to provide and account situationally the prices in each district, and also take into account the time frame the last transaction took place.
For this analysis, there is a huge gap between recent new launches and surrounding units. Any district with a significant number of launches will easily rank well in the above, and is not reflective of general price appreciation by district.
Thus above conclusion does not really hold any water as this list becomes more like a ranking of district with most number of fancy new launches than actual price appreciation. I hope investors are not misled by this.
D5 is central btw.