Analysing The Gap Between New Condos And Household Income (All 28 Districts): Which Are Still Affordable To Singaporeans?
March 26, 2021
There’s a list of “coffee shop complaints” that we hear all the time, from the rising cost of food, to whether PSLE is a terrible idea. A perennial favourite on the list is the issue of housing affordability, especially in the private market. Of late, there have been worries about a growing gap between income and private home prices; a recent Business Times report mentions these are at a 10-year high.
However, we felt it would be more useful to break it down to specific districts to get a clearer outlook:
How is the affordability ratio determined?
There are variations on how affordability is determined, but the one used in the above-linked article compares median property prices across Singapore (regardless of lease status, district, and excluding Executive Condominiums), against median household income.
Obviously, the bigger the gap between median home prices and median income, the less affordable our private housing is. For the year 2020, the gap for new launch condos was at 12.1. According to the aforementioned news report, this was the highest over the past decade – the last peak was 14.8 in 2010.
(For resale condos, the gap has been the same since 2018, at 4.6.)
That said, note that the price-to-income ratio involves subtleties that shouldn’t be overlooked. For example, our ability to use ECs or subsidised flats as a stepping stone to private homes (asset progression) means Singapore’s private property market may be more affordable than the ratio suggests. In addition, the median price is determined on a per square foot basis – there are condo units that have a high price per square foot, but lower total price (The M is a leading example).
Perhaps most importantly, looking at prices island-wide is less useful to home buyers. Those of you eyeing properties in District 18, for instance, are less likely to find affordability issues than those wanting to buy in District 4.
So to add specificity, we compared median price to income across different districts instead.
To compile the following, we used the median household income as shown by the Department of Statistics Singapore. We then found the price-to-income gap for each district, using the same general method above.
Median Household Income
| Year | Monthly | Yearly |
| 2010 | $6,342 | $76,104 |
| 2011 | $7,037 | $84,444 |
| 2012 | $7,566 | $90,792 |
| 2013 | $7,872 | $94,464 |
| 2014 | $8,292 | $99,504 |
| 2015 | $8,666 | $103,992 |
| 2016 | $8,846 | $106,152 |
| 2017 | $9,023 | $108,276 |
| 2018 | $9,293 | $111,516 |
| 2019 | $9,425 | $113,100 |
| 2020 | $9,189 | $110,268 |
For starters, let’s take a look at where the affordability gap is growing the fastest:
| District | Price to income gap (2019) | Price to income gap (2020) | Change between 2010 to 2020 |
| District 23 (Bukit Batok, Choa Chu Kang) | 13.36 | 14.31 | +28.97% |
| District 15 (Marine Parade) | 25.1 | 21.1 | +25.71% |
| District 17 (Pasir Ris, Changi) | 13.05 | 11.88 | +21.53% |
| District 27 (Yishun, Sembawang) | 11.25 | 11.26 | +13.13% |
| District 12 (Novena) | 15.7 | 16.9 | +12.35% |
| District 18 (Tampines) | 11.8 | 12.3 | +10.4% |
| District 10 (Bukit Timah, Tanglin) | 24.3 | 24.06 | +9.36% |
| District 19 (Punggol, Sengkang) | 12.99 | 14.11 | +9.28% |
| District 20 (Ang Mo Kio, Bishan) | 15.03 | 15.77 | +8.76% |
| District 3 (Tiong Bahru, Queenstown) | 17.02 | 18.6 | +6.46% |
Many of the districts here are what you might call the usual suspects. We doubt anyone is shocked that places like Queenstown, Marine Parade, Bishan, and Bukit Timah haven seen widening price-to-income ratios; these districts have maintained their momentum since 2016, when the market had adapted to cooling measures.
However, the presence of District 17, 19, and 23 may surprise some.
District 19 may not top the list, but it has seen the biggest shake-up over the past few years. This district used to consist of low-priced housing, with few new launches over the years. Then in 2017, District 19 suddenly saw an explosion of strong new launches – Sengkang Grand Residences, The Florence Residences, Affinity at Serangoon, etc.
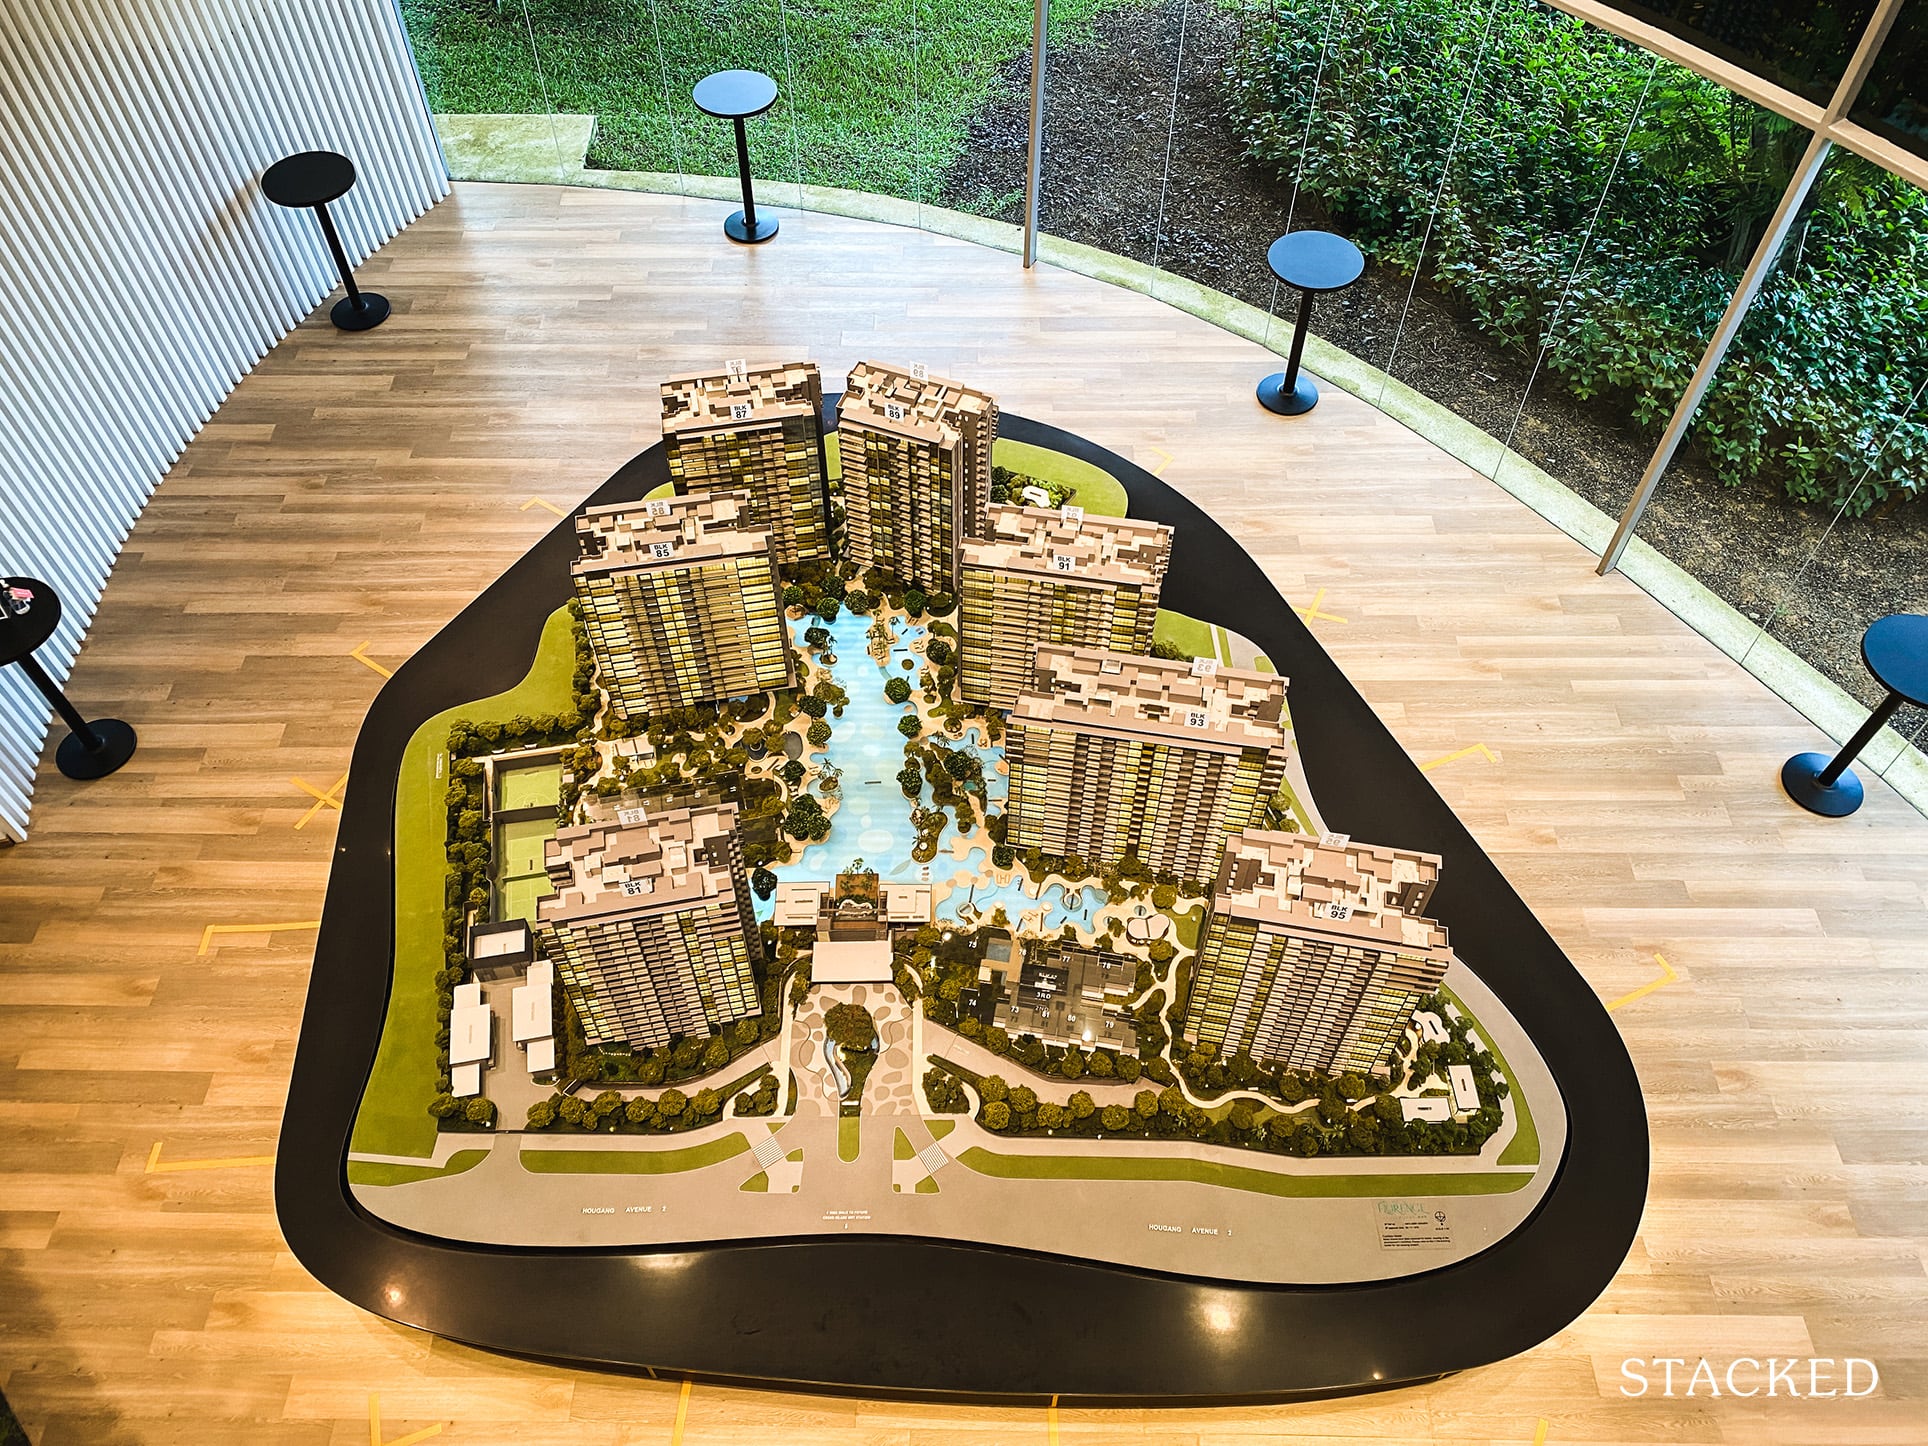
New launches are always priced higher than resale counterparts, so a surge of new launch condos can cause sharp spikes in pricing. Many of these new launches also boast proximity to amenities that didn’t exist before (e.g. NEX and Waterway Point), thus justifying an even steeper price difference from older, less-well-located resale condos.
More from Stacked
This New Dairy Farm Condo Starts From $998K — How the Pricing Compares
Narra Residences was one of the first new condominiums to preview in 2026, welcoming visitors to its sales gallery over…
District 17 has seen a somewhat similar phenomenon; private home prices have risen on the back of new launches, after a prolonged period of silence. When The Jovell launched in Flora Drive in 2018, for instance, it was the first new condo in the area in over five years.
District 23, on the other hand, has seen rising prices as the market learns to look beyond the Hillview area (back in 2010 and before, the only “high-end property” associated with District 23 was mainly its landed enclave). But the development of the Rail Corridor, along with the launch of Skywoods, Le Quest, and Wandervale, have gradually seen rising interest – and prices – throughout District 23 as a whole.
We feel it was mostly Sol Acres (a 1,300+ unit mega development and EC) that got the ball rolling in 2015. The success of this project seems to have given other developers more confidence in the Choa Chu Kang area.
Condo ReviewsHigh Park Residences Review: Absolute Best Facilities For Families With Kids
by Reuben DhanarajAre there any districts that became more affordable?
| District | Price to income gap (2019) | Price to income gap (2020) | Change between 2010 to 2020 |
| District 9 (Orchard) | 24.68 | 22.14 | -25.4% |
| District 28 (Seletar) | 11.7 | 12.4 | -15.44% |
| District 21 (Clementi, Upper Bukit Timah) | 16.2 | 16.7 | -10.08% |
| District 2 (Chinatown, Raffles Place) | 22.4 | 23.7 | -2.88% |
| District 7 (Bugis, Rochor) | 25.8 | 22.2 | -2.5% |
| District 8 (Farrer Park) | 16.4 | 17.2 | -0.79% |
The price gap has narrowed in many prime districts, where prices have always been high. Since the last peak in 2013, a combination of repeated cooling measures, along with tighter loan curbs and a softening rental market, have put significant downward pressure on prime region properties.
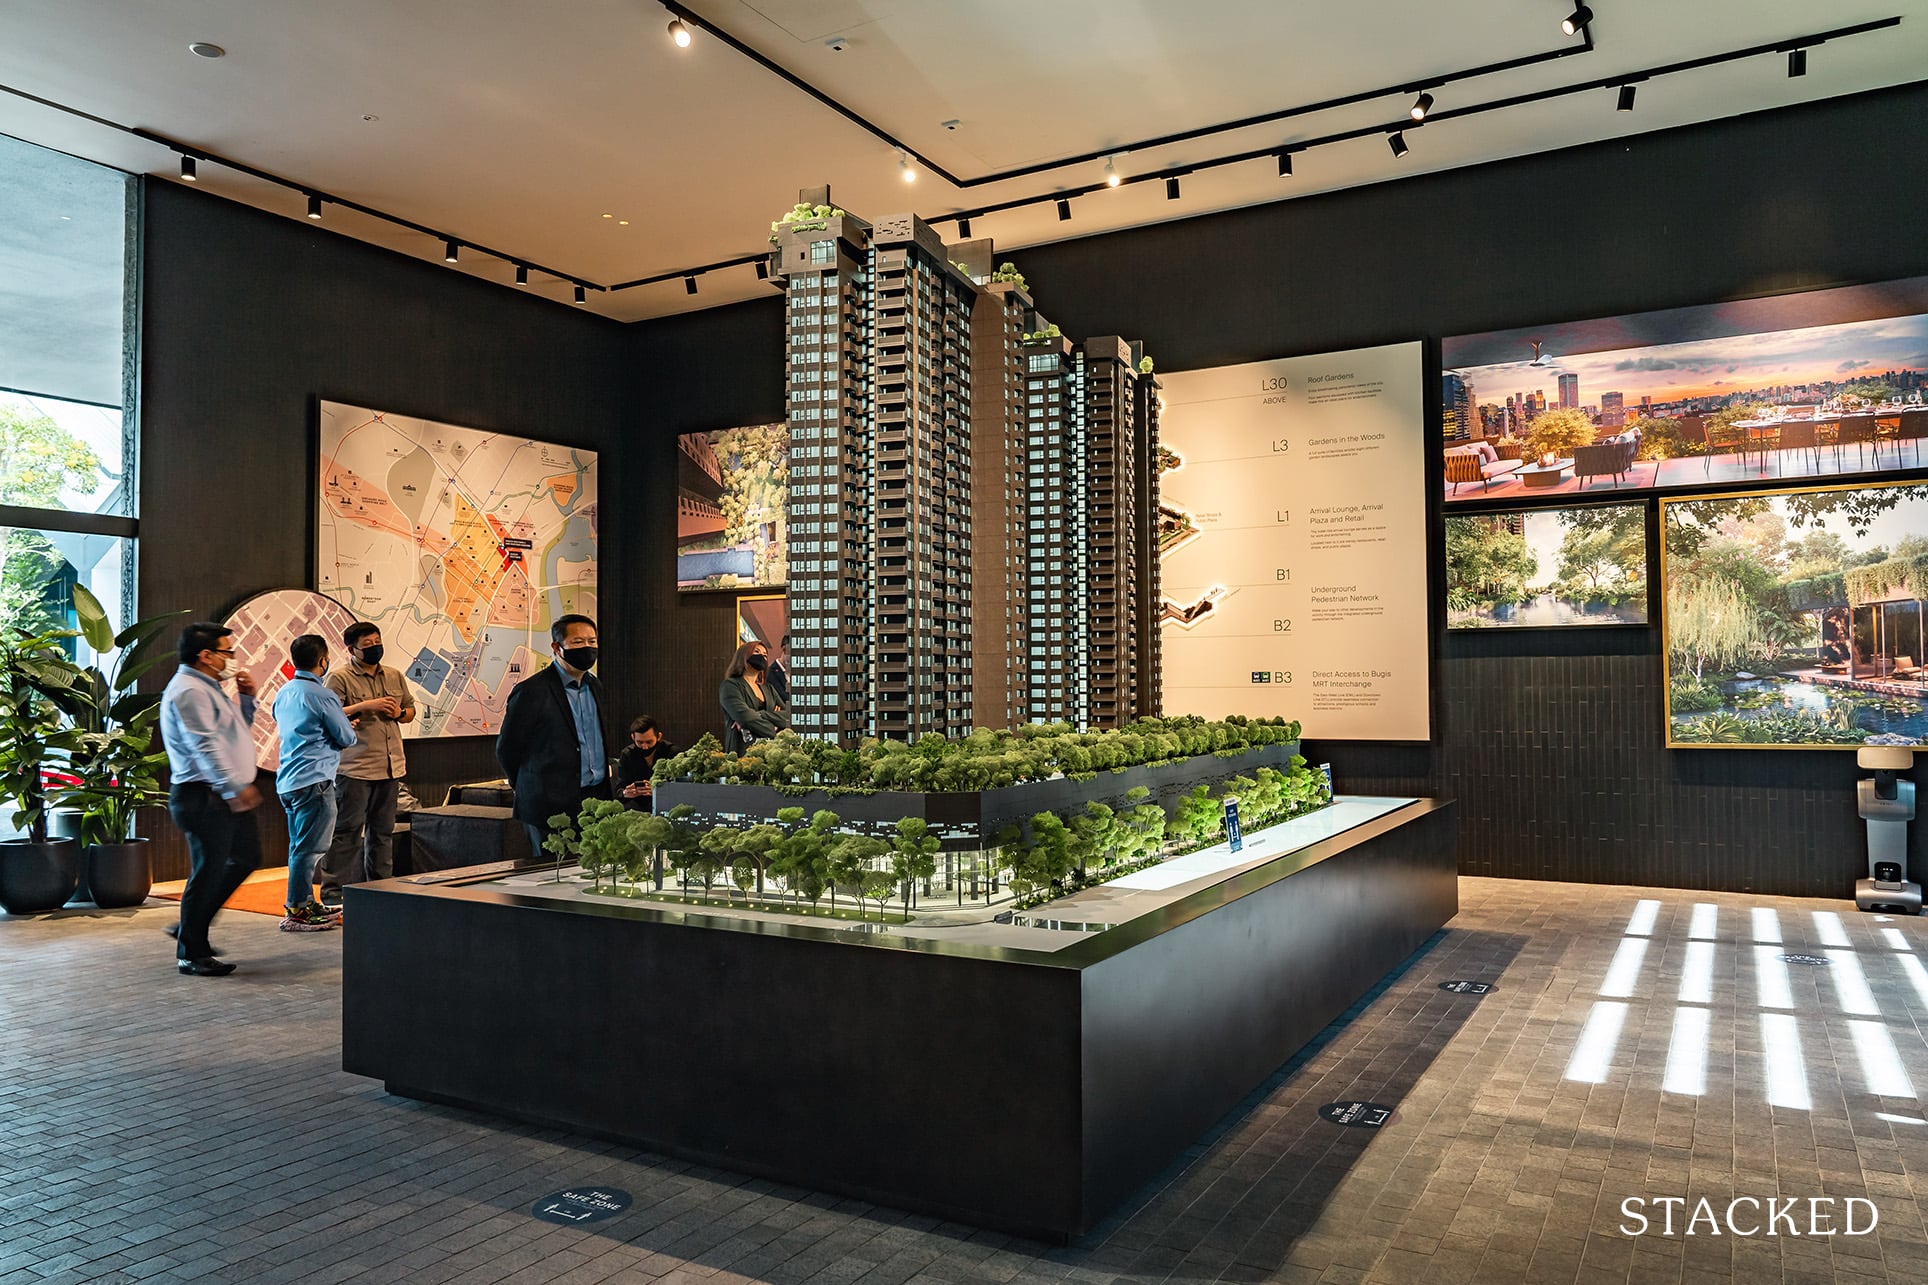
Note that District 9 has seen prices fall to the point where District 7 has overtaken it, for the first time ever. For 2020, District 7 was actually a bit less affordable than the famed Orchard area homes.
District 8 is technically seeing better affordability; but at less than one per cent, we doubt buyers will feel the change.
The surprise here is District 28, especially given the high-cost landed developments we’ve seen here. Luxus Hills and Belgravia Villas are far from the cheapest homes; and although High Park Residences was competitively priced, such a large (1,390 units) new launch should still have pulled up overall prices in the area. Perhaps it’s time for bargain hunters to scrutinise District 28 more closely.
Here are the top 5 most and least affordable districts, based on available data:
Most affordable:
| District | Price to income gap (2020) |
| District 27 (Yishun, Sembawang) | 11.26 |
| District 17 (Pasir Ris, Changi) | 11.88 |
| District 26 (Yio Chu Kang) | 12.28 |
| District 18 (Tampines) | 12.38 |
| District 28 (Seletar) | 12.43 |
Least affordable:
Note that data for some districts, such as district 4, is not available because of the lack of new launches in 2020. As such, there may be districts less affordable than these five.
| District | Price to income gap (2020) |
| District 10 (Bukit Timah, Holland) | 24.06 |
| District 11 (Newton) | 24.02 |
| District 7 (Bugis, Rochor) | 22.27 |
| District 9 (Orchard) | 22.14 |
| District 8 (Farrer Park) | 17.29 |
Bear in mind that we are using home prices on a psf basis (in terms of absolute quantum, it’s likely that Orchard properties still top the chart).
That said, it might be interesting to buyers to see that Tampines, despite being a regional hub of the east, is more affordable than most might assume (except for the Tampines Central area, where prices will be higher than the norm).
It’s also a sign that District 7 bears watching, and that the city centre is gradually expanding to the Bugis area. The ongoing development of the Ophir-Rochor corridor can sustain this movement for some time to come.
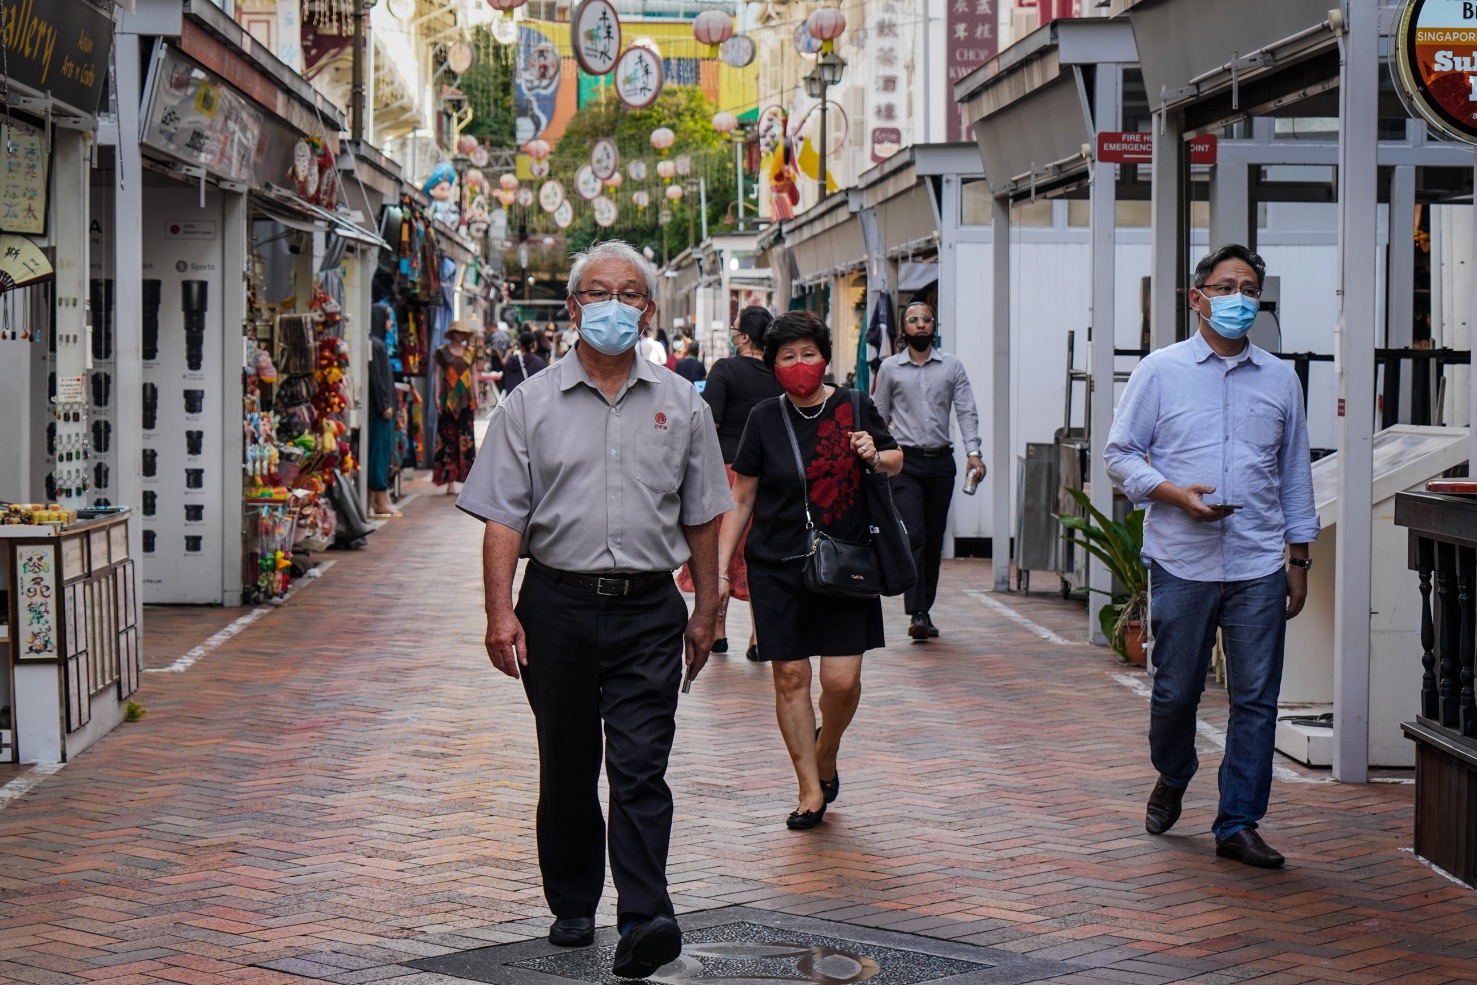
This aside, we shouldn’t forget that 2020 was an unusual year
2020 was an especially difficult year, due to Covid-19. We already knew, in the first half of 2020, that wages were likely to decrease, even more so than employment. Given these circumstances, it’s unsurprising if some detect a growing disparity between home prices and our income.
For the individual home buyer however, we would suggest you treat all this as an abstraction.
At Stacked, we like to look beyond the headlines and surface-level numbers, and focus on how things play out in the real world.
If you’d like to discuss how this applies to your own circumstances, you can reach out for a one-to-one consultation here.
And if you simply have a question or want to share a thought, feel free to write to us at stories@stackedhomes.com — we read every message.
Frequently asked questions
How is the affordability ratio for condos calculated in Singapore?
Which districts in Singapore have seen the biggest increase in the gap between home prices and income?
Are there districts in Singapore where housing has become more affordable recently?
What factors can influence the perceived affordability of private housing in Singapore?
Why might the overall island-wide property prices be less useful for home buyers?
Ryan J. Ong
A seasoned content strategist with over 17 years in the real estate and financial journalism sectors, Ryan has built a reputation for transforming complex industry jargon into accessible knowledge. With a track record of writing and editing for leading financial platforms and publications, Ryan's expertise has been recognised across various media outlets. His role as a former content editor for 99.co and a co-host for CNA 938's Open House programme underscores his commitment to providing valuable insights into the property market.Need help with a property decision?
Speak to our team →Read next from Property Investment Insights

Property Investment Insights This Singapore Condo Skipped 1-Bedders And Focused On Space — Here’s What Happened 8 Years Later
Property Investment Insights Why Buyers in the Same Condo Ended Up With Very Different Results

Property Investment Insights What Happens When a “Well-Priced” Condo Hits the Resale Market
Property Investment Insights How a 1,715-Unit Mega Development Outperformed Its Freehold Neighbours
Latest Posts
Singapore Property News One Of The Last Riverfront Condos In River Valley Is Launching — From $2,877 PSF

Property Market Commentary Why Some Old HDB Flats Hold Value Longer Than Others
Overseas Property Investing What Under $200K Buys In Malaysia Today — From Freehold Apartments to Beachfront Suites










0 Comments