$6M Profit!? – The Biggest Winners From The 08/09 Property Market Crash
May 1, 2020
It’s the 1st of May, Singapore has now reported 932 new Covid-19 cases, bringing the total national tally past the 17,000 mark.
HDB resale, rental volumes are expectedly down in the first quarter of 2020 – with stagnant prices to boot.
It’s not much better for private homes either, where prices have fallen 1% in the first quarter of 2020.
Real estate matters aside, even our simple pleasures in life have been affected, with many mourning for the delay in reopening of McDonalds.
In short, it is just doom and gloom all around.
Admittedly, we haven’t been super positive on that front too with our recent article on the biggest losers from the 08/09 property market crash.
So in the spirit of looking on the bright side (and something more uplifting), let us take a look at the biggest winners from the last major crisis to hit Singapore.
Many readers write in because they're unsure what to do next, and don't know who to trust.
If this sounds familiar, we offer structured 1-to-1 consultations where we walk through your finances, goals, and market options objectively.
No obligation. Just clarity.
Learn more here.
Top Appreciating Districts From 08/09 Property Market Crash
| District | Area | Average of Gains Loss | Average of Absolute Amount |
| 22 | Boon Lay/Jurong/Tuas | 49.75% | $ 350,425.64 |
| 28 | Seletar/Yio Chu Kang | 48.03% | $ 330,470.59 |
| 21 | Clementi Park/Upper Bukit Timah | 47.36% | $ 445,706.85 |
| 20 | Ang Mo Kio/Bishan/Thomson | 46.49% | $ 454,600.38 |
| 5 | Buona Vista/West Coast/Clementi New Town | 43.98% | $ 401,476.64 |
| 26 | Mandai/Upper Thomson | 43.61% | $ 324,414.50 |
| 19 | Hougang/Punggol/Sengkang | 43.37% | $ 330,628.56 |
| 13 | Macpherson/Potong Pasir | 43.23% | $ 352,661.16 |
| 27 | Sembawang/Yishun | 42.25% | $ 242,134.33 |
| 3 | Alexandra/Commonwealth | 42.19% | $ 340,689.53 |
| 16 | Bedok/Upper East Coast | 41.32% | $ 352,818.20 |
| 15 | East Coast/Marine Parade | 40.71% | $ 392,296.50 |
| 23 | Dairy Farm/Bukit Panjang/Choa Chu Kang | 40.23% | $ 280,042.04 |
| 8 | Farrer Park/Serangoon Road | 39.51% | $ 294,169.25 |
| 17 | Changi Airport/Changi Village | 38.69% | $ 258,882.43 |
| 14 | Eunos/Geylang/Paya Lebar | 38.15% | $ 309,324.27 |
| 18 | Pasir Ris/Tampines | 38.13% | $ 282,682.66 |
| 12 | Toa Payoh/Balestier | 36.97% | $ 337,735.01 |
| 25 | Admiralty/Woodlands | 36.63% | $ 214,437.95 |
| 11 | Newton/Novena | 36.26% | $ 460,716.25 |
| 7 | Beach Road/Bugis/Rochor | 34.91% | $ 307,763.23 |
| 2 | Chinatown/Tanjong Pagar | 32.84% | $ 271,117.18 |
| 9 | Orchard/River Valley | 32.20% | $ 470,227.23 |
| 10 | Tanglin/Holland/Bukit Timah | 31.31% | $ 519,187.64 |
| 1 | Boat Quay/Raffles Place/Marina | 30.46% | $ 429,311.65 |
| 4 | Sentosa/Harbourfront | 19.79% | $ 365,209.48 |
| Grand Total | 39.44% | $ 369,691.65 | |
- Of the top 10 appreciating districts, 2 out of the 10 were in the RCR, and all the rest were in the OCR.
- It’s not surprising that the strong performance of the OCR districts as these are usually the most resilient during a financial crisis – one big reason you can attribute to that is because they are usually owner-occupied. This means that there is a lesser chance of big deviations during crisis periods.
- This is in contrast to CCR properties where they are usually more popular with foreigners as well as investors. The higher quantums in CCR properties also generally mean that during a property market crash they will take the biggest hit.
- That said, you might expect the biggest recoveries to come from CCR properties but there are a couple of reasons why that isn’t reflected in this list:
– Big units with high quantum in CCR means that when these units do sell at a loss during a property market crash the % drop might not be very high but the overall quantum drop is significant because of the high price to begin with.
– Ownership of these CCR properties could also be seen to be more resistant due to stronger holding power, so while there are big losses from certain units, there could be overall less transactions as well, which could skew the numbers a little. - Unsurprisingly, District 4 is at the bottom of this list, with Sentosa probably being the biggest factor to its performance. The last peak of Sentosa was in 2010, where the peak median price was $2,200 psf – this has dropped to a jaw dropping $1,367 psf in 2019.
- Average amount made per unit was the highest in District 10 – the only district with a figure above half a million at $519,187.64.
- This is followed by District 9 with an average of $470,227.23.
Top 10 Appreciating Residential Units
#10 Ardmore Park
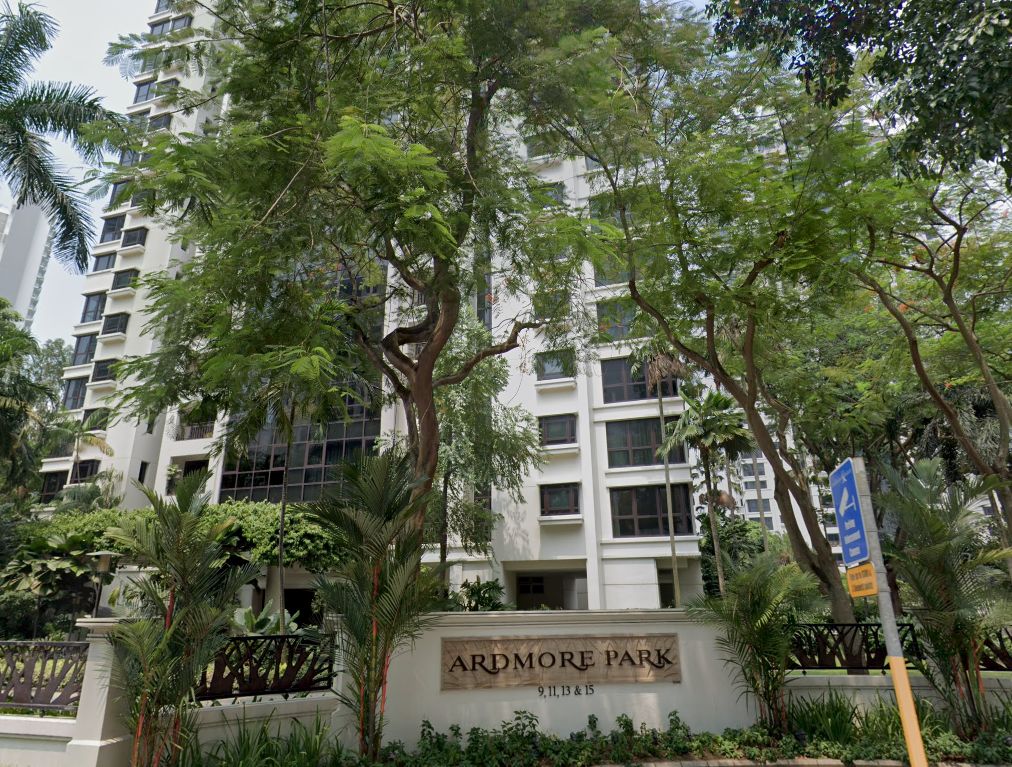
This 2,885 sqft Ardmore unit along Ardmore Park recorded a 42% ($2.55m) appreciation from $2,097 psf to $2,981 psf during its sale on 23 Nov 2017.
Bought For: $6.05 million
Sold For: $8.6 million
#9 Regency Park
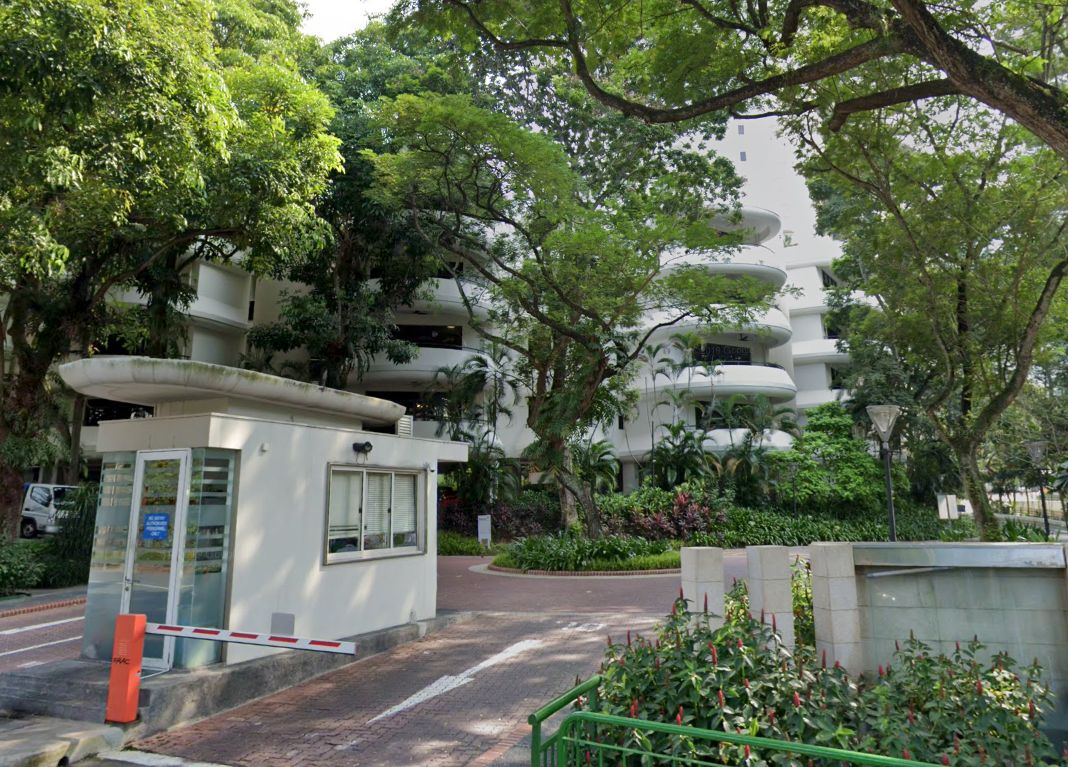
This 3,649 sqft Regency Park unit along Nathan Road recorded a 60% ($2.6m) appreciation from $1,178 psf to $1,891 psf during its sale on 11 Sep 2013.
Bought For: $4.3 million
Sold For: $6.9 million
#8 St Regis Residences
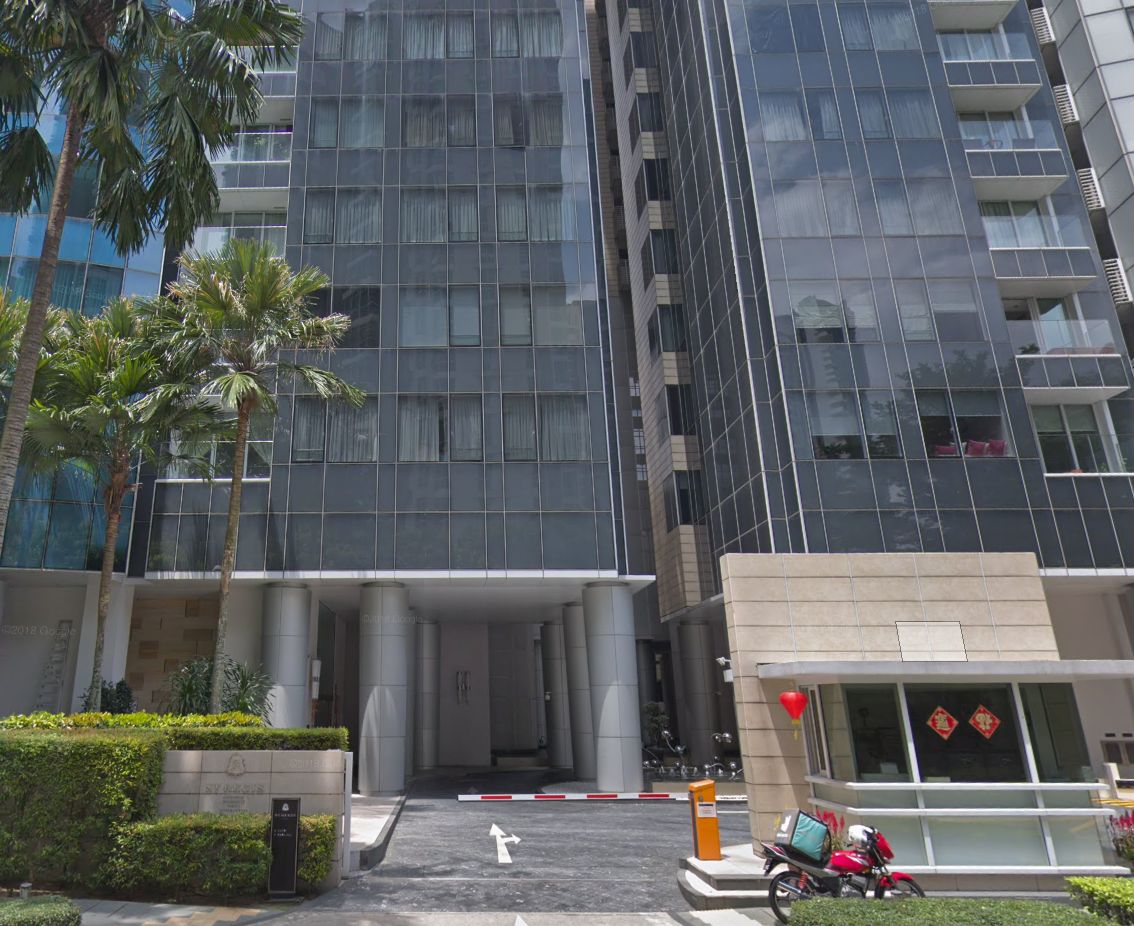
This 4,273 sqft St Regis Residences unit along Tanglin Road recorded a 29% ($2.663m) appreciation from $2,153 psf to $2,776 psf during its sale on 30 Sep 2011.
Bought For: $9.2 million
Sold For: $11.86 million
#7 Ardmore Park

It’s no surprise that there is another Ardmore Park unit on this list, with this 2,885 sqft Ardmore unit along Ardmore Park recording a 44% ($2.7m) appreciation from $2,115 psf to $3,051 psf during its sale on 18 Nov 2009.
Bought For: $6.1 million
Sold For: $8.8 million
#6 Yong An Park
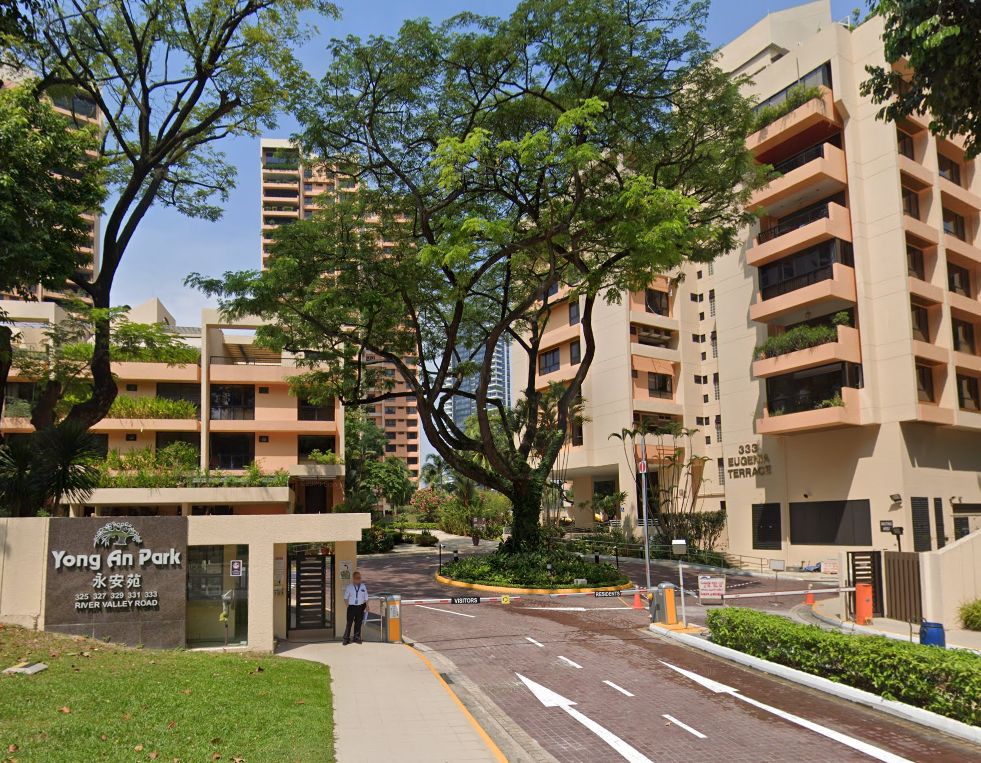
This 4,639 sqft Ardmore unit along River Valley Road recorded a 63% ($2.71m) appreciation from $925 psf to $1,509 psf during its sale on 21 Jul 2014.
Bought For: $4.29 million
Sold For: $7 million
#5 The Claymore
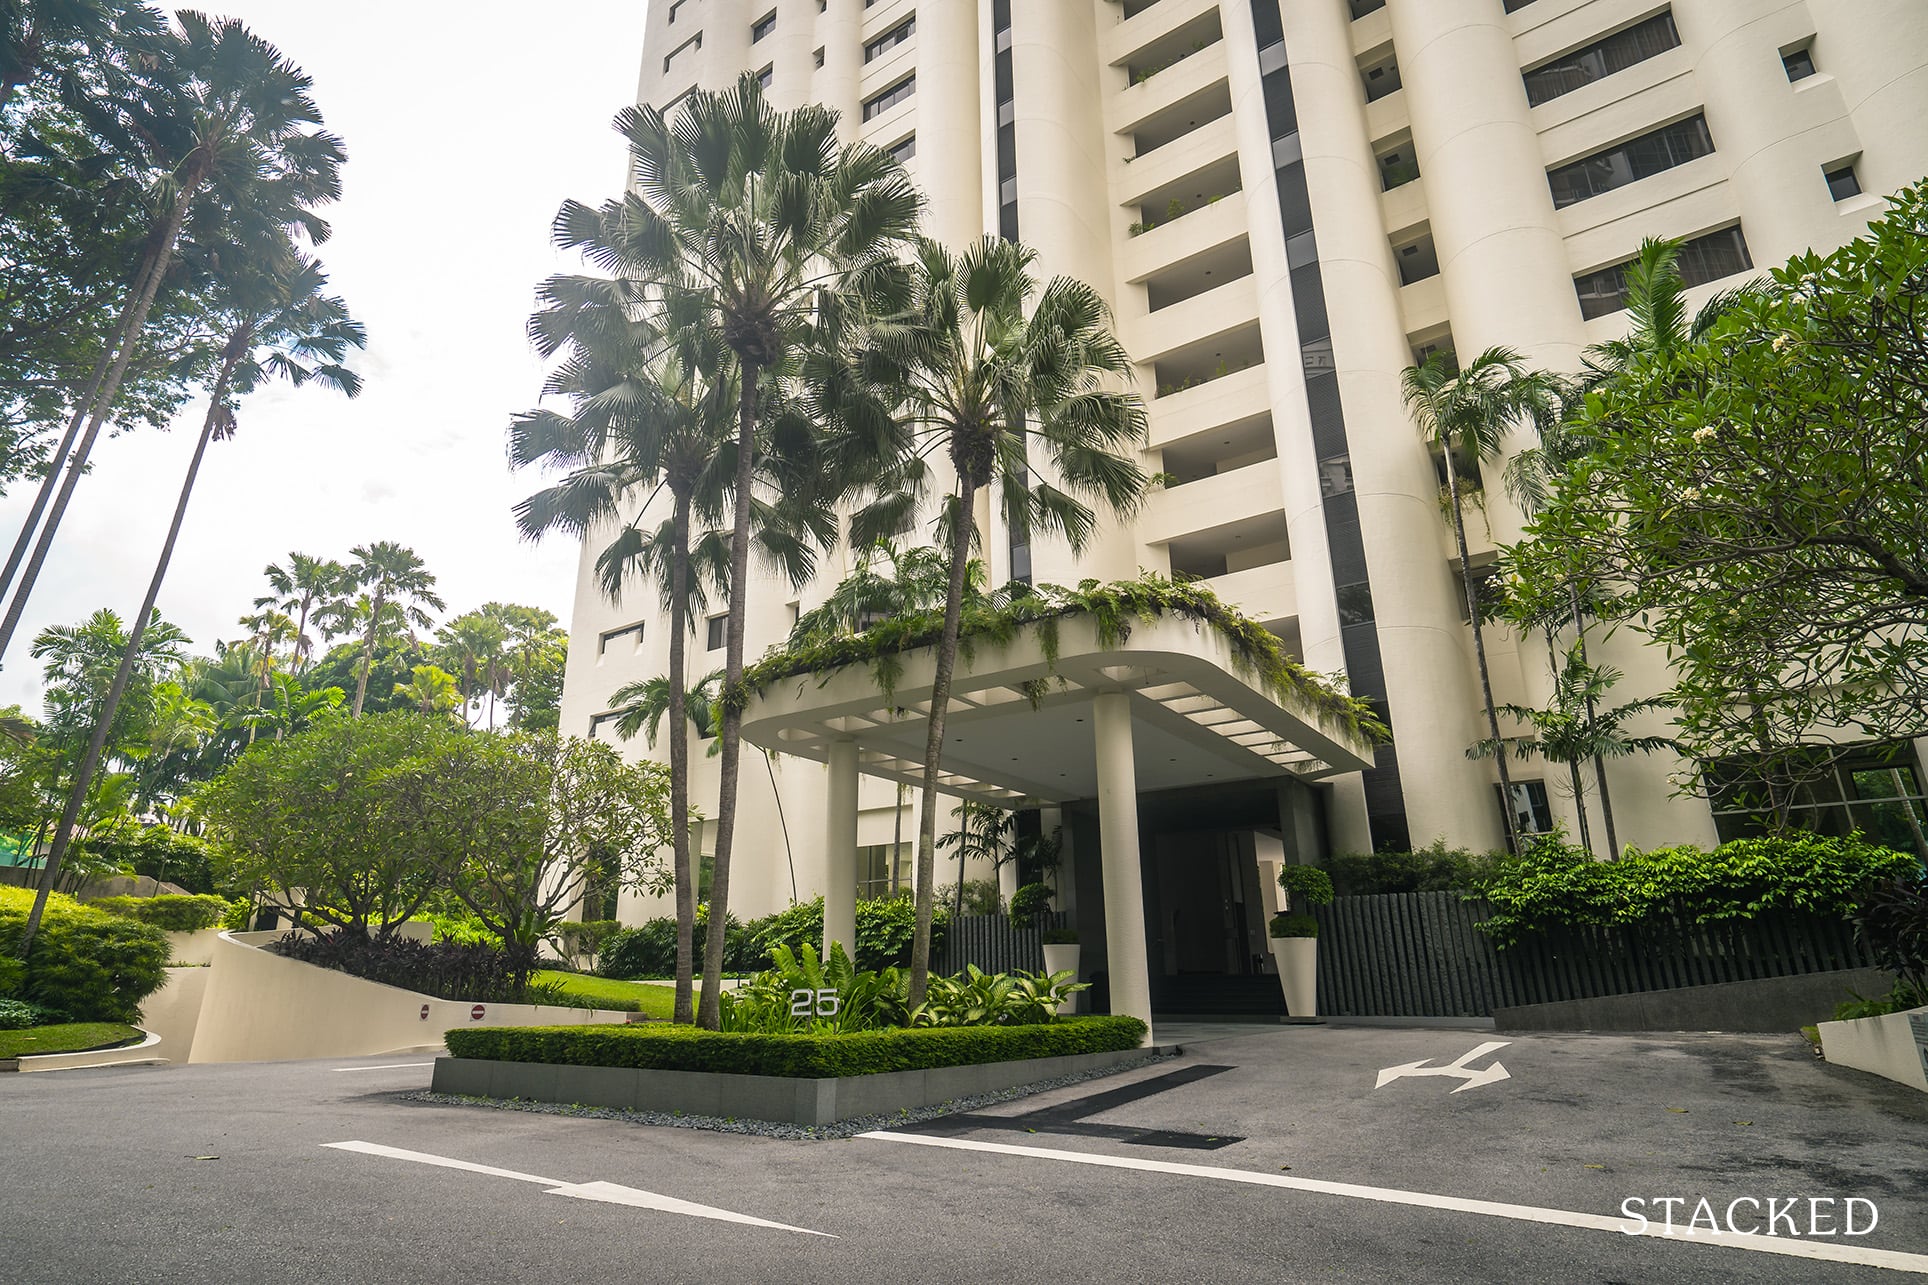
This 3,348 sqft The Claymore unit along Claymore Road recorded a 49% ($2.8m) appreciation from $1,703 psf to $2,539 psf during its sale on 28 Dec 2011.
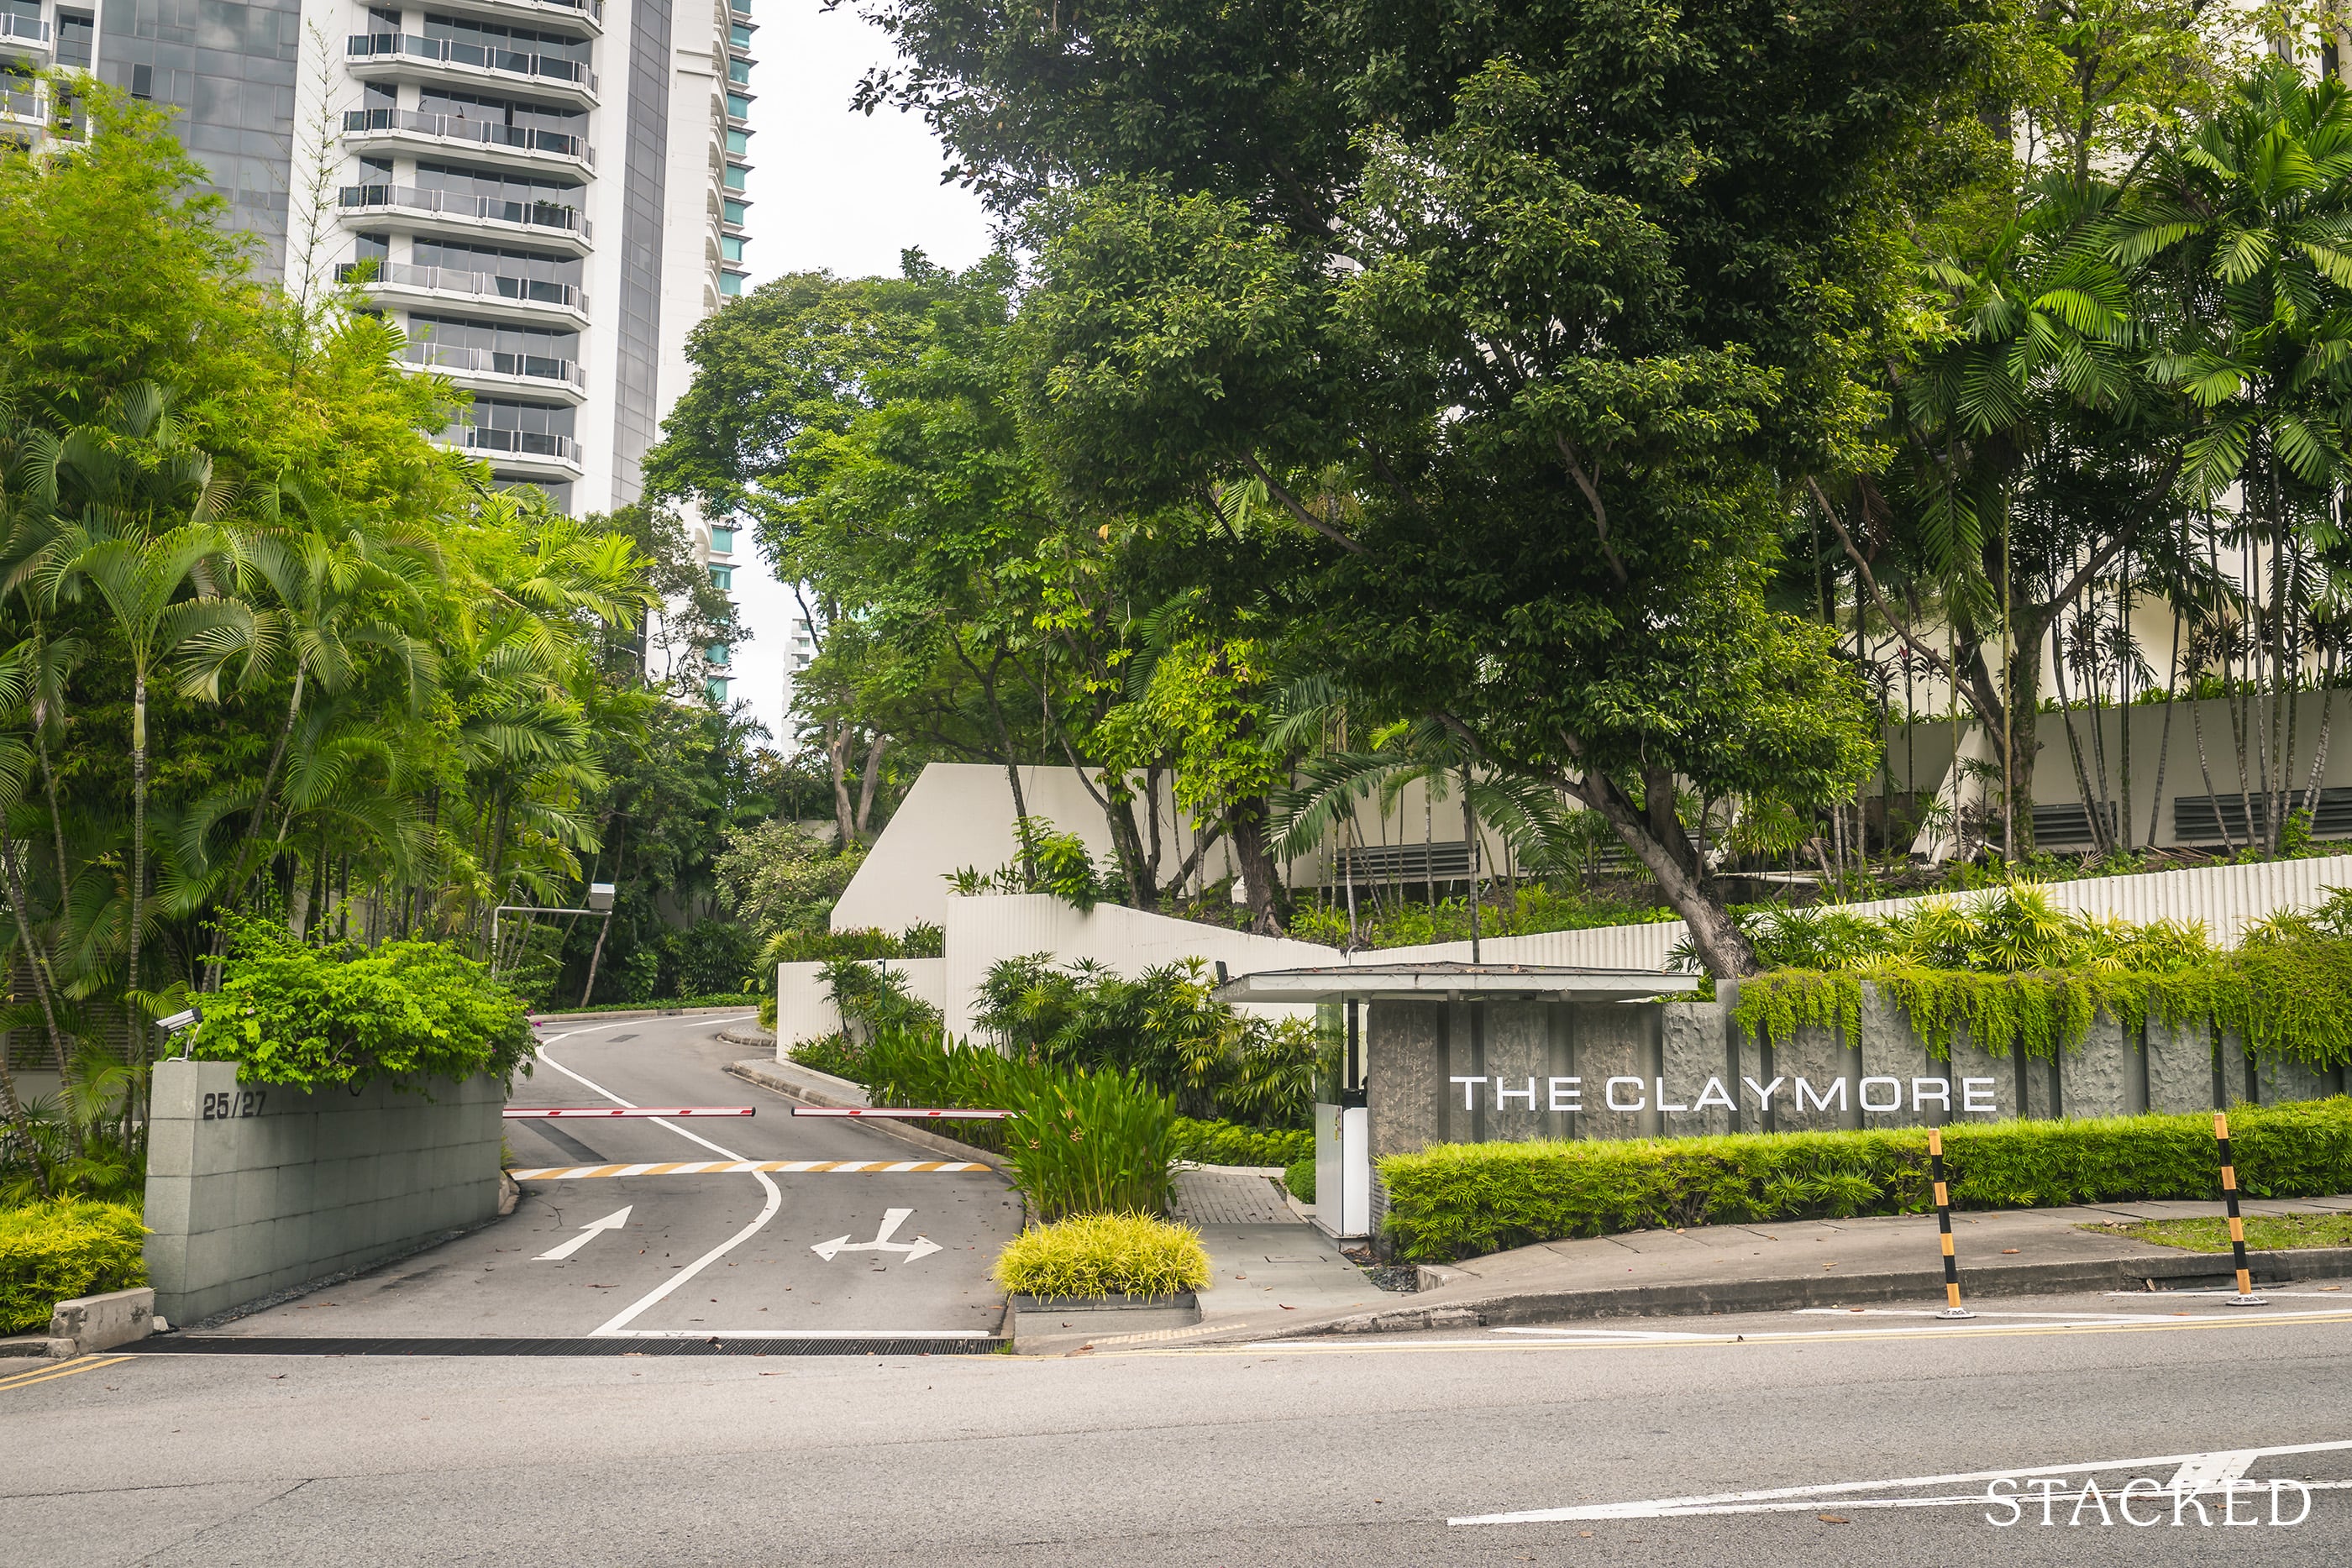
Condo ReviewsThe Claymore Review: Big Units, Lavish Space In Orchard
by Reuben DhanarajBought For: $5.7 million
Sold For: $8.5 million
#4 Belle Vue Residences
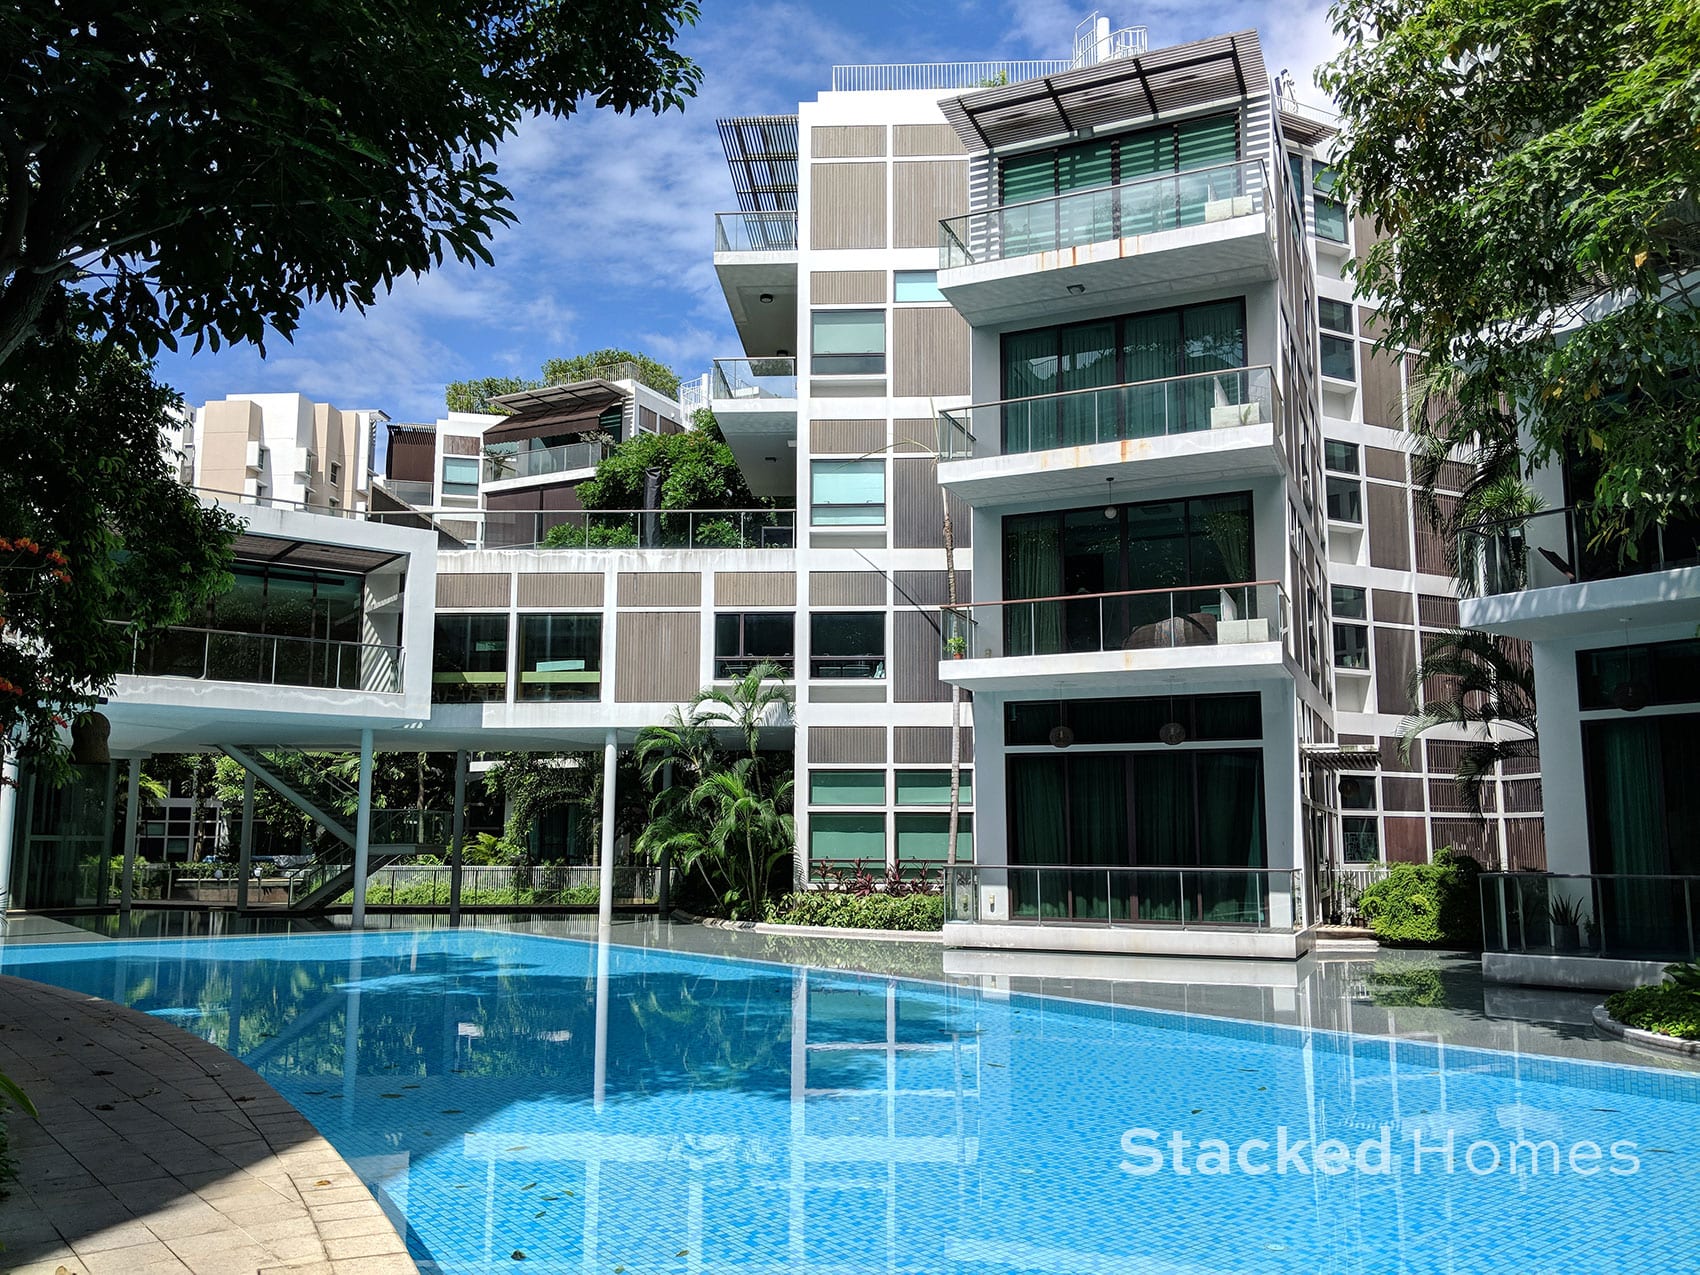
This 2,260 sqft Belle Vue Residences unit along Oxley Walk recorded a 71% ($2.99m) appreciation from $1,859 psf to $3,185 psf during its sale on 10 Mar 2011.
Read our in-depth review here.
Bought For: $4.201 million
Sold For: $7.2 million
#3 Ardmore Park

This is the last Ardmore Park on the list, promise! This 2,885 sqft Ardmore unit along Ardmore Park recorded a 48% ($3.05m) appreciation from $2,184 psf to $3,241 psf during its sale on 12 Aug 2010.
Bought For: $6.3 million
Sold For: $9.35 million
#2 Nassim Park Residences
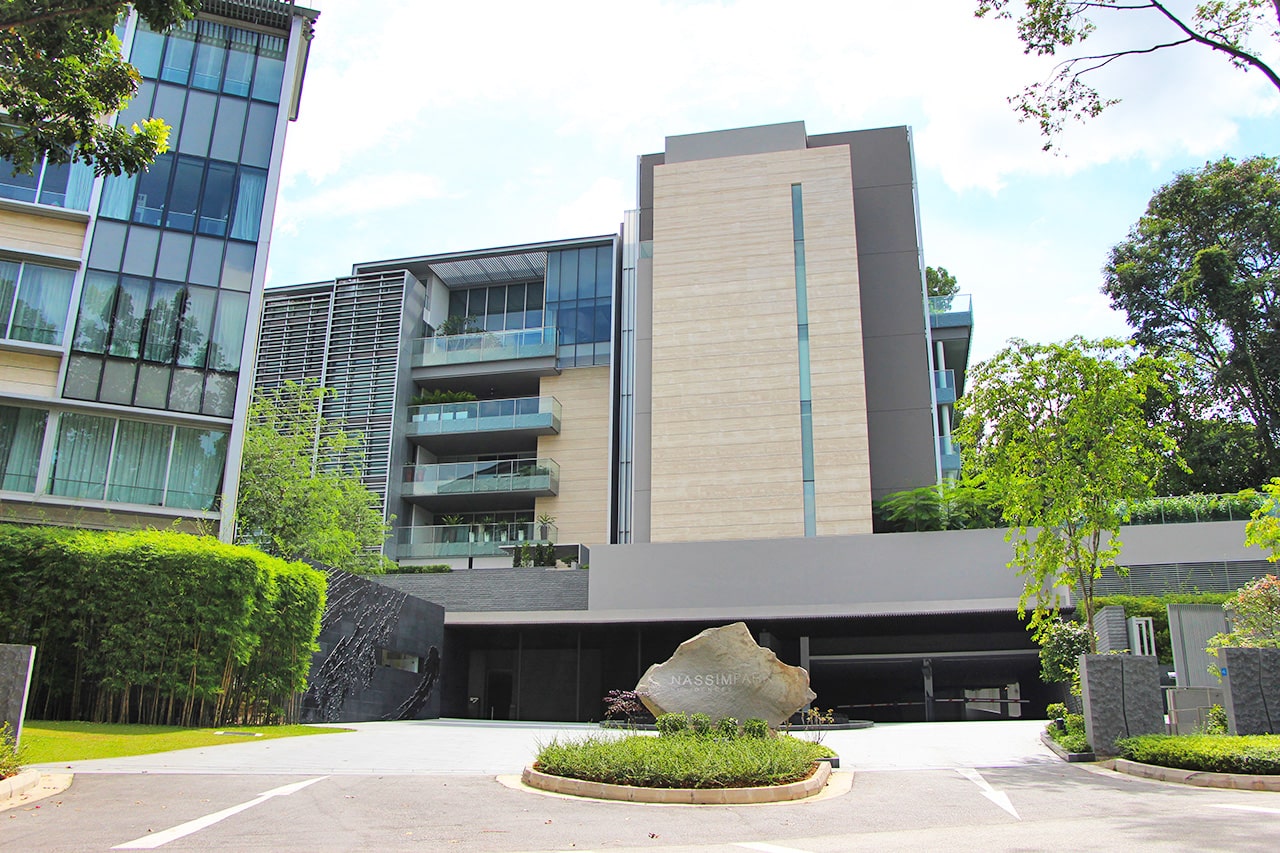
This massive 6,878 sqft Nassim Park Residences unit along Nassim Road recorded a 17% ($3.979m) appreciation from $3,423 psf to $4,001 psf during its sale on 14 Sep 2012.
Bought For: $23.541 million
Sold For: $27.52 million
#1 Nassim Park Residences

Just like our biggest loss list, the top two spots are both occupied by the same development. This one is slightly bigger, at 6,954 sqft. This Nassim Park Residences unit along Nassim Road recorded a 35% ($6.196m) appreciation from $2,600 psf to $3,468 psf during its sale on 5 Apr 2011.
Bought For: $17.914 million
Sold For: $24.111 million
As much as we’d like to continue the more positive tone of the article, there is something that we absolutely have to point out – it doesn’t necessarily mean that buying any property during the property market crash will result in a positive return when the skies are clear. Here, we are just showing the top 10 highest loss making units, with the vast majority from Districts 9 and 10.
| Project Name | Transacted Price ($) | Unit Price ($ psf) | Sale Date | Gains Loss | Absolute Amount |
| St Regis Residences | $8.19m | 2,180 | 8/6/2011 | -26% | $ (2,810,000.00) |
| Nassim Park Residences | $21.2m | 3,082 | 10/3/2016 | -10% | $ (2,310,000.00) |
| St Regis Residences | $6.25m | 2,268 | 1/3/2017 | -27% | $ (2,293,600.00) |
| Orchard Scotts | $2.368m | 1,438 | 7/22/2016 | -41% | $ (1,647,386.00) |
| The Orchard Residences | $5.6m | 3,097 | 8/18/2014 | -13% | $ (818,400.00) |
| Belle Vue Residences | $3.8m | 1,858 | 9/30/2013 | -17% | $ (797,200.00) |
| Duchess Residences | $2.664m | 1,820 | 7/8/2011 | -19% | $ (630,520.00) |
| The Orange Grove | $6.512m | 2,200 | 5/18/2010 | -8% | $ (533,000.00) |
| Concourse Skyline | $1.06m | 1,231 | 9/24/2009 | -33% | $ (521,450.00) |
| Jia | $2.15m | 1,297 | 3/23/2018 | -18% | $ (473,200.00) |
Final Words
Amidst all the pessimism surrounding the property market right now, it’s always worth remembering that there is always light at the end of the tunnel.
That’s not to say you can wildly purchase any property that has a drop in price – the above table is a clear representation of that. All things considered however, only 95 out of 6,422 transactions in that period (1.48%) actually lost money – an overwhelming majority were profitable (gross profits, not including the usual costs) – that’s pretty good odds in our books!
At Stacked, we like to look beyond the headlines and surface-level numbers, and focus on how things play out in the real world.
If you’d like to discuss how this applies to your own circumstances, you can reach out for a one-to-one consultation here.
And if you simply have a question or want to share a thought, feel free to write to us at stories@stackedhomes.com — we read every message.
Frequently asked questions
Which districts in Singapore experienced the highest property appreciation during the 08/09 market crash?
Why did most of the top appreciating districts come from the OCR rather than the CCR during the 08/09 property crash?
What is the significance of the average amount made per unit in different districts during the property market crash?
Are there specific residential units that showed notable appreciation during the market crash?
Does a property’s appreciation during a crash guarantee future profits?
Reuben Dhanaraj
Reuben is a digital nomad gone rogue. An avid traveler, photographer and public speaker, he now resides in Singapore where he has since found a new passion in generating creative and enriching content for Stacked. Outside of work, you’ll find him either relaxing in nature or retreated to his cozy man-cave in quiet contemplation.Need help with a property decision?
Speak to our team →Read next from Property Trends
Property Trends The Room That Changed the Most in Singapore Homes: What Happened to Our Kitchens?
Property Trends Condo vs HDB: The Estates With the Smallest (and Widest) Price Gaps

Property Trends Why Upgrading From An HDB Is Harder (And Riskier) Than It Was Since Covid
Property Trends Should You Wait For The Property Market To Dip? Here’s What Past Price Crashes In Singapore Show
Latest Posts

Singapore Property News Why Some Singaporean Parents Are Considering Selling Their Flats — For Their Children’s Sake
Pro River Modern Starts From $1.548M For A Two-Bedder — How Its Pricing Compares In River Valley
New Launch Condo Reviews River Modern Condo Review: A River-facing New Launch with Direct Access to Great World MRT Station








2 Comments
it’s hard to see the property market falling so low like in 2008-09 with all the cooling measures still in place