Are New Launches A “Sure Win”? We Analyse 450,000 Property Transactions
May 12, 2021

“Buy new launch, sure make money!”
You may have heard of this statement before, whether it’s unsolicited advice from your friends, family, or from agents trying to push a new launch unit to you.
And why not?
This belief is given further weight with terms such as “first-mover advantage” and “developer discounts”.

Another belief is that resale properties tend to make less because the first owner has already “profited” from the new launch.
Of course, some of these are true, and this “truth” may very well hold its weight.
But amidst the rising new launch prices and smaller unit sizes, you may still be wondering if buying a new launch unit would put you in a better position when it comes to capital appreciation.
At Stacked, we’re fond of letting the data do the talking. So without further ado, let’s begin our analysis.
Methodology

For those who are not interested in my approach, feel free to skip to the next section.
So if you’ve ever tried searching for research on whether new launches make more than resale properties, you’ll probably find that the study focuses on comparing just a handful of developments (it could be cherry-picked) or uses average $PSF (not really an accurate representation of actual profits/losses).
In an effort to provide more accurate results, I’ll be focusing on actual unit transactions.
As this piece focuses on actual profit and losses, reasonable care is taken to ensure that profits and losses are based on actual units that have changed hands – not just looking at the general $psf changes within a development.
This means that a buy and sell transaction of the same address (including unit number), project name and size would constitute 1 data point.
Overall, I’ve taken a look at over 450,000 transactions in Singapore since 1995. If you’re wondering why 1995, well, there is no other reason why 1995 was chosen besides the fact that this is the earliest data that you can possibly get.
Data is taken directly from URA, and transactions span from 01 January 1995 to 31 March 2021.
Based on these transactions, there are 152,948 data points (meaning at least 1 buy and 1 sell transaction of the exact unit).
Of these, 538 transactions were excluded as they could be potentially erroneous. As this is a small number of transactions (0.35% of all transactions), its exclusion should not hamper the overall findings.
I have also labelled each data point according to what type of sale it is. For example, a unit recorded as a “resale” transaction by URA which has a previous transaction that’s a “new sale” constitutes as a “New Sale to Resale” transaction – meaning this data point would show the profit/loss of the 1st owner.
A word of warning: URA does not record every single transaction in Singapore, only when a caveat is lodged does it appear in its database. As such, a missing transaction can result in an inaccurate data point. For example, there may have been a resale transaction between the 1st and 3rd owner.
However, if that is not recorded, then it would be as if this transaction happened between the 1st and 2nd owner.
Unfortunately, there’s no way to go about this, and I’ll have to trust that this applies to all the datasets equally so it should not affect the overall findings.
Note: Gains and losses here do not include fees associated with buying and selling, such as stamp duties, agent commissions as well as the cost to renovate.
Now that I’ve gotten the methodology out of the way, let’s take a look at what the data tells us.
Is it more lucrative to buy a new launch than a resale? A look at the data since 1995.
| Type of Sale | Gain | Loss | Average |
| New Sale to Resale | 38.8% | -16.1% | 27.1% |
| New Sale to Sub Sale | 27.1% | -11.7% | 22.5% |
| Resale to Resale | 44.0% | -15.0% | 34.7% |
| Sub Sale to Resale | 33.1% | -18.9% | 18.4% |
| Sub Sale to Sub Sale | 22.6% | -14.5% | 16.8% |
| Average | 38.1% | -15.7% | 28.3% |
There are 5 types of transactions here, briefly:
New Sale to Resale: A transaction has occurred between the 1st owner who bought from the developer, and the 2nd owner any time after TOP is obtained.
New Sale to Sub Sale: Transactions between the 1st and 2nd owner when the building hasn’t reached its TOP date.
Resale to Resale: Transactions where the buyer and the seller both purchases it after the project reached its TOP, with the seller purchasing it after the project reached TOP and not from the developer directly.
Sub Sale to Resale: A transaction between a 2nd owner (onwards) when the building hasn’t hit its TOP date and a buyer when a TOP date is reached.
Sub Sale to Sub Sale: Transactions between a seller and buyer when the TOP date has not been reached.
To simplify, I’ll be mainly focusing on “New Sale to Resale” and “Resale to Resale” transactions.
What does the data tell us?
If you take a look at the data, you’ll immediately notice that buying a new launch unit from the developer and selling it after TOP is less profitable than just buying and selling it as a resale project (27.1% vs 34.7%).
Surprising, isn’t it?
But hold your horses, as there’s more to it that I’ll show further below.
Now what about the holding period?
| Type of Sale | Gain | Loss | Average |
| New Sale to Resale | 8.8 Years | 7.6 Years | 8.6 Years |
| New Sale to Sub Sale | 2.4 Years | 2.8 Years | 2.5 Years |
| Resale to Resale | 6 Years | 5.5 Years | 5.9 Years |
| Sub Sale to Resale | 8 Years | 7.4 Years | 7.8 Years |
| Sub Sale to Sub Sale | 1.2 Years | 2 Years | 1.3 Years |
| Average | 6.4 Years | 6.3 Years | 6.4 Years |
According to the data, homeowners who purchased from the developer directly and sold it after the project obtained its TOP tend to hold onto the unit 2.7 years longer.
One reason why the holding period for the first owner could be longer is because you have to wait for the home to be built, whereas those who bought a resale development could enjoy the home relatively quickly.
What does this mean?
You’ll immediately realise 2 things that may seem contrary to the thinking today:
- Buying a new sale to sell later on after its TOP does not necessarily put you in a better position than buying resale.
- Those who buy new property seem to be less concerned about making a quick dollar given the longer holding period.
For point 1, it’s important to note that crunching 25 years of data may not be the best representation of the Singapore property market.
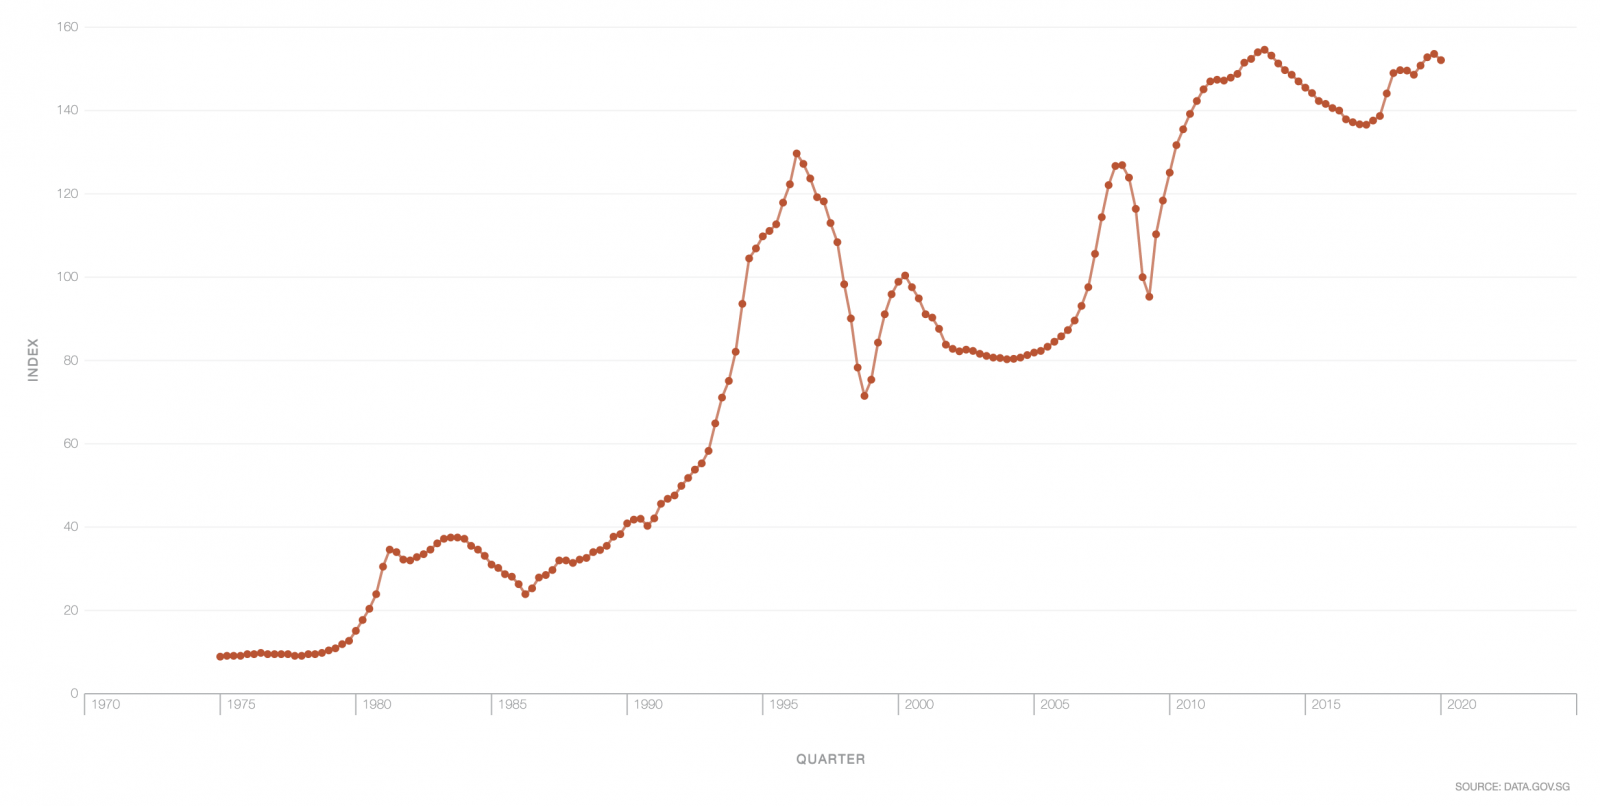
Over the past 25 years, the market has seen many ups and downs, as well as changes in consumer preferences, developer strategies, financing options/costs as well as government policies.
No two cycles are the same, and the different timeline is something I’ll explore below.
For point 2, besides having to wait for the condo to be built, you should know that many of the “New Sale to Resale” buyers may actually include genuine home owners who aren’t looking to make a quick gain.
The average holding period is indicative of this – especially if we’re looking at 25 years of data.
Prior to the SSD and ABSD, sub sales were very common. Property buyers looking to make a quick gain tend to fall under the “New Sale to Sub Sale” and “Sub Sale to Sub Sale” category – so the ‘flippers’ are essentially funnelled into these categories out of the “New Sale to Resale” category. This was very prominent during the 2007-2013 era when property prices jumped.
You’ll see that both categories have an average holding period of just 2.5 years and 1.3 years respectively.
If you look at Sub Sale to Resale transactions, however, the holding period is generally longer – yet it’s less profitable. This could be explained by the fact that Sub Sale to Resale transactions tend to be the very last owner that purchased before TOP is reached, so a high price could’ve been paid by the Sub Sale owner. This is evident from the data where Sub Sale to Sub Sale transactions gain, on average, 16.84% with a very short holding period of just 1.3 years.
But how many buyers are actually profitable?
Now gains are one thing, but what you’d probably want to know is how many people actually make a profit versus a loss.
Here’s what the data tells us:
| Type of Sale | Breakeven | Gain | Loss |
| New Sale to Resale | 0.1% | 78.6% | 21.3% |
| New Sale to Sub Sale | 0.1% | 88.2% | 11.7% |
| Resale to Resale | 0.5% | 84.2% | 15.3% |
| Sub Sale to Resale | 0.5% | 71.5% | 28.1% |
| Sub Sale to Sub Sale | 0.2% | 84.4% | 15.4% |
| Type of Sale | Breakeven | Gain | Loss | Grand Total |
| New Sale to Resale | 47 | 41,942 | 11,362 | 53,351 |
| New Sale to Sub Sale | 20 | 19,025 | 2,520 | 21,565 |
| Resale to Resale | 286 | 49,798 | 9,027 | 59,111 |
| Sub Sale to Resale | 69 | 10,159 | 3,989 | 14,217 |
| Sub Sale to Sub Sale | 8 | 3,517 | 641 | 4,166 |
| Grand Total | 430 | 124,441 | 27,539 | 152,410 |
Based on the data, the proportion of those who gained from purchasing and selling a resale flat is higher than those who bought first hand and sold it after its TOP date.
You can see that in terms of volume, “flippers” (New Sale to Sub Sale and Sub Sale to Sub Sale) represent about 17% of transactions – a pretty high number!
So since January 1995 to 31st March 2021, it seems that those who purchased a resale project fared better – both in terms of overall gains as well as in proportion of gains.
Looking at 25 years of data may not say much
Here’s the thing, comparing transactions across this 25-year period isn’t too fair – given how the Singapore market is always changing. So let’s take a look at transactions purely in the past 10 years – specifically from when the strict SSD rule was introduced: 14 January 2011.
How have the different types of home buyers fared since the 14 Jan 2011 SSD was introduced?
More from Stacked
Should You Buy ELTA? A Pricing Review Against Clavon, Clement Canopy And Other New Launches
Welcome to our pricing review of ELTA, the newest (and final) Government Land Sales (GLS) site along Clementi Avenue 1.…
With the introduction of the 4, 8, 12 16 SSD rule (where 16% is charged if you sell within the 1st year and 4% within the 3rd and 4th year) since 14 January 2011, “flipping properties” became less common.
Looking at transactions since 2011 would also take into account more recent projects (expect smaller new launches).
Given this shift, how has the profitability changed? Here’s a look at the data.
| Type of Sale | Gain | Loss | Average |
| New Sale to Resale | 11.6% | -7.1% | 7.9% |
| New Sale to Sub Sale | 14.9% | -6.1% | 13.1% |
| Resale to Resale | 12.6% | -7.7% | 6.9% |
| Sub Sale to Resale | 10.5% | -7.7% | 4.0% |
| Sub Sale to Sub Sale | 16.0% | No Data | 16.0% |
| Average | 12.3% | -7.4% | 7.7% |
Based on the data, on average those who bought from the developer and sold it later when the project reaches its TOP made more – which is different from when we compare results across 25 years.
In terms of those who gained, new launch buyers do lose out to those who bought resale by a marginal amount.
However, its losses are also less on average, resulting in New Sale to Resale transactions making about 1% more as a whole.
So what does this tell us?
In terms of percentage gains and losses, the performance between both types of sale is quite close, so it’s not clear which type of buyer fared better over this period.
However, if we take a look at the proportion of those that made versus losing between both types of sales, you’ll see that the tables have turned:
| Type of Sale | Breakeven | Gain | Loss |
| New Sale to Resale | 0.1% | 80.3% | 19.6% |
| New Sale to Sub Sale | 0.1% | 91.5% | 8.4% |
| Resale to Resale | 1.5% | 71.3% | 27.2% |
| Sub Sale to Resale | 0.7% | 64.1% | 35.2% |
| Sub Sale to Sub Sale | 0.0% | 100.0% | 0.0% |
| Type of Sale | Breakeven | Gain | Loss | Grand Total |
| New Sale to Resale | 12 | 7,489 | 1,830 | 9,331 |
| New Sale to Sub Sale | 2 | 1,899 | 175 | 2,076 |
| Resale to Resale | 124 | 5,932 | 2,265 | 8,321 |
| Sub Sale to Resale | 12 | 1,069 | 587 | 1,668 |
| Sub Sale to Sub Sale | No Data | 27 | No Data | 27 |
| Grand Total | 150 | 16,416 | 4,857 | 21,423 |
Since 14 Jan 2011, a greater proportion of those who purchased from the developer and sold their unit after the TOP date made money as compared to those who bought resale.
A result of 80.3% versus 71.3% is pretty stark compared to looking at 25 years of data, where it is just 78.62% versus 84.24%.
This does go in line with the general idea that buying from the developer puts you in a better position to make money – but it’s still not by a long shot as some people might make you think.
Since 14 Jan 2011, here’s what the holding period of those who bought and sold between then and now looks like:
| Type of Sale | Gain | Loss | Average |
| New Sale to Resale | 6.4 Years | 6.6 Years | 6.4 Years |
| New Sale to Sub Sale | 4.2 Years | 4.3 Years | 4.2 Years |
| Resale to Resale | 5.9 Years | 5.6 Years | 5.8 Years |
| Sub Sale to Resale | 6.2 Years | 5.9 Years | 6.1 Years |
| Sub Sale to Sub Sale | 1.6 Years | No Data | 1.6 Years |
| Average | 5.9 Years | 5.9 Years | 5.9 Years |
Similar to data aggregated from 1995, new owners who later sold after the project reached TOP tend to hold onto their purchase longer than those who purchased a resale project.
Overall, the average holding period is reduced. That said, I wouldn’t necessarily conclude that buyers in the past 10 years tend to hold onto their units for shorter compared to over 25 years, as reducing the time period of analysis naturally results in a higher proportion of transactions that were bought and sold within the shorter time period.
What’s interesting is the gap between those who bought new and those who bought resale – just 0.6 years.
One reason why this is the case could be due to the SSD. With this implementation, there are fewer people who can “flip” properties, so a greater proportion of those who are looking to buy for short-term capital gains would now fall under the “New Sale to Resale” category instead, whether they’re for own stay or investment purposes.
This is evident by the lack of a loss transaction under “Sub Sale to Sub Sale”, and also a much longer holding period for “New Sale to Sub Sale” from 2.5 years to 4.2 years.
But things have changed in the past 5 years too
In the past 5 years, we’ve seen a strong trend of developers building smaller priced at higher $PSF.
The introduction of the developer’s ABSD has resulted in developers having to clear all their inventory, or pay a hefty penalty of 30% of the land price – an amount that could easily wipe out all their profits and more.
This has forced them to build smaller units to create a palatable quantum that buyers can accept.
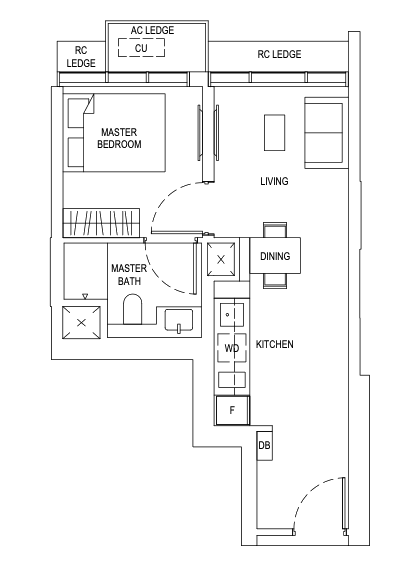
So with this trend in play, how have the different types of buyers fared in the past 5 years?
Do note: looking at the past 5 years means we’re strictly looking at transactions bought and sold in the last 5 years. This reduces the number of transactions to work with, and it also naturally filters purchases around 2015-2017 to sales in 2018-2021 (given the SSD in play). This could result in a positive bias given how the market has picked up over the past 2-3 years.
With that said, here’s a look at the data from 01 January 2015 to 31 March 2021:
| Type of Sale | Gain | Loss | Average |
| New Sale to Resale | 13.9% | -5.5% | 11.8% |
| New Sale to Sub Sale | 17.4% | -6.4% | 16.8% |
| Resale to Resale | 14.0% | -7.3% | 10.6% |
| Sub Sale to Resale | 9.4% | -4.5% | 4.5% |
| Sub Sale to Sub Sale | 1.0% | No Data | 1.0% |
| Average | 14.5% | -6.6% | 11.8% |
On average, those who purchased from the developer and sold it after its TOP date tend to make about the same as those who purchased resale, with a 1.2% difference.
In terms of gains, new launch and resale buyers make around the same.
Resale buyers who lost money tend to lose more than those who purchased from the developer and sold it after reaching TOP – a 1.8% difference.
And in terms of how many have gained, here’s what the data looks like:
| Type of Sale | Breakeven | Gain | Loss |
| New Sale to Resale | 0.6% | 88.7% | 10.7% |
| New Sale to Sub Sale | 0.2% | 97.3% | 2.4% |
| Resale to Resale | 1.1% | 83.4% | 15.5% |
| Sub Sale to Resale | 0.0% | 64.9% | 35.1% |
| Sub Sale to Sub Sale | 0.0% | 100.0% | 0.0% |
| Type of Sale | Breakeven | Gain | Loss | Grand Total |
| New Sale to Resale | 4 | 620 | 75 | 699 |
| New Sale to Sub Sale | 1 | 437 | 11 | 449 |
| Resale to Resale | 14 | 1,075 | 200 | 1,289 |
| Sub Sale to Resale | No Data | 61 | 33 | 94 |
| Sub Sale to Sub Sale | No Data | 1 | No Data | 1 |
| Grand Total | 19 | 2,194 | 319 | 2,532 |
It seems that overall, a larger portion of people who buy new launch and sell after the TOP date are profitable compared to those who buy resale units – the difference being 5.3%. This difference is actually less than if we looked at transactions since 14 Jan 2011.
So what does all this mean?
The data since 14 Jan 2011 and the past 5 years does indicate a slight bias towards better performance if you were to purchase a new sale property as compared to resale.
However, I would add that this difference is not stark enough to validate the notion that “New launch sure make!”.
Why does this notion perpetuate in the market?
Even though “Resale to Resale” transactions can be profitable as much as “New Sale to Resale” transactions, it is just a lot more difficult to find opportunities with resale projects.
It goes without saying that there are many times more resale properties than there are new sales. To analyse transactions and identify value-finds in the resale market can be daunting.
Resale projects also come with complications, such as:
- Not being able to secure a viewing due to issues such as tenants staying
- Having to take into account conditions of the flat and potentially unexpected costs to touch up the place
- Not having any listings at all
- Dealing with uncooperative seller agents
In terms of financing, purchasing a resale flat can also be costly as a total down payment of 25% is required – and even more so if you currently have a housing loan.
On the other hand, there are only that many New Launches in the market at any one time. As the pricing is determined by the developer, and units are available for selection in a transparent manner, buyers can easily compare new launches against each other, or against its surrounding resale competitors.
This creates an opportunity to identify value-finds much more easily. One example is the Penrose launch which was priced very competitively against Sims Urban Oasis.

Property Investment InsightsAnalysing Unprofitable Condos: 6 Reasons Why The Tennery Has Performed Poorly
by Sean GohMoreover, financing costs are a lot less up front given the loan is staggered as the projects get built, reducing the initial interest costs as opposed to resale developments.
Another point to consider is how early you purchase a new launch unit – particularly those that manage to purchase within the 1st day. Such buyers are usually able to snag a unit at the marketed price (which is usually low to draw in a crowd). Like being number 1 or 2 on the BTO queue, these buyers would stand to make good gains if they sell on the resale market later on.
That being said, do bear in mind that despite these advantages, there are new launches that do poorly in the secondary market – often for reasons that are unforeseen upon purchase such as our recent case study on The Tennery.
Do not neglect resales too
Resale units do offer buyers a chance to earn rental income. While it is difficult to achieve cashflow positive rental income in this day and age, buyers of resale properties could stand to gain more assuming the total rental earned is more than costs incurred like interest expense, taxes and maintenance fees. These gains are not accounted for in the data above, and could potentially result in new launches being less profitable than resale ones.
Concluding thoughts
Property buyers should be wary of the notion that new launches are sure wins. While the data in the past 5 and 10 years have shown a greater proportion of new launch buyers making money, it’s not significant enough to assume you would too.
The advantage to buying a new launch as mentioned, is the ease of identifying value-finds given the limited options, wide selection of units as well as having lower financing costs.
But you should also balance your needs – such as the urgency to move in, importance of location (new launches are limiting) and whether rental income is important to you.
As with any property purchase, it is important to do your research. If you do need any help searching for a property, you can contact us at stories@stackedhomes.com or just drop us a message here.
At Stacked, we like to look beyond the headlines and surface-level numbers, and focus on how things play out in the real world.
If you’d like to discuss how this applies to your own circumstances, you can reach out for a one-to-one consultation here.
And if you simply have a question or want to share a thought, feel free to write to us at stories@stackedhomes.com — we read every message.
Frequently asked questions
Do new property launches usually make more profit than resale homes?
How long do people typically hold onto property before selling?
Are property flippers more common in recent years?
What percentage of property transactions result in gains versus losses?
Has the profitability of buying from the developer improved in recent years?
Sean Goh
Sean has a writing experience of 3 years and is currently with Stacked Homes focused on general property research, helping to pen articles focused on condos. In his free time, he enjoys photography and coffee tasting.Need help with a property decision?
Speak to our team →Read next from Property Investment Insights

Property Investment Insights This Singapore Condo Has Bigger Units Near The MRT — But Timing Decided Who Made Money

Property Investment Insights We Compared Lease Decay Across HDB Towns — The Differences Are Significant

Property Investment Insights This Singapore Condo Skipped 1-Bedders And Focused On Space — Here’s What Happened 8 Years Later
Property Investment Insights Why Buyers in the Same Condo Ended Up With Very Different Results
Latest Posts

Editor's Pick Happy Chinese New Year from Stacked

Singapore Property News Nearly 1,000 New Homes Were Sold Last Month — What Does It Say About the 2026 New Launch Market?

Editor's Pick How I’d Invest $12 Million On Property If I Won The 2026 Toto Hongbao Draw




4 Comments
I suppose that the data here does not take into account transaction fees such as the various stamp duties, agent’s commission as well as renovation costs (important distinction new-resale vs resale-resale transactions).
Thank you for an impressive write up. In comparing new launches against resale, the capital outlay is much lesser for new launches as compared to a resale units. In a resale transaction, initial outlay is the 25% plus legal and stamp duty followed by 4 years of instalments before one could sell to avoid sellers’ stamp duty. In comparison, the capital outlay is much lesser in the case of new launches, 1st few years will have progress payments and 4th year it can be sold. In your computation were these number factored? i am asking purely for the seek of understanding?