Old vs New Family-Sized Condos in District 9: A Data-Driven Analysis of Value in 2025

Get The Property Insights Serious Buyers Read First: Join 50,000+ readers who rely on our weekly breakdowns of Singapore’s property market.

A seasoned content strategist with over 17 years in the real estate and financial journalism sectors, Ryan has built a reputation for transforming complex industry jargon into accessible knowledge. With a track record of writing and editing for leading financial platforms and publications, Ryan's expertise has been recognised across various media outlets. His role as a former content editor for 99.co and a co-host for CNA 938's Open House programme underscores his commitment to providing valuable insights into the property market.
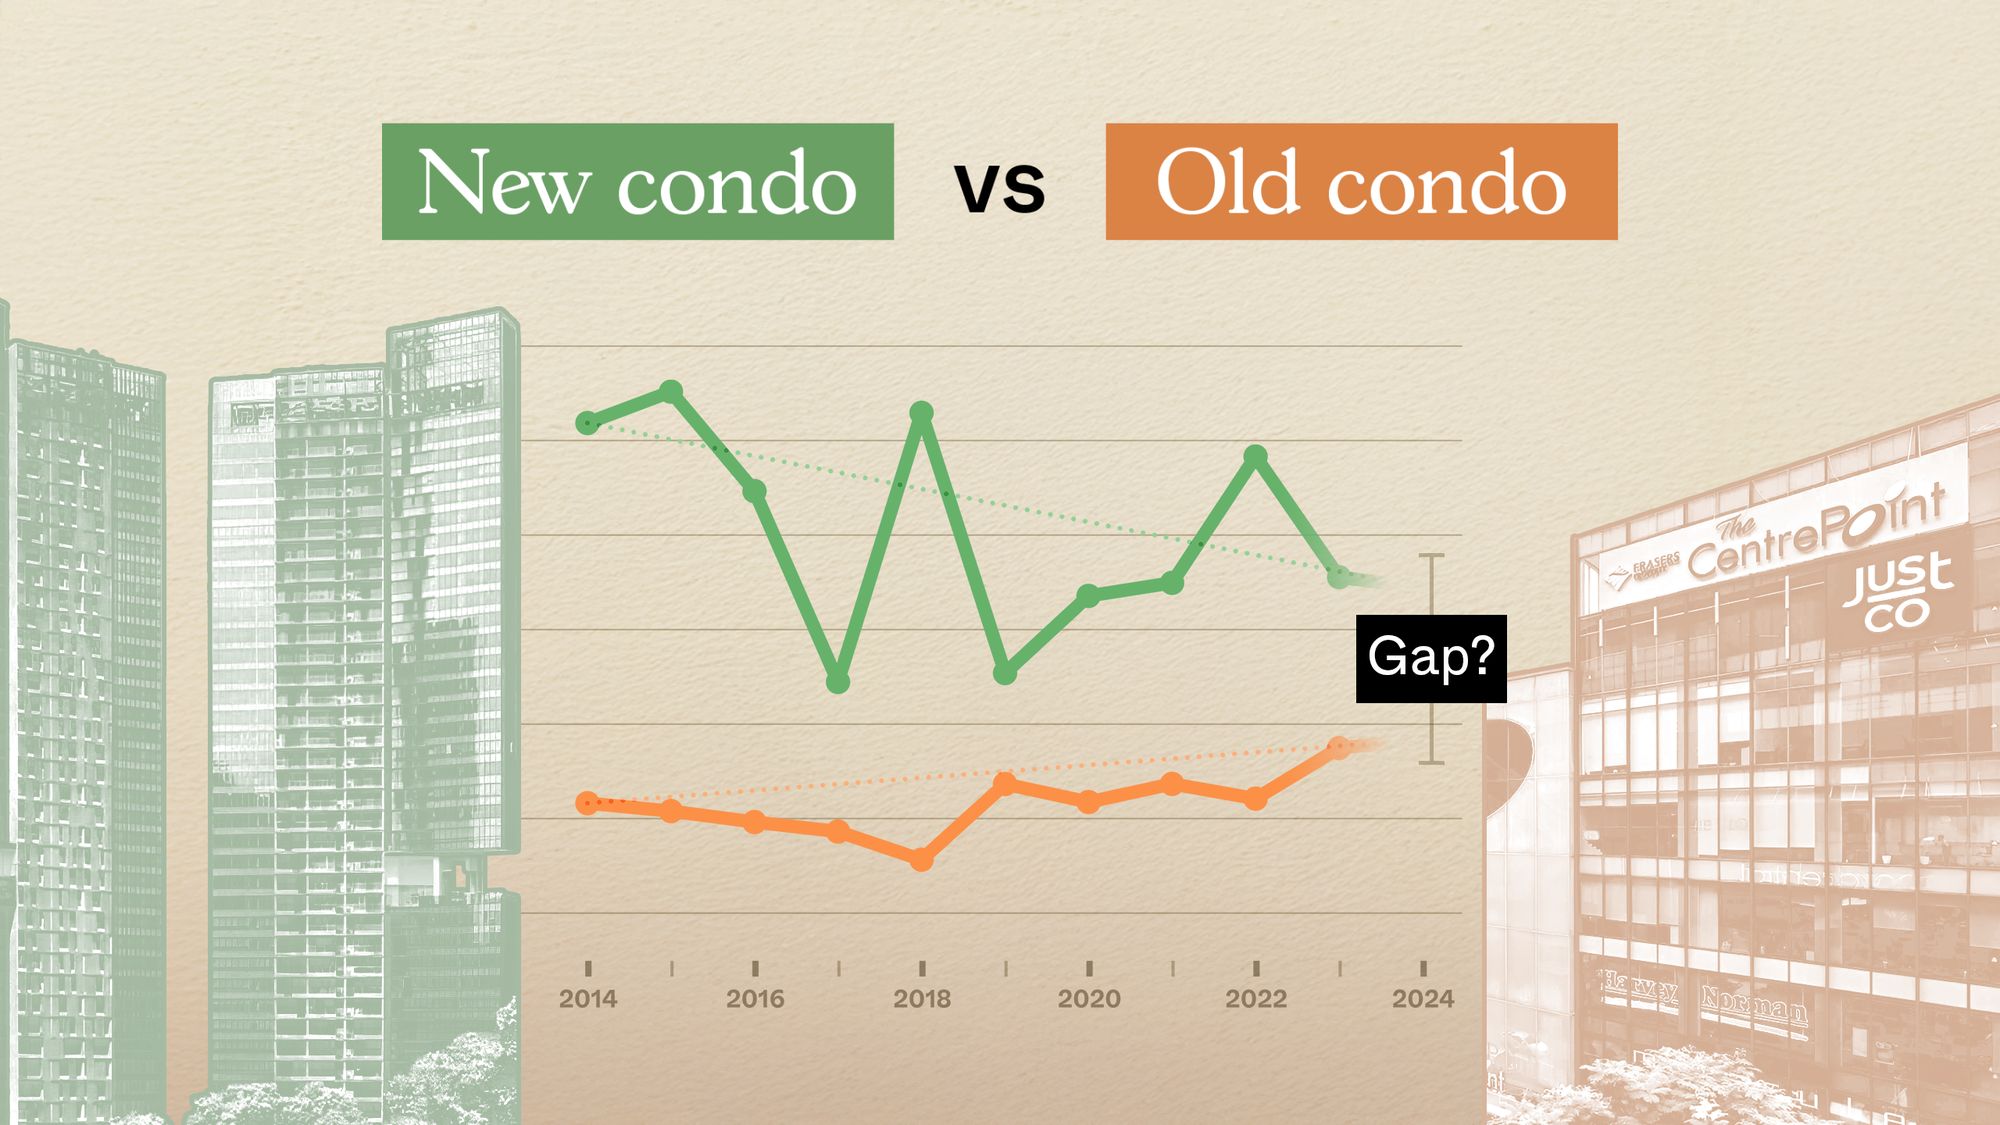
Previously, we looked at price movements of older versus newer one and two-bedders in District 9 (D9). When it comes to family-sized units, however, there could be some major differences. Will we see the same gains in units that are predominantly for owner-occupiers, rather than investors? And how will the older projects fare, given their often outsized layouts and higher quantum? In this piece, we’ll dive into three- and four-bedder trends in D9, and see whether their age makes a difference at this end of the market:
A quick note on newer versus older
We use 20 years or younger for newer (not new, mind you, but just newer) because most projects in Singapore last 19 to 24 years – so it’s a good middle point. It’s also generally accepted in the market (by convention and no particular authority) that the 20+ age range is when most condos are referred to as “older.”
Let’s start with a look at three-bedder prices and how they’ve moved, in different age brackets:
Three-bedroom units
Average $PSF
Year | New | Old | Difference |
2014 | $2,903 | ||
2015 | $1,938 | ||
2016 | $2,395 | $771 | $1,624 |
2017 | $2,492 | $1,195 | $1,297 |
2018 | $1,711 | ||
2019 | $2,129 | $1,467 | $661 |
2020 | $2,422 | $661 | $1,761 |
2021 | $1,675 | $609 | $1,066 |
2022 | $1,898 | $1,904 | -$6 |
2023 | $2,064 | $1,633 | $431 |
2024 | $2,206 | $1,608 | $598 |
Annualised | -1.03% | 9.62% |

Since there were no old three-bedder transactions in 2014 and 2015, we’ll look at 2016 to 2024 instead.
We see a rather sharp difference here: older three-bedders recorded an impressive annualised growth rate of about 9.6 per cent, while newer ones saw a decline of around –1.0 per cent.
That said, the $PSF of new projects has consistently been higher than that of older ones. What’s changed is that, from 2016 to 2024, the difference in $PSF between new and old has narrowed substantially, showing that the older projects are catching up in relative value.
Let’s see how this looks if we focus on quantum instead:
Average price
Year | New | Old | Difference |
2014 | $5,900,000 | ||
2015 | $3,466,633 | ||
2016 | $3,742,705 | $1,550,000 | $2,192,705 |
2017 | $4,029,014 | $2,070,000 | $1,959,014 |
2018 | $3,004,575 | ||
2019 | $3,491,111 | $2,649,647 | $841,464 |
2020 | $4,489,000 | $1,550,000 | $2,939,000 |
2021 | $2,374,000 | $1,430,000 | $944,000 |
2022 | $2,743,044 | $3,300,000 | -$556,956 |
2023 | $3,066,857 | $2,830,000 | $236,857 |
2024 | $3,237,037 | $2,950,000 | $287,037 |
% increase from 2016 to 2024 | -13.51% | 90.32% |

The outperformance of the older three-bedders is even clearer when we go by quantum. From 2016 to 2024, older three-bedders almost doubled in average price – up about 90 per cent – while newer ones declined by around 13.5 per cent.
Back in 2016, newer three-bedders averaged $3.74 million compared to just $1.55 million for older ones, a gap of over $2.1 million. By 2024, that difference had shrunk to less than $300,000, with newer units averaging about $3.24 million and older ones at $2.95 million.
The larger layouts of the older units appear to have outweighed any age disadvantage. And on that note, here are the size differences:
Average size (based on units transacted)
Year | New | Old |
2014 | 2031 | |
2015 | 1781 | |
2016 | 1545 | 2142 |
2017 | 1642 | 1733 |
2018 | 1659 | |
2019 | 1629 | 1839 |
2020 | 1817 | 2347 |
2021 | 1442 | 2347 |
2022 | 1474 | 1733 |
2023 | 1447 | 1733 |
2024 | 1452 | 1892 |

Although the size differences are not as notable as with one and two-bedders, we can see that older three-bedders are larger on average.
This is the number of transactions:
Year | New | Old |
2014 | 3 | |
2015 | 6 | |
2016 | 74 | 3 |
2017 | 53 | 4 |
2018 | 8 | |
2019 | 9 | 6 |
2020 | 10 | 1 |
2021 | 12 | 1 |
2022 | 15 | 1 |
2023 | 7 | 1 |
2024 | 24 | 4 |
Now let’s look at the specific projects transacted in 2024:
New
Project | Average $PSF | Average price | Average size | No. of unit sold | Lease start year |
SOPHIA HILLS | $2,171 | $2,139,800 | 986 | 5 | 2013 |
THE QUAYSIDE | $1,698 | $2,301,000 | 1357 | 3 | 1994 |
SUITES AT ORCHARD | $1,807 | $2,840,000 | 1572 | 1 | 2007 |
ORCHARD SCOTTS | $1,799 | $3,116,667 | 1773 | 3 | 2001 |
OUE TWIN PEAKS | $2,328 | $3,312,000 | 1422 | 9 | 2010 |
THE ORCHARD RESIDENCES | $2,943 | $6,029,629 | 2052 | 3 | 2006 |
Old
Project | Average $PSF | Average price | Average size | No. of unit sold | Lease start year |
TOWNHOUSE APARTMENTS | $1,035 | $2,450,000 | 2368 | 1 | 1977 |
LEONIE GARDENS | $1,798 | $3,116,667 | 1733 | 3 | 1990 |
Among the newer developments, prices ranged from about $2.14 million at Sophia Hills to over $6 million at The Orchard Residences. Projects like OUE Twin Peaks and Orchard Scotts sat in the $3.1 to $3.3 million range, while The Quayside and Suites at Orchard averaged between $2.3 and $2.8 million.
By comparison, the older projects – Townhouse Apartments (1977) and Leonie Gardens (1990) – recorded average prices of $2.45 million and $3.12 million, respectively. This is comfortably within the same range as many of the newer projects.
Townhouse Apartments has a lower $PSF, so it made the price range through sheer size (2,368 sq ft at just $1,035 psf), while Leonie Gardens matched newer projects almost dollar-for-dollar on both $PSF and quantum.
To see if this holds up as a longer-term trend, let’s examine the performance of these projects over the past 10 years. We’ll highlight the newer developments for easier differentiation:
Year | SOPHIA HILLS | THE QUAYSIDE | SUITES AT ORCHARD | ORCHARD SCOTTS | OUE TWIN PEAKS | THE ORCHARD RESIDENCES | TOWNHOUSE APARTMENTS | LEONIE GARDENS |
2014 | $1,564 | $3,572 | ||||||
2015 | $1,323 | $1,451 | $3,041 | |||||
2016 | $1,254 | $1,729 | $1,433 | $2,546 | $3,462 | $1,269 | ||
2017 | $1,171 | $1,300 | $1,482 | $2,754 | $2,917 | $1,195 | ||
2018 | $1,390 | $1,594 | $3,731 | |||||
2019 | $1,402 | $1,545 | $2,423 | $3,069 | $1,008 | $1,559 | ||
2020 | $1,447 | $1,536 | $2,306 | $3,018 | ||||
2021 | $2,024 | $1,486 | $1,547 | $2,616 | ||||
2022 | $2,012 | $1,617 | $1,567 | $2,498 | $1,904 | |||
2023 | $2,048 | $1,693 | $1,834 | $3,081 | $1,633 | |||
2024 | $2,171 | $1,698 | $1,807 | $1,799 | $2,328 | $2,943 | $1,035 | $1,798 |
Annualised | 3.91% | 3.09% | -0.80% | -0.83% | 0.53% | 2.89% |
More from Stacked
How A Clement Canopy Condo Buyer Made $700K More Than Their Neighbours: A Data Breakdown On Timing
In this Stacked Pro breakdown:
Because sales weren’t recorded every year, we focus on the 2019 to 2024 period, when most of the projects had data.
For three-bedders, the results are more mixed compared to the one- and two-bedder segments. Some newer projects, like Sophia Hills and The Quayside, managed steady growth of around three to four per cent. Others, such as Suites at Orchard and Orchard Scotts, slipped into negative territory.
By contrast, both of the older projects, Townhouse Apartments and Leonie Gardens, showed positive growth during this period. While age still isn’t proving to be a big drawback, the advantage is less decisive than in smaller units: at least some newer projects still outperformed, even if others struggled.
While three and four-bedders are rarely bought for rental purposes, let’s see their rental yields just for completeness:
Project | Average price in 2024 | Average monthly rent (June 2024 – June 2025) | Rental yield |
LEONIE GARDENS | $3,116,667 | $7,821 | 3.01% |
SUITES AT ORCHARD | $2,840,000 | $7,413 | 3.13% |
THE ORCHARD RESIDENCES | $6,029,629 | $16,779 | 3.34% |
SOPHIA HILLS | $2,139,800 | $6,503 | 3.65% |
THE QUAYSIDE | $2,301,000 | $7,035 | 3.67% |
ORCHARD SCOTTS | $3,116,667 | $9,734 | 3.75% |
OUE TWIN PEAKS | $3,312,000 | $10,616 | 3.85% |
Results are fairly consistent across both old and new projects; but the Orchard Residences is definitely noteworthy for maintaining a rental yield above three per cent, despite a quantum that exceeds $6 million.
Unlike the one- and two-bedder segments, three-bedders show a more level playing field.
4-bedroom units
Average $PSF
Year | New | Old | Difference |
2014 | $3,090 | $1,080 | $2,010 |
2015 | $3,256 | $1,038 | $2,217 |
2016 | $2,730 | $980 | $1,750 |
2017 | $1,721 | $930 | $791 |
2018 | $3,144 | $781 | $2,364 |
2019 | $1,768 | $1,181 | $587 |
2020 | $2,176 | $1,086 | $1,090 |
2021 | $2,245 | $1,182 | $1,063 |
2022 | $2,913 | $1,104 | $1,809 |
2023 | $2,275 | $1,371 | $904 |
2024 | $2,218 | $1,416 | $801 |
Annualised | -3.26% | 2.75% |

For four-bedroom units, the results once again favour the older projects. Over the decade, older four-bedders achieved an annualised growth rate of about 2.75 per cent, while newer ones declined by around –3.26 per cent.
Newer projects still commanded higher $PSF throughout the decade, but the premium has narrowed considerably. In 2014, the gap between new and old was more than $2,000 psf; by 2024, it had fallen to just over $800 psf.
The shrinking gap suggests that older projects are catching up in relative terms. But the more important question is whether this holds up when we look at actual quantum prices:
Average price
Year | New | Old | Difference |
2014 | $7,996,383 | $2,551,250 | $5,445,133 |
2015 | $8,025,000 | $2,590,000 | $5,435,000 |
2016 | $6,972,500 | $2,455,240 | $4,517,260 |
2017 | $4,400,833 | $2,325,999 | $2,074,835 |
2018 | $7,750,000 | $1,804,444 | $5,945,556 |
2019 | $4,122,857 | $2,889,154 | $1,233,703 |
2020 | $5,182,500 | $2,784,538 | $2,397,962 |
2021 | $6,070,000 | $3,132,714 | $2,937,286 |
2022 | $7,355,000 | $2,631,600 | $4,723,400 |
2023 | $5,130,000 | $3,412,500 | $1,717,500 |
2024 | $5,657,500 | $3,463,199 | $2,194,301 |
% increase from 2014 to 2024 | -29.25% | 35.75% |

We can see the overall prices narrowing quite significantly, in favour of older projects. Back in 2014, newer four-bedders averaged almost $8.0 million, compared to around $2.55 million for older units – a gap of about $5.45 million. By 2024, that difference had shrunk to just $2.2 million, with older projects averaging $3.46 million against $5.66 million for newer ones. Of course, this is dependent on what newer projects are launched to bring up the price premium.
While new projects continue to transact at higher absolute prices, older four-bedders have appreciated better, rising about 35.8 per cent over the decade. In contrast, newer ones actually declined by close to 29.3 per cent.
Now let’s look at the sizes of older four-bedders compared to newer ones:
Average size (based on units transacted)
Year | New | Old |
2014 | 2533 | 2365.5 |
2015 | 2465 | 2497 |
2016 | 2516 | 2510 |
2017 | 2503 | 2517 |
2018 | 2465 | 2374 |
2019 | 2308 | 2441 |
2020 | 2331 | 2581 |
2021 | 2739 | 2676 |
2022 | 2472 | 2379 |
2023 | 2194 | 2522 |
2024 | 2478 | 2441 |

Once it comes to four-bedders, the size disparity fades – newer and older projects were mostly the same size.
These are the number of transactions we’ve had:
Year | New | Old |
2014 | 3 | 4 |
2015 | 2 | 10 |
2016 | 8 | 6 |
2017 | 6 | 18 |
2018 | 1 | 2 |
2019 | 7 | 13 |
2020 | 10 | 13 |
2021 | 4 | 7 |
2022 | 6 | 5 |
2023 | 5 | 4 |
2024 | 4 | 14 |
Now let’s look at the specific projects transacted:
New
Project | Average $PSF | Average price | Average size | No. of units sold | Completion year |
ORCHARD SCOTTS | $1,759 | $4,126,667 | 2354 | 3 | 2001 |
THE ORCHARD RESIDENCES | $3,593 | $10,250,000 | 2852 | 1 | 2006 |
Old
Project | Average $PSF | Average price | Average size | No. of units sold | Completion year |
HORIZON TOWERS | $1,375 | $3,331,325 | 2422 | 12 | 1979 |
LEONIE GARDENS | $1,665 | $4,254,444 | 2557 | 2 | 1990 |
There is one problem we detect here: The Orchard Residences had a transaction that came in at an eye-watering $10.25 million – a single transaction that pulled up the overall average for the newer group. By $PSF, The Orchard Residences also dominated at $3,593, far above Orchard Scotts at $1,759.
That said, among the older developments, Horizon Towers averaged about $3.33 million across 12 units, with sizes around 2,422 sq ft. Leonie Gardens, meanwhile, averaged $4.25 million at $1,665 psf – remarkably close to Orchard Scotts despite being a 1990 project.
When you set aside ultra-luxury projects like The Orchard Residences, many transactions in the segment cluster much closer together. For example, the pricing of Orchard Scotts is broadly comparable to that of Leonie Gardens, despite the latter being more than a decade older.
To understand if this reflects a consistent trend, let’s examine the performance of these projects over the last 10 years.
We’ll highlight the newer ones for easier differentiation.
Year | ORCHARD SCOTTS | THE ORCHARD RESIDENCES | HORIZON TOWERS | LEONIE GARDENS |
2014 | $1,621 | $3,825 | $1,080 | |
2015 | $3,256 | $1,054 | $1,279 | |
2016 | $1,453 | $3,156 | $1,000 | $1,137 |
2017 | $1,441 | $3,120 | $1,058 | $1,187 |
2018 | $3,144 | |||
2019 | $1,502 | $3,367 | $1,258 | $1,410 |
2020 | $1,419 | $3,408 | $1,328 | $1,540 |
2021 | $1,539 | $2,921 | $1,361 | $1,532 |
2022 | $1,797 | $3,270 | ||
2023 | $1,656 | $3,367 | $1,563 | $1,771 |
2024 | $1,759 | $3,593 | $1,375 | $1,665 |
Annualised | 0.82% | -0.62% | 2.44% |
The Orchard Residences actually slipped into negative territory at –0.6 per cent, but appreciation is bound to be tough when the initial price is already so high.
By contrast, the older Horizon Towers posted a healthier 2.4 per cent annualised growth rate, while Leonie Gardens also showed consistent gains. As is often the case in most places – and not just D9 – trophy condos with super-high prices seldom see good gains, and returns are not the main reason for buying them (they’re mostly a homebuyer’s indulgence.)
Although very few people would buy a four-bedder in D9 just to rent it out, we’ll look at the yields for completeness
Project | Average price in 2024 | Average monthly rent (June 2024 – June 2025) | Rental yield |
LEONIE GARDENS | $4,254,444 | $8,942 | 2.52% |
THE ORCHARD RESIDENCES | $10,250,000 | $22,934 | 2.68% |
HORIZON TOWERS | $3,331,325 | $7,984 | 2.88% |
ORCHARD SCOTTS | $4,126,667 | $12,356 | 3.59% |
The rental yields are bound to be lower, just on the basis of the much higher costs. But Orchard Scotts pulls off a rather impressive performance here, managing 3.59 per cent despite a high quantum of over $4.1 million.
As an aside, we want to end the four-bedder segment with a note that – in this category of housing – transactions don’t always make financial sense. Four-bedders in D9, whatever their age, tend to be luxury indulgences or status symbols; and some of the rental rates you see above may well be a C-suite executive’s housing allowance from an MNC. So we shouldn’t read too much into data alone, for this segment.
Conclusion
Over the past decade, the performance gap between new and old condos in District 9 has shown quite a bit of difference across unit types.
For three- and four-bedders, the price gap has narrowed significantly. Older units have appreciated strongly, while newer ones have generally slipped. The narrowing gaps in both $PSF and pricing suggest buyers are increasingly comfortable with older, larger layouts when it comes to family homes.
That said, more luxury projects like The Orchard Residences remain in a class of their own, where financial returns often take a back seat to lifestyle and prestige. For most buyers, though, older three- and four-bedders appear to be the stronger value play.
As always, data and known averages can tell us the general trend – but the real story lies in comparing individual developments. This is especially true in D9, where developers have more leeway to build unique luxury projects and more one-of-a-kind units.
Follow us on Stacked Pro as we look at more districts in Singapore and identify the price gaps between newer and older condos. If you’d like to get in touch for a more in-depth consultation, you can do so here.
Ryan J
A seasoned content strategist with over 17 years in the real estate and financial journalism sectors, Ryan has built a reputation for transforming complex industry jargon into accessible knowledge. With a track record of writing and editing for leading financial platforms and publications, Ryan's expertise has been recognised across various media outlets. His role as a former content editor for 99.co and a co-host for CNA 938's Open House programme underscores his commitment to providing valuable insights into the property market.Read next from Property Investment Insights

Property Investment Insights Are Older Three- and Four-Bedders in District 10 Holding Up Against the New Launches? We Break It Down

New Launch Condo Analysis Penrith Pricing Review: How It Compares To Nearby Resale And New Launches

Property Investment Insights Faber Residence Pricing Review: How It Compares To Nearby Resale And New Launches

New Launch Condo Analysis Skye At Holland Pricing Review: How It Compares To Nearby Resale And New Launches
Latest Posts

BTO Reviews October 2025 BTO Launch Review: Ultimate Guide To Choosing The Best Unit

On The Market 5 Rare HDB Flats Above 1,700 Sq ft You Can Buy Right Now In 2025

Editor's Pick A Holland Village New Launch Just Sold 98.8% Of Its Units In One Weekend — Here’s Why Everyone Rushed In

Landed Home Tours We Toured A Landed Street Near One Of Singapore’s Most Sought-After Schools — Where A Home Last Sold For $32 Million

Singapore Property News Why Old Run-Down Malls Make Neighbourhoods Better In Singapore

Editor's Pick Where Singaporeans Can Still Buy A City Apartment For $184,000 — And Earn 5% Rental Yield. But Should You?

On The Market The Cheapest 4-Bedroom Condos You Can Buy in Singapore Right Now From $1.39M

Editor's Pick Why These Newly Completed Condos Have Made Owners Up to $700K in Just 5 Years

Editor's Pick Penrith Condo Review: Full-Facility Condo For Just 462 Units Near The MRT

Editor's Pick This New 706-Unit Integrated Condo at River Valley Starts From $1.298M – And the Price Raises a Big Question for Buyers

Overseas Property Investing Why Renewed Interest In Johor Will Not Help All Investors In The Iskandar Region

On The Market 5 Cheapest 5-Room HDB Flats You Can Buy Right Now From $535k

Singapore Property News The Real Reason Homes Keep Getting Snapped Up in Singapore

Editor's Pick We Toured One Of Singapore’s Most Expensive Landed Estates — Is It Really Worth The Price?

Property Market Commentary The Best Condo Rental Yields Near International Schools In Singapore Isn’t Where You’d Expect

I know this info is not easy to get, but for these properties, it is not really fair to compare rental yields without taking maintenance & sinking fund fees into account because you could be talking $500/mth compared to $1500-2000/mth.
Hey Siew Wei Ngiam, you’re absolutely right — maintenance fees and sinking funds can make a meaningful difference to actual rental yields, and it’s not always fair to compare without factoring them in.
Property is nuanced in so many ways: things like renovations, layouts, facilities, and even how well a condo is maintained can all affect returns.
In this piece, we looked at the numbers in aggregate to spot broader systemic patterns that might be useful as a starting point. That said, we take feedback like yours seriously, and when we have the resources, we’ll definitely aim to dive deeper into individual developments to account for things like maintenance and sinking funds.
Thanks for raising this — it’s an important reminder of the complexity behind the numbers!