New Launch vs Resale Condos in District 9: Which Bedroom Types Offer Better Value Today?

Get The Property Insights Serious Buyers Read First: Join 50,000+ readers who rely on our weekly breakdowns of Singapore’s property market.

A seasoned content strategist with over 17 years in the real estate and financial journalism sectors, Ryan has built a reputation for transforming complex industry jargon into accessible knowledge. With a track record of writing and editing for leading financial platforms and publications, Ryan's expertise has been recognised across various media outlets. His role as a former content editor for 99.co and a co-host for CNA 938's Open House programme underscores his commitment to providing valuable insights into the property market.
When it comes to private property, District 9 (D9) has long been the benchmark of Singapore’s luxury market. This district encompasses some of the city’s most desirable neighbourhoods, from Orchard to River Valley, and with local buyers now reclaiming the CCR, properties here are bound to draw attention.
But in a district already packed with freehold luxury condos, buyers today face a tough question: should you go for the glossier new launches, or are the older resale options offering better value?
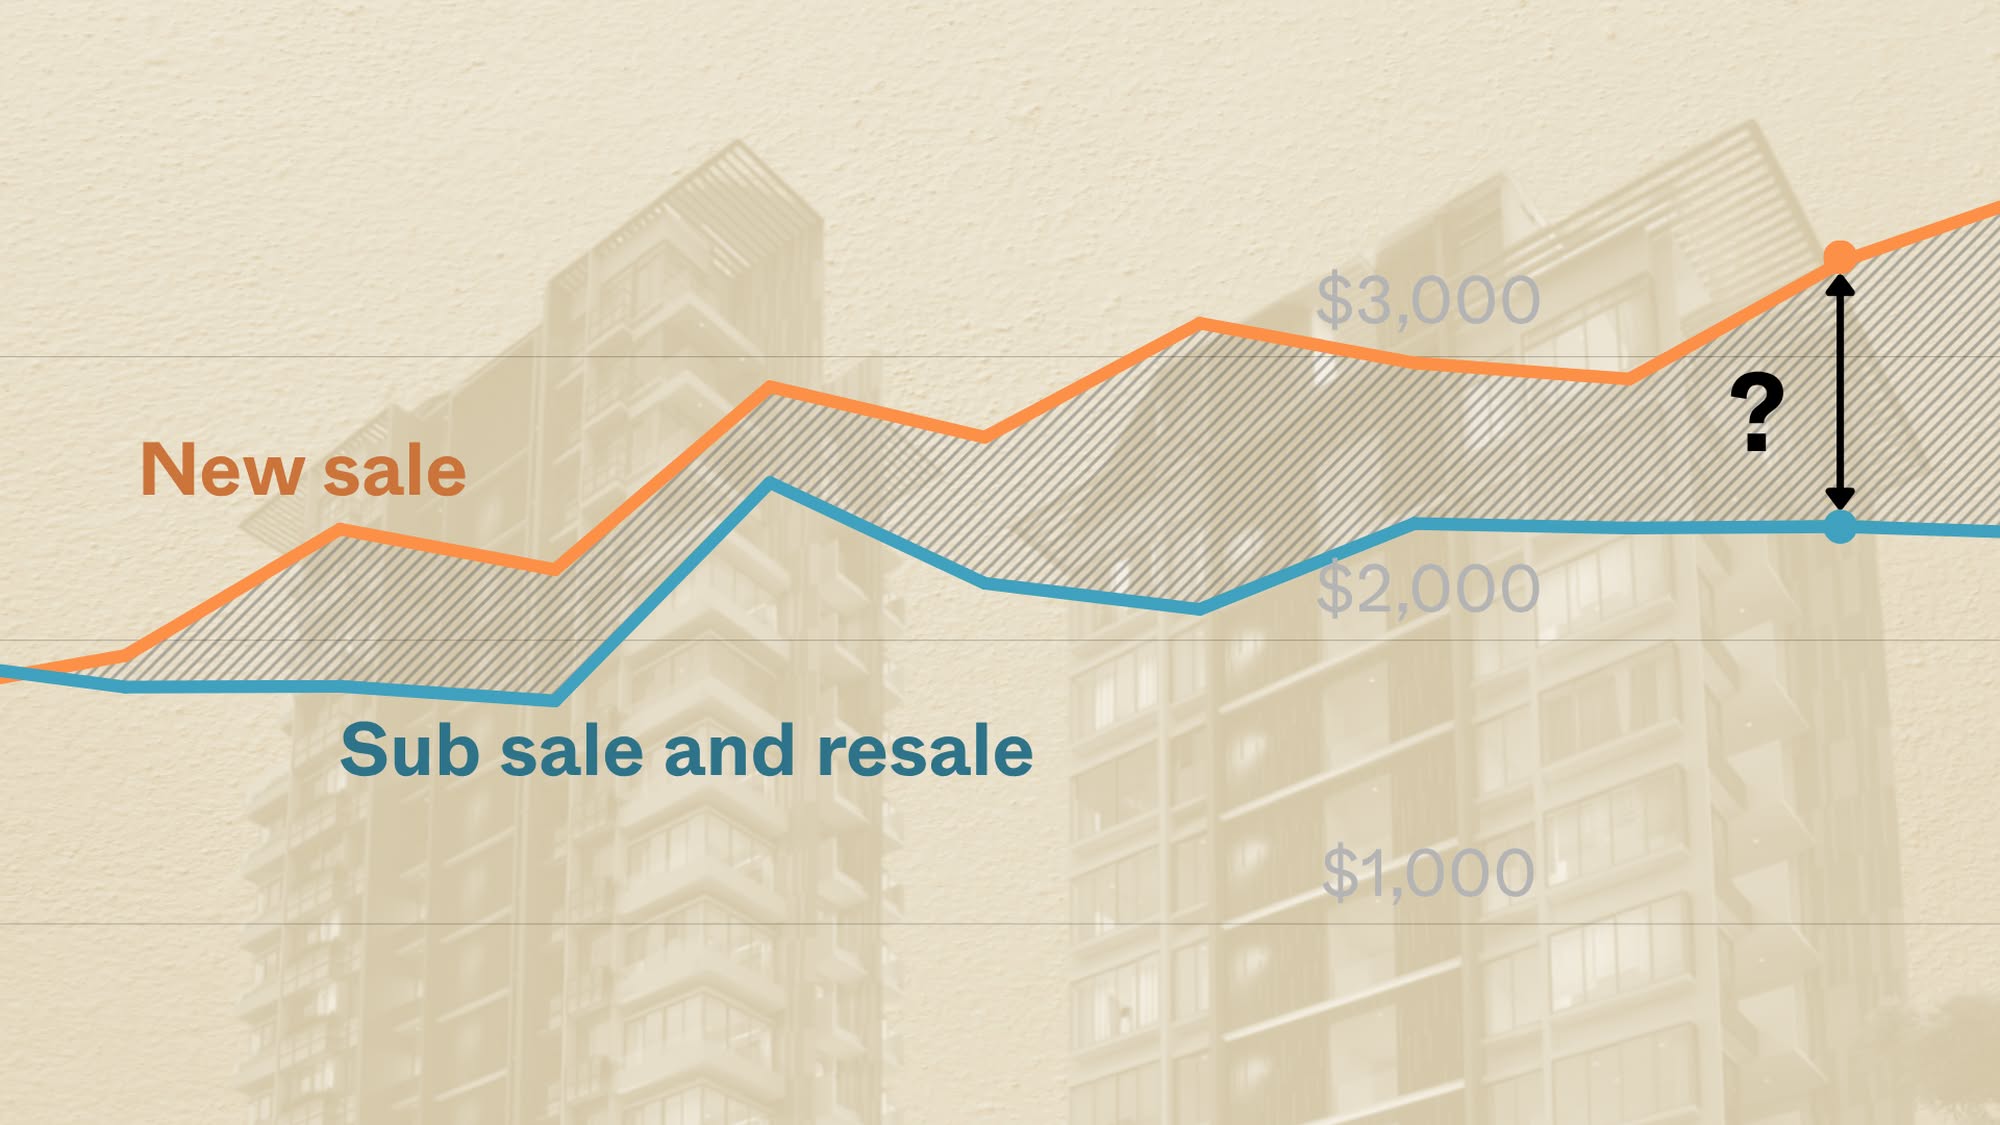
To find out, we dug into the data. After analysing District 9 transactions over the last 10 years, we break down the actual price gaps between new launch and resale condos—by unit size, from compact 1-bedders to spacious 3-bedders. The results may surprise you.
Let’s start by looking at the price movement for new launch and resale condos in D9, over the last 10 years
Year | New Sale | Sub sale and resale | % difference |
2014 | $2,344 | $1,975 | 18.68% |
2015 | $2,094 | $1,892 | 10.66% |
2016 | $2,305 | $2,107 | 9.41% |
2017 | $2,160 | $2,003 | 7.84% |
2018 | $2,898 | $2,299 | 26.06% |
2019 | $2,789 | $2,258 | 23.51% |
2020 | $2,581 | $2,095 | 23.15% |
2021 | $2,739 | $2,198 | 24.60% |
2022 | $2,837 | $2,208 | 28.51% |
2023 | $2,978 | $2,241 | 32.90% |
2024 | $3,018 | $2,277 | 32.57% |

Over the past decade, the price difference between new launch and resale condos here has widened. In 2014, the average new launch unit in D9 transacted at around $2,344 per sq ft, while resale and sub-sale units averaged $1,975 per sq ft, a difference of about 18.7 per cent.
This gap briefly narrowed in the mid-2010s, and it was narrowest in 2017. At the time, new launch prices dipped to $2,160 per sq ft, and resale prices hovered at $2,003 per sq ft. That translated to just a 7.8 per cent difference, the lowest in the past 10 years.
The reason for the narrowing in 2017 was that, after the property peak of 2013, a repeated series of cooling measures caused developers to turn cautious. Launch prices were more restrained, and developers tended toward steeper discounts.
In the aftermath of COVID though, through to 2023, the gap widened again. The average new launch price reached $2,978 per sq ft, while resale remained at $2,241 per sq ft, pushing the gap to nearly 33 per cent.
As of 2024, the difference has remained high, with new sale prices averaging $3,018 per sq ft compared to $2,277 per sq ft for resale: a 32.6 per cent gap.
Bear in mind that this is on a price per square foot basis, not quantum.
One reason for the widening gap is that newer launches in the CCR – which includes D9 – have abandoned the old practice of oversized condo units. Developers have pivoted toward smaller units with a higher $PSF but more affordable quantum. With the added effects of post-GFA harmonisation, this has widened the $PSF gap between new and resale units even further. But in terms of overall price, newer CCR projects are actually becoming more affordable because they’re smaller (see the link for details)
Now, let’s break down the price gap by bedroom type, starting with one-bedroom units
1-bedroom units
Year | New Sale | Sub sale and resale | % difference |
2014 | $2,386 | $2,133 | 11.83% |
2015 | $2,195 | $2,278 | -3.66% |
2016 | $2,400 | $2,507 | -4.28% |
2017 | $2,094 | $2,334 | -10.27% |
2018 | $2,853 | $2,266 | 25.89% |
2019 | $2,904 | $2,365 | 22.80% |
2020 | $2,494 | $2,143 | 16.40% |
2021 | $2,676 | $2,171 | 23.29% |
2022 | $2,816 | $2,176 | 29.40% |
2023 | $2,924 | $2,146 | 36.25% |
2024 | $2,915 | $2,151 | 35.53% |

Back in 2015 to 2017, resale one-bedroom units were actually more expensive than their new launch counterparts in $PSF. In 2017, for instance, new sale units averaged just $2,094 per sq ft, while resale one-bedders averaged $2,334 per sq ft; a negative gap of 10.3 per cent.
By 2018 though, new launch prices jumped to $2,853 per sq ft, while resale lagged behind at $2,266 per sq ft., and it has continued to grow since. As of 2024, new launch one-bedders average $2,915 per sq ft, compared to just $2,151 per sq ft for resale: a difference of 35.5 per cent.
As we mentioned above – and will continue to see below – this is due to developers shrinking units to make the quantum affordable. The end result is a lower overall price for new launches, but a much higher $PSF.
Two-bedroom units
Year | New Sale | Sub sale and resale | % difference |
2014 | $2,303 | $1,954 | 17.86% |
2015 | $2,072 | $1,844 | 12.34% |
2016 | $2,232 | $2,053 | 8.75% |
2017 | $2,187 | $2,014 | 8.59% |
2018 | $2,974 | $2,253 | 32.04% |
2019 | $2,797 | $2,309 | 21.16% |
2020 | $2,545 | $2,146 | 18.63% |
2021 | $2,698 | $2,083 | 29.52% |
2022 | $2,839 | $2,101 | 35.11% |
2023 | $2,869 | $2,209 | 29.91% |
2024 | $3,065 | $2,307 | 32.82% |

Back in 2014, the price gap stood at about 17.9 per cent, with new launches averaging $2,303 per sq ft and resale/sub-sale units at $1,954 per sq ft. This narrowed in the years that followed, reaching a low of just 8.6 per cent in 2017.
As with the one-bedders, the momentum shifted dramatically after 2018, and the property market came out of its down period. New sale prices for two-bedders surged past $2,900 per sq ft, while resale remained closer to the mid-$2,200 range.
From that point on, the gap widened and has largely stayed above 30 per cent in recent years; peaking at 35.1 per cent in 2022, and remaining high at 32.8 per cent in 2024.
Three-bedroom units
Year | New Sale | Sub sale and resale | % difference |
2014 | $2,429 | $1,933 | 25.64% |
2015 | $2,043 | $1,787 | 14.35% |
2016 | $2,078 | $1,925 | 7.95% |
2017 | $2,126 | $1,891 | 12.42% |
2018 | $2,693 | $2,263 | 19.00% |
2019 | $2,668 | $2,174 | 22.73% |
2020 | $2,441 | $2,043 | 19.47% |
2021 | $2,783 | $2,192 | 26.99% |
2022 | $2,840 | $2,218 | 28.06% |
2023 | $3,008 | $2,222 | 35.39% |
2024 | $3,379 | $2,275 | 48.50% |

The pattern here is not too different from two-bedders. In the mid-2010s, the price gap between new and resale three-bedders was relatively modest; and as we keep seeing, the gap narrowed toward 2016/2017, toward the tail end of a property downturn.
The narrowest point was in 2016, when new sale prices averaged $2,078 per sq ft, while resale prices were at $1,925 per sq ft: a slim gap of just eight per cent.
But by 2021, that difference had more than doubled. New three-bedroom units were transacting at $2,783 per sq ft, compared to $2,192 per sq ft for resale. And by 2024, the gap had blown wide open. New launches hit an average of $3,379 per sq ft, while resale three-bedders averaged just $2,275 per sq ft; a staggering 48.5 per cent difference.
Four-bedroom units
Year | New Sale | Sub sale and resale | % difference |
2014 | $1,812 | $1,935 | -6.37% |
2015 | $1,946 | $1,835 | 6.04% |
2016 | $2,392 | $1,838 | 30.17% |
2017 | $2,249 | $1,786 | 25.90% |
2018 | $2,894 | $2,556 | 13.19% |
2019 | $2,716 | $2,201 | 23.38% |
2020 | $3,118 | $2,109 | 47.84% |
2021 | $2,978 | $2,412 | 23.45% |
2022 | $2,921 | $2,396 | 21.90% |
2023 | $3,339 | $2,401 | 39.07% |
2024 | $3,599 | $2,376 | 51.49% |

In 2014, resale four-bedroom units in D9 were more expensive than their new launch counterparts, on a $PSF basis. That year, resale units averaged $1,935 per sq ft, compared to just $1,812 per sq ft for new sales; a negative gap of 6.4 per cent.
The gap managed to widen during the COVID year 2020, and then surged ahead in the aftermath. In 2020, new sale four-bedders reached $3,118 per sq ft, while resale remained at $2,109 per sq ft – a stunning 47.8 per cent difference.
By 2024, that gap has grown even further, with new sale four-bedroom units averaging $3,599 per sq ft compared to $2,376 per sq ft for resale; a difference of 51.5 per cent, the highest across all unit types.
Five-bedroom units
Year | New Sale | Sub sale and resale | % difference |
2014 | $3,927 | ||
2015 | $1,593 | ||
2016 | $2,134 | ||
2017 | $1,939 | ||
2018 | $2,896 | ||
2019 | $2,196 | ||
2020 | $2,428 | $2,291 | 5.96% |
2021 | $2,349 | $2,570 | -8.57% |
2022 | $2,358 | $3,258 | -27.63% |
2023 | $2,944 | $2,438 | 20.77% |
2024 | $2,607 |

We have to take this with the proverbial grain of salt, because there aren’t many transactions for five-bedders in D9; it’s outside the purchasing power of most buyers. Many years saw no new sale transactions at all, and in some cases, the average resale $PSF far exceeded that of new launches.
Where new sale data begins to appear, from 2020 onward, the numbers remain volatile. In 2020, new five-bedroom units averaged $2,428 per sq ft, while resale came in at $2,291 per sq ft, for a modest gap of just six per cent.
In 2021 and 2022, resale prices jumped ahead – particularly in 2022 – where resale five-bedders averaged $3,258 per sq ft, outpacing new sale prices by over 27 per cent.
Nonetheless, we wouldn’t read too much into this; for five-bedders, the transactions are sometimes due to unusual units like penthouses or superlux, oversized units, in one-off transactions.
Throughout this comparison, we’ve repeatedly pointed out that the quantum (overall price) is a different issue in D9, as developers are trying to keep the units affordable.
This means new launches offering a higher $PSF but a lower quantum. So in that context, let’s explore the price gaps using the actual overall price:
One-bedroom units by quantum
Year | New Sale | Sub sale and resale | Price difference | % difference |
2014 | $1,158,618 | $1,314,151 | -$155,533 | -11.84% |
2015 | $1,565,901 | $1,341,186 | $224,714 | 16.75% |
2016 | $1,634,550 | $1,435,945 | $198,604 | 13.83% |
2017 | $1,176,947 | $1,414,702 | -$237,756 | -16.81% |
2018 | $1,482,049 | $1,393,855 | $88,194 | 6.33% |
2019 | $1,364,698 | $1,345,658 | $19,039 | 1.41% |
2020 | $1,300,329 | $1,327,174 | -$26,845 | -2.02% |
2021 | $1,272,181 | $1,343,290 | -$71,109 | -5.29% |
2022 | $1,428,199 | $1,342,664 | $85,535 | 6.37% |
2023 | $1,699,155 | $1,247,807 | $451,348 | 36.17% |
2024 | $1,329,390 | $1,331,015 | -$1,624 | -0.12% |

In several years, resale one-bedders were actually more expensive in quantum than their new launch counterparts. The clearest example is 2017, when new sale one-bedders averaged $1.18 million, while resale one-bedders averaged $1.41 million – a difference of over $237,000 in favour of the resale market.
Even in recent years, there is no consistent trend. In 2023, new one-bedroom units hit a peak of $1.7 million on average, a full 36.2 per cent above resale, which remained at around $1.25 million.
But that gap immediately vanished in 2024, when the average quantum for new and resale one-bedders converged at approximately $1.33 million – virtually no difference at all.
There may also be some distortion due to the size of one-bedders in older projects (20+ years old). The one-bedders in UE Square (completed 1997), for instance, can reach up to 800 sq ft. By contrast, new launch one-bedders today tend to be in the 420 to 500 sq ft range.
More from Stacked
Analysing Forest Woods Condo at Serangoon: Did This 2016 Project Hold Up Over Time?
In this Stacked Pro breakdown:
Two-bedroom units
Year | New Sale | Sub sale and resale | Price difference | % difference |
2014 | $1,775,473 | $2,052,518 | -$277,044 | -13.50% |
2015 | $1,463,245 | $1,940,405 | -$477,160 | -24.59% |
2016 | $1,820,718 | $2,197,521 | -$376,803 | -17.15% |
2017 | $1,730,393 | $2,036,939 | -$306,546 | -15.05% |
2018 | $2,366,995 | $2,430,504 | -$63,510 | -2.61% |
2019 | $1,877,554 | $2,229,138 | -$351,584 | -15.77% |
2020 | $1,743,831 | $2,124,734 | -$380,903 | -17.93% |
2021 | $1,768,746 | $2,066,254 | -$297,508 | -14.40% |
2022 | $1,924,101 | $2,083,057 | -$158,956 | -7.63% |
2023 | $2,226,894 | $2,205,181 | $21,714 | 0.98% |
2024 | $2,372,190 | $2,153,078 | $219,112 | 10.18% |

In 2015, resale two-bedders averaged $1.94 million, while new sale units came in at just $1.46 million; a 24.6 per cent difference. Similar gaps persisted through to 2020, with resale units routinely priced $300,000 to $400,000 higher than their new launch counterparts. This is, again, likely due to some of the older condos being built a lot larger than today’s standards.
But that dynamic began to shift in 2023. That year, the average price for new two-bedroom units finally overtook resale, albeit by a narrow margin of 0.98 per cent. And by 2024, the difference widened, with new sale two-bedders averaging $2.37 million, compared to $2.15 million for resale; a 10.2 per cent premium.
So 2023 marked a quiet inflection point for two-bedroom units. After years of trailing behind resale prices, new launch quantum finally crept ahead.
It’s a sign that just maybe, buyers of new two-bedders ought to check out surrounding resale prices. The resale counterparts may be similar or lower in terms of quantum, but also bigger.
(While it’s unspecific to D9, we have also pondered the question of why buyers don’t choose a resale two-bedder over a new launch today, in this article.)
Three-bedroom units
Year | New Sale | Sub sale and resale | Price difference | % difference |
2014 | $3,170,933 | $2,988,668 | $182,265 | 6.10% |
2015 | $2,303,800 | $2,734,616 | -$430,816 | -15.75% |
2016 | $2,231,898 | $3,090,866 | -$858,967 | -27.79% |
2017 | $2,324,189 | $3,002,881 | -$678,692 | -22.60% |
2018 | $3,566,469 | $3,735,457 | -$168,989 | -4.52% |
2019 | $2,847,580 | $3,577,222 | -$729,642 | -20.40% |
2020 | $2,764,578 | $3,235,023 | -$470,445 | -14.54% |
2021 | $3,289,636 | $3,414,758 | -$125,122 | -3.66% |
2022 | $3,272,621 | $3,437,369 | -$164,748 | -4.79% |
2023 | $3,848,119 | $3,367,359 | $480,761 | 14.28% |
2024 | $4,677,024 | $3,250,633 | $1,426,391 | 43.88% |

The movements here are quite similar to those we saw for two-bedders. In 2014, new sale three-bedroom units were slightly more expensive than resale, averaging around $3.17 million compared to $2.99 million; a modest 6.1 per cent gap.
Then from 2015 through to 2022, resale consistently outpriced new launches in terms of overall price. This was most pronounced in 2016, when resale three-bedders averaged a massive $858,000 more than their new launch counterparts; a 27.8 per cent price difference.
But as with two-bedders, the situation changed in 2024. In fact, we saw a sharp reversal, where the average price for a new launch surged to $4.68 million, while resale units dropped to $3.25 million. That’s a 43.9 per cent premium for new launches; the steepest jump of any year in the past decade.
Due to the big gap between new and resale prices here, we’ll take a deeper look at this below.
Four-bedroom units
Year | New Sale | Sub sale and resale | Price difference | % difference |
2014 | $5,693,820 | $4,702,449 | $991,371 | 21.08% |
2015 | $2,995,000 | $4,333,604 | -$1,338,604 | -30.89% |
2016 | $4,713,713 | $4,474,259 | $239,454 | 5.35% |
2017 | $3,773,171 | $4,345,935 | -$572,764 | -13.18% |
2018 | $6,191,797 | $6,299,886 | -$108,090 | -1.72% |
2019 | $4,757,964 | $6,336,190 | -$1,578,226 | -24.91% |
2020 | $6,683,211 | $5,236,521 | $1,446,690 | 27.63% |
2021 | $5,829,748 | $6,283,039 | -$453,291 | -7.21% |
2022 | $5,486,414 | $6,045,821 | -$559,407 | -9.25% |
2023 | $6,564,022 | $6,029,647 | $534,375 | 8.86% |
2024 | $7,400,000 | $5,654,149 | $1,745,851 | 30.88% |

In 2014, new launch four-bedders commanded a premium of 21.1 per cent over resale, with average prices nearing $5.7 million. Just one year later, still within the property down market, that premium collapsed: resale four-bedroom averaged $4.33 million, while new launches plunged to just $3 million.
This was, again, due to developers being more cautious during the end of the 2013 peak, right up to 2017.
In 2020, however, new launches surged to over $6.68 million, leapfrogging resale by 27.6 per cent. Post-COVID in 2023 and 2024, new launches became far more expensive. A new launch four-bedder here averaged $7.4 million in 2024, while resale counterparts fell to $5.65 million, a difference of 30.9 per cent. As with the psf numbers, we wouldn’t look too much into this, as the variance is likely dependent on the launches during the year, given the low transaction volumes at this end of the market.
In both cases though – new launch and resale – the overall quantum is way beyond the average HDB upgrader.
Five-bedroom units
Year | New Sale | Sub sale and resale | Price difference | % difference |
2014 | $11,285,640 | -$11,285,640 | ||
2015 | $4,350,000 | -$4,350,000 | ||
2016 | $10,390,000 | -$10,390,000 | ||
2017 | $6,227,571 | -$6,227,571 | ||
2018 | $15,510,000 | -$15,510,000 | ||
2019 | $9,325,220 | -$9,325,220 | ||
2020 | $4,417,000 | $8,934,167 | -$4,517,167 | -50.56% |
2021 | $4,273,744 | $8,896,646 | -$4,622,902 | -51.96% |
2022 | $4,289,585 | $9,004,500 | -$4,714,915 | -52.36% |
2023 | $10,117,665 | $9,050,000 | $1,067,665 | 11.80% |
2024 | $7,931,500 | -$7,931,500 |

As before, it’s hard to read much into this segment, because transaction volumes are so low. Even once new sale transactions begin appearing from 2020 onwards, the sample sizes remain small and the pricing seems erratic.
In 2020, resale five-bedders averaged nearly $8.93 million, while new launch counterparts came in at just $4.42 million – a difference of over 50 per cent. This gap flipped only in 2023, when new five-bedders suddenly jumped to an average of $10.12 million, overtaking resale at $9.05 million.
As many of these units are unique luxury builds, however, it’s difficult to generalise anything about them.
Based on the transactions done in 2024, the three-bedroom units have the largest price gap in terms of overall quantum; so let’s take a closer look at them.
For a bit more precision, we’ll also break them down into leasehold and freehold projects; although do note that D9 is predominantly a freehold area.
99-year leasehold
Year | New Sale | Sub sale and resale | Price difference | % difference |
2014 | $3,167,000 | $5,000,000 | -$1,833,000 | -36.66% |
2015 | $2,168,200 | $2,902,255 | -$734,055 | -25.29% |
2016 | $1,822,568 | $3,522,990 | -$1,700,422 | -48.27% |
2017 | $2,360,595 | $3,585,996 | -$1,225,401 | -34.17% |
2018 | $3,098,230 | $2,602,440 | $495,790 | 19.05% |
2019 | $3,371,872 | $2,919,449 | $452,423 | 15.50% |
2020 | $2,389,396 | $3,734,000 | -$1,344,604 | -36.01% |
2021 | $2,665,739 | $2,679,134 | -$13,395 | -0.50% |
2022 | $2,811,096 | $2,854,437 | -$43,341 | -1.52% |
2023 | $2,811,818 | $2,828,536 | -$16,718 | -0.59% |
2024 | $3,018,549 | -$3,018,549 |
999-year/freehold
Year | New Sale | Sub sale and resale | Price difference | % difference |
2014 | $3,171,280 | $2,920,487 | $250,793 | 8.59% |
2015 | $2,439,400 | $2,721,156 | -$281,756 | -10.35% |
2016 | $2,927,761 | $2,876,082 | $51,678 | 1.80% |
2017 | $1,863,051 | $2,862,272 | -$999,221 | -34.91% |
2018 | $5,023,210 | $3,802,632 | $1,220,577 | 32.10% |
2019 | $2,454,362 | $3,656,299 | -$1,201,937 | -32.87% |
2020 | $4,121,004 | $3,194,998 | $926,006 | 28.98% |
2021 | $3,951,344 | $3,487,319 | $464,025 | 13.31% |
2022 | $3,593,937 | $3,536,117 | $57,819 | 1.64% |
2023 | $4,052,239 | $3,446,916 | $605,323 | 17.56% |
2024 | $4,677,024 | $3,326,130 | $1,350,894 | 40.61% |
Based on the above, we can see the gap between new and resale three-bedders is largely driven by freehold/999-year projects. In 2024, zero new sale transactions were recorded for 99-year three-bedders.
This leaves the bulk of new launch activity concentrated in freehold projects, which typically carry a premium.
Comparing across tenure, we see that for freehold/999-year units, new launches averaged $4.68 million, while resale units came in at $3.33 million. That’s a gap of 40.6 per cent.
But for 99-year leasehold units, the most recent complete data is from 2023, where both new and resale prices hovered around $2.81 to $2.83 million; there is essentially no gap.
Let’s take a closer look at the transactions, based on the transaction types:
999-year/freehold New Sale
Project | Average price | Average $PSF | Average size (sqft) for units transacted | Transaction volume |
KLIMT CAIRNHILL | $4,991,664 | $3,457 | 1444 | 22 |
THE IVERIA | $2,570,000 | $2,713 | 947 | 1 |
ORCHARD SOPHIA | $2,269,500 | $2,850 | 797 | 2 |
KLIMT Cairnhill is pulling up the average for the new launches in 2024. Not only does it have the highest average $PSF among the projects at $3,457, but it also features significantly larger unit sizes, averaging 1,444 sq ft.
If we were to exclude KLIMT Cairnhill from the dataset, the average transacted price for the remaining new launch three-bedroom units would drop to $2,419,750. That figure is actually lower than the average sub sale and resale price for freehold three-bedroom units in 2024.
That said, it is important to note that The Iveria and Orchard Sophia recorded only three transactions in total, so they may not be a good representation of wider new launch trends. Both also have more compact unit sizes, which naturally come with a lower overall quantum.
In short though, the data shows that the price gap in 2024 is due to a single, premium development (KLIMT Cairnhill) with outsized influence on the average.
Now, let’s look at sub sale and resale units
Project | Average price | Average $PSF | Average size (sqft) for units transacted | Transaction volume |
THE CLAYMORE | $7,900,000 | $2,948 | 2680 | 1 |
HILLTOPS | $5,869,167 | $3,470 | 1686 | 6 |
CENTENNIA SUITES | $5,085,000 | $2,846 | 1787 | 1 |
CAIRNHILL PLAZA | $5,016,667 | $1,779 | 2820 | 3 |
PATERSON SUITES | $4,900,000 | $2,918 | 1679 | 1 |
MARTIN PLACE RESIDENCES | $4,780,000 | $2,775 | 1722 | 1 |
RICHMOND PARK | $4,750,000 | $3,064 | 1550 | 1 |
THE TRILLIUM | $4,746,296 | $2,641 | 1798 | 3 |
THE PROMONT | $4,500,000 | $2,166 | 2077 | 1 |
HELIOS RESIDENCES | $4,425,000 | $2,310 | 1916 | 2 |
ST THOMAS SUITES | $4,350,000 | $2,391 | 1819 | 1 |
RIVERGATE | $4,275,000 | $2,768 | 1545 | 4 |
BELLE VUE RESIDENCES | $4,200,000 | $2,121 | 1981 | 1 |
MARTIN NO 38 | $4,200,000 | $2,827 | 1485 | 1 |
YONG AN PARK | $4,200,000 | $2,379 | 1765 | 1 |
URBAN SUITES | $4,180,000 | $2,697 | 1550 | 1 |
RESIDENCES @ KILLINEY | $4,048,888 | $2,612 | 1550 | 1 |
SCOTTS SQUARE | $4,006,667 | $3,237 | 1238 | 3 |
THE LIGHT @ CAIRNHILL | $3,995,000 | $2,483 | 1610 | 2 |
TRIBECA | $3,925,000 | $2,505 | 1569 | 4 |
CAIRNHILL CREST | $3,911,500 | $2,257 | 1733 | 4 |
SCOTTS 28 | $3,780,000 | $2,280 | 1658 | 1 |
THE COSMOPOLITAN | $3,730,000 | $2,817 | 1324 | 1 |
GRANGE HEIGHTS | $3,705,000 | $1,945 | 1905 | 2 |
THE IMPERIAL | $3,642,500 | $2,447 | 1494 | 4 |
THE LAURELS | $3,600,000 | $2,764 | 1302 | 1 |
PATERSON RESIDENCE | $3,525,000 | $2,684 | 1313 | 2 |
RIVERIA GARDENS | $3,524,000 | $2,462 | 1432 | 2 |
THE BOTANIC ON LLOYD | $3,500,000 | $2,339 | 1496 | 1 |
THE PATERSON | $3,490,000 | $2,457 | 1421 | 2 |
THE AVENIR | $3,488,000 | $3,057 | 1141 | 1 |
WATERMARK ROBERTSON QUAY | $3,480,000 | $2,199 | 1582 | 1 |
NOMU | $3,455,000 | $2,488 | 1389 | 1 |
RIVERSHIRE | $3,438,000 | $2,034 | 1690 | 1 |
THE SUITES AT CENTRAL | $3,407,500 | $2,457 | 1386 | 4 |
THE VERMONT ON CAIRNHILL | $3,400,000 | $2,411 | 1410 | 1 |
LEONIE HILL RESIDENCES | $3,380,000 | $2,434 | 1389 | 1 |
8 RODYK | $3,370,000 | $2,367 | 1427 | 2 |
MIRAGE TOWER | $3,365,000 | $2,249 | 1496 | 2 |
8 SAINT THOMAS | $3,362,500 | $2,738 | 1227 | 2 |
WATERFORD RESIDENCE | $3,350,000 | $1,842 | 1819 | 1 |
TIARA | $3,320,500 | $2,314 | 1440 | 4 |
CASA CAIRNHILL | $3,300,000 | $2,100 | 1572 | 1 |
ONE DEVONSHIRE | $3,260,000 | $2,728 | 1195 | 1 |
UE SQUARE | $3,159,000 | $2,116 | 1493 | 4 |
THE WHARF RESIDENCE | $3,150,000 | $2,360 | 1335 | 1 |
LUCKY PLAZA | $3,100,000 | $1,941 | 1599 | 2 |
CAIRNHILL RESIDENCES | $3,058,178 | $2,616 | 1169 | 5 |
CASA NOVACREST | $2,975,000 | $1,887 | 1577 | 2 |
ASPEN HEIGHTS | $2,908,571 | $2,190 | 1329 | 7 |
KIM SIA COURT | $2,899,500 | $2,041 | 1421 | 4 |
VISIONCREST | $2,853,333 | $2,346 | 1216 | 3 |
WATERSCAPE AT CAVENAGH | $2,847,500 | $2,112 | 1348 | 4 |
ROBERTSON 100 | $2,710,000 | $2,132 | 1297 | 2 |
THE REGALIA | $2,701,667 | $2,221 | 1216 | 3 |
SOPHIA RESIDENCE | $2,635,714 | $1,979 | 1345 | 7 |
THE IVERIA | $2,630,000 | $2,777 | 947 | 1 |
CLAREMONT | $2,583,333 | $2,050 | 1260 | 3 |
WILKIE STUDIO | $2,548,444 | $1,757 | 1491 | 2 |
PARC EMILY | $2,525,000 | $2,076 | 1217 | 2 |
RESIDENCES AT 338A | $2,522,500 | $2,077 | 1216 | 2 |
LANGSTON VILLE | $2,520,000 | $1,847 | 1399 | 2 |
EURO-ASIA COURT | $2,490,000 | $1,974 | 1260 | 2 |
THE ABODE AT DEVONSHIRE | $2,350,000 | $2,099 | 1119 | 1 |
LA CRYSTAL | $2,253,333 | $2,122 | 1062 | 3 |
PARC CENTENNIAL | $2,200,000 | $1,762 | 1249 | 1 |
ONE OXLEY RISE | $2,187,500 | $2,092 | 1047 | 4 |
NEWTON EDGE | $2,150,000 | $2,018 | 1066 | 1 |
PARC MACKENZIE | $2,130,000 | $1,596 | 1335 | 1 |
CAVENAGH GARDENS | $2,116,615 | $1,524 | 1384 | 13 |
THE RISE @ OXLEY – RESIDENCES | $1,675,000 | $2,252 | 743 | 2 |

Comparing average sizes, new launches in 2024 (excluding KLIMT Cairnhill) are significantly smaller, averaging under 950 sq ft, while resale three-bedroom units come in at around 1,482 sq ft.
If we use the average new launch price of $2,419,750 as a benchmark, only eight resale or sub sale projects fall below this threshold; some of these are The Abode at Devonshire, Cavenagh Gardens, and Parc Mackenzie.
Most of these are boutique developments with fewer than 100 units though, similar to Orchard Sophia and The Iveria. For buyers hoping to secure a larger unit in a newer or more substantial development, the budget will need to stretch well beyond the $2.4 million mark. And while lease decay is not a concern for 999-year or freehold properties, another trade-off lies in more dated designs, older layouts, and limited facilities.
Let’s also compare the new 999-year/freehold projects against the sub sale and resale transactions for the period
New Sale in 2024 (999-year/freehold) | Sub sale and resale in 2024 (99-year leasehold) | Price difference | % difference |
$4,677,024 | $3,018,549 | $1,658,475 | 54.94% |
$2,419,750 (excluding Klimt Cairnhill) | $3,018,549 | -$598,799 | -19.84% |
With KLIMT Cairnhill included, the average price for new freehold three-bedders is $4.68 million, or nearly 55 per cent higher than the resale average.
However, if we exclude KLIMT Cairnhill, the picture reverses: new launch prices drop to $2.42 million, making them nearly 20 per cent cheaper than the resale average. This reinforces the point that KLIMT Cairnhill is a one-off distortion.
Finally, let’s take a look at the sub sale and resale transactions done for the 99-year leasehold condos:
Project | Average price | Average $PSF | Average size (sqft) for units transacted | Transaction volume |
THE ORCHARD RESIDENCES | $6,029,629 | $2,943 | 2052 | 3 |
OUE TWIN PEAKS | $3,312,000 | $2,328 | 1422 | 9 |
MARTIN MODERN | $3,181,535 | $2,749 | 1164 | 11 |
LEONIE GARDENS | $3,116,667 | $1,798 | 1733 | 3 |
ORCHARD SCOTTS | $3,116,667 | $1,799 | 1773 | 3 |
SUITES AT ORCHARD | $2,840,000 | $1,807 | 1572 | 1 |
KOPAR AT NEWTON | $2,635,286 | $2,633 | 1000 | 7 |
8 @ MOUNT SOPHIA | $2,508,611 | $1,613 | 1589 | 8 |
TOWNHOUSE APARTMENTS | $2,450,000 | $1,035 | 2368 | 1 |
THE QUAYSIDE | $2,301,000 | $1,698 | 1357 | 3 |
SOPHIA HILLS | $2,139,800 | $2,171 | 986 | 5 |
Based on the average new launch price (excluding KLIMT Cairnhill) of $2.42 million, buyers would find only two comparable 99-year leasehold resale options in 2024: The Quayside and Sophia Hills.
This shows that, while the overall price gap between new launch and resale three-bedroom units in D9 appears wide at nearly 44 per cent, it is largely driven by a few high-priced projects that pull up the average quantum.
In fact, The Iveria and Orchard Sophia, the only other freehold new launches transacted in this segment in 2024, were sold at prices that fall on the lower end of the D9 spectrum, even when compared to resale 99-year leasehold condos.
Averages can mislead, but patterns still matter.
The headline figures suggest that new launches are commanding 40 to 50 per cent premiums in both $PSF and quantum; but that gap isn’t consistent across all projects or bedroom types. It’s shaped by individual developments, unit sizes, tenure, and how developers are positioning their products. One luxury project like KLIMT Cairnhill can tilt the entire segment.
When we strip away the distortions, we see that some new freehold launches are actually cheaper than resale alternatives. But on the flip side, resale units still offer far more space – sometimes 500 sq ft more – for the same or slightly higher price, albeit often in older developments with dated layouts or finishes.
Overall, there’s no denying that new launches like River Green are very well priced compared to older resale counterparts (in quantum if not $PSF). But it’s also worth remembering that, while that’s great for the initial buyer, it may not translate to success in the resale market.
Simply put, not everyone considers a 600 to 700 sq ft unit sufficient for a family; and you might struggle to find buyers in the resale market eventually, even if you got it at a great low price from the developer. This could affect the price, as the drawbacks of a compact unit become real once buyers can actually see the unit.
One example of this would be The M, which sold at a median price of $2,439 psf (developer sales) in February 2020. Today in 2025, median prices are at $2,593 psf, a weak return of around 1.85 per cent; this despite The M famously having units at $1 million or less at launch (one-bedders).
This means that, despite the price gap, there is a place and existing demand for the larger resale units as well. The projects that do well in the CCR, going forward, will be the ones with a more holistic mix: a balance of larger and smaller units. Beware of the ones that are almost all small, low quantum units, or the ones with too many oversized units that few buyers can afford.
The challenge with buying in District 9 today isn’t just about affording the entry price – it’s navigating a market where bigger resale units may offer more space, while new launches boast more attractive psf and finishings.
Many buyers struggle with evaluating these trade-offs, especially when every project positions itself as “well-priced.” We hope this breakdown gives you a clearer framework to assess new versus resale: not just by price, but by unit type, potential returns, and liveability.
At Stacked, we’ve helped hundreds of buyers weigh these exact decisions, balancing long-term value with personal needs.
For advice on specific condos for your intent (e.g., projects for rental, or projects specific to your exit strategy), reach out to us at Stacked for tailored help. You can also check out our in-depth review of projects and their performance on Stacked Pro.
Ryan J
A seasoned content strategist with over 17 years in the real estate and financial journalism sectors, Ryan has built a reputation for transforming complex industry jargon into accessible knowledge. With a track record of writing and editing for leading financial platforms and publications, Ryan's expertise has been recognised across various media outlets. His role as a former content editor for 99.co and a co-host for CNA 938's Open House programme underscores his commitment to providing valuable insights into the property market.Read next from Property Investment Insights

New Launch Condo Analysis Canberra Crescent Residences Pricing Breakdown: A Price Comparison With Nearby Condos

New Launch Condo Analysis A New River Valley Condo From Just $1.2M? Here’s What You Need To Know About River Green’s Pricing

Property Investment Insights Why The Interlace Condo Underperformed—Despite Its Massive Land Size And Large Units

New Launch Condo Analysis Promenade Peak Pricing Breakdown: How It Compares to Nearby Resale and New Launch Condos
Latest Posts

Singapore Property News Over 900 Units Sold in One Weekend: The Surprising Lessons From River Green, Promenade Peak & Canberra Crescent

Singapore Property News Is Property Decoupling To Avoid ABSD Now Illegal?

Landed Home Tours I Visited Freehold Terraces, Semi-Ds, and Detached Homes in the East Ranging from $2.5 Million to $11 Million

Singapore Property News How Condo Buying In Singapore Became A Game Of Luck

New Launch Condo Analysis Springleaf Residence Launches From $878K — Is This 941-Unit Mega Development Worth It?

On The Market 5 Spacious 3-Bedroom Condos That Cost Less Than You’d Expect (Under $2M)

Singapore Property News Is Your HDB or Condo at Risk of a Sinkhole? 5 Signs to Watch Out For

Property Market Commentary 10 Most Affordable New Launch Condos Under $1.5 Million—Some Are Surprisingly Central

Editor's Pick Why I Might Still Pay $1 Million For A 50-Year-Old HDB—Even If Everyone Says It’s A Bad Buy

Property Market Commentary Singapore’s Most Expensive Neighbourhoods Are Changing—4 Buyer Trends That Prove It In 2025

Property Market Commentary URA 2025 Draft Master Plan: 6 Under The Radar Changes You May Have Missed

Singapore Property News This 3-Room Flat in Toa Payoh Just Sold for $920K — Here’s What The Seller Could Have Made

Editor's Pick We Found Freehold Landed Homes From $4 Million In The East—But Would You Live Here?

Singapore Property News Would You Still Pay More For A Private Condo, If The EC Next Door Looked The Same?

Overseas Property Investing Why I Bought 7 Properties in Johor Bahru, and Will Still Buy More
