Old vs New Condos In District 15: Which Offers Better Value In 2025?

Get The Property Insights Serious Buyers Read First: Join 50,000+ readers who rely on our weekly breakdowns of Singapore’s property market.

A seasoned content strategist with over 17 years in the real estate and financial journalism sectors, Ryan has built a reputation for transforming complex industry jargon into accessible knowledge. With a track record of writing and editing for leading financial platforms and publications, Ryan's expertise has been recognised across various media outlets. His role as a former content editor for 99.co and a co-host for CNA 938's Open House programme underscores his commitment to providing valuable insights into the property market.
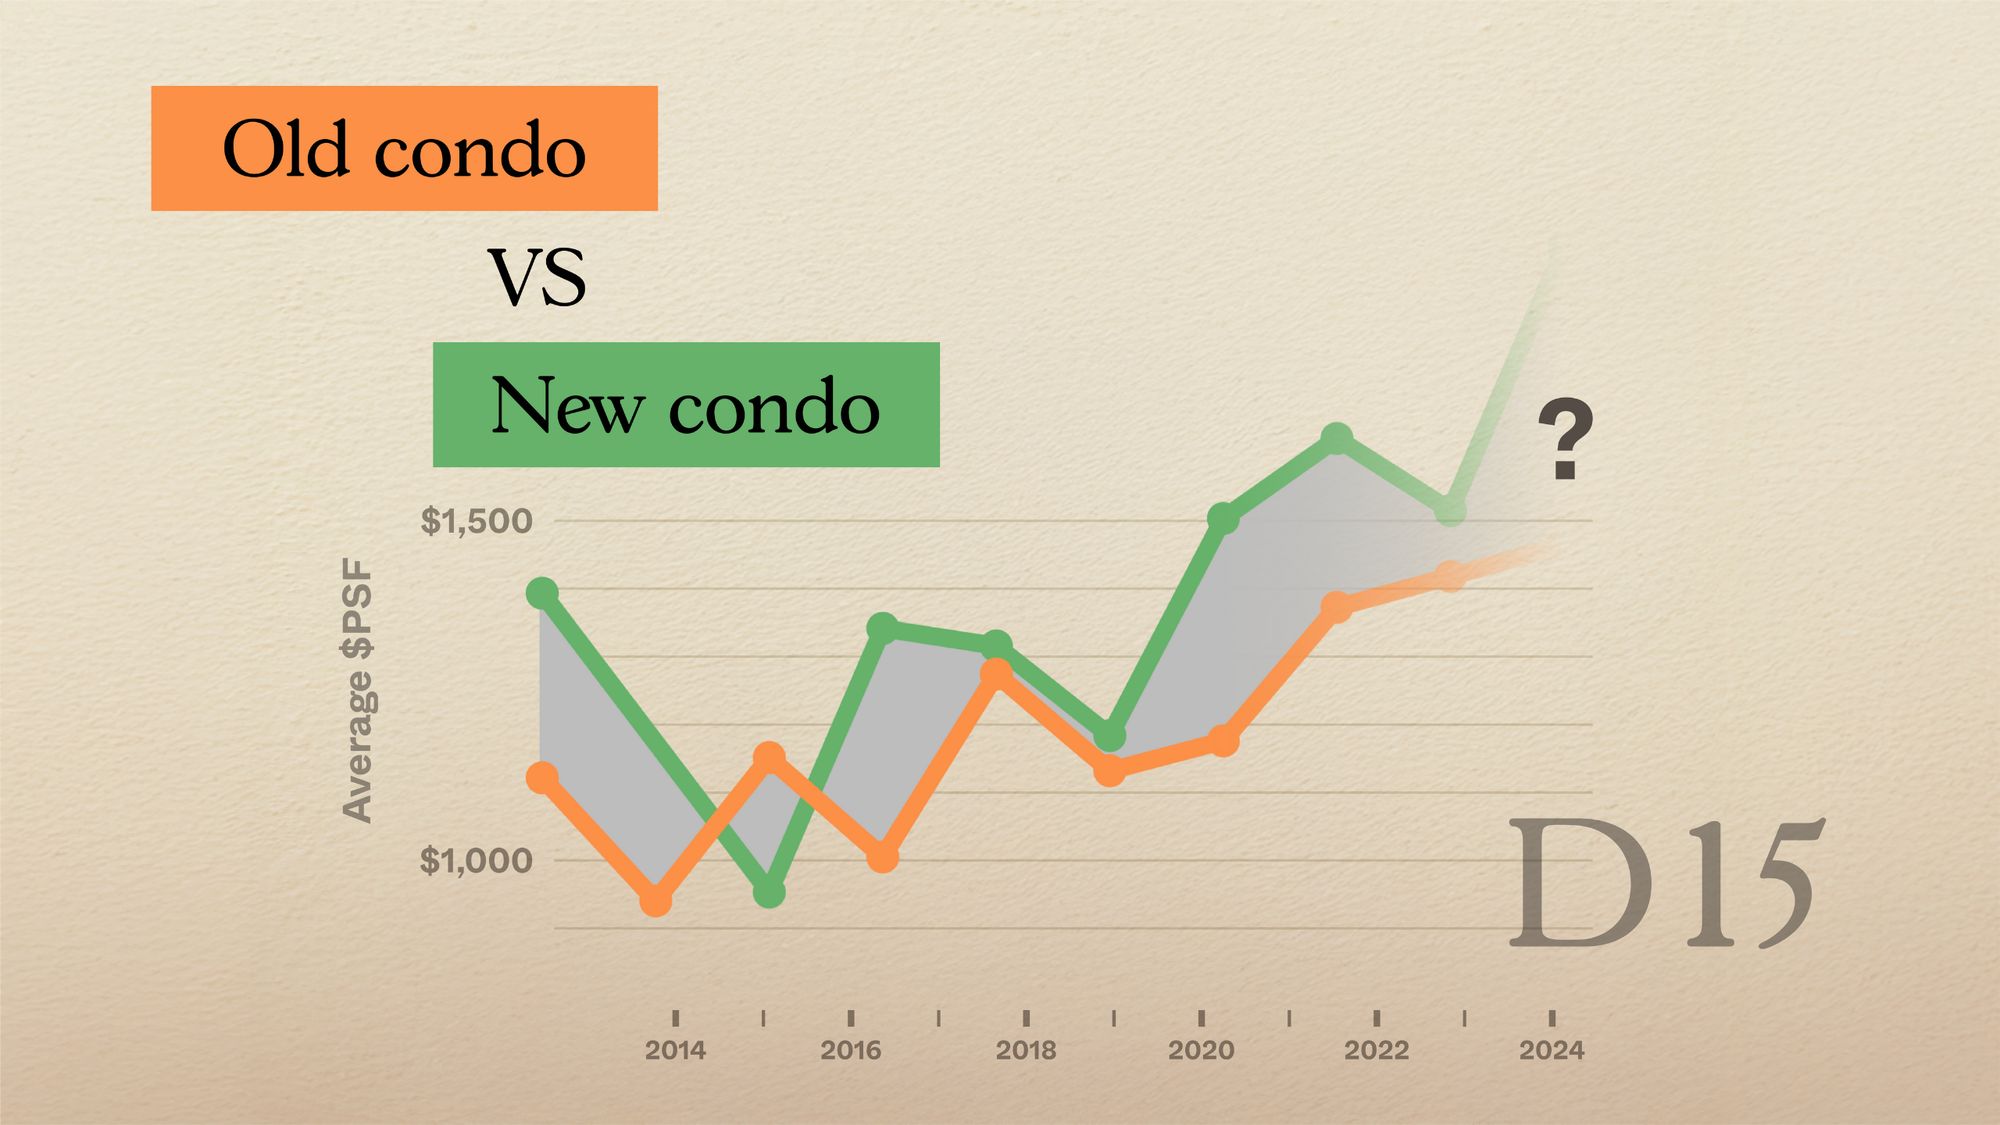
It’s hard to think of a time when the price gap between new and resale condos was more relevant, than in 2025. With new launches being pricier and smaller, it’s unsurprising that more are turning to the resale market. For a price almost comparable to a new launch, you may be able to find a resale unit in a prime area like District 15 (D15).
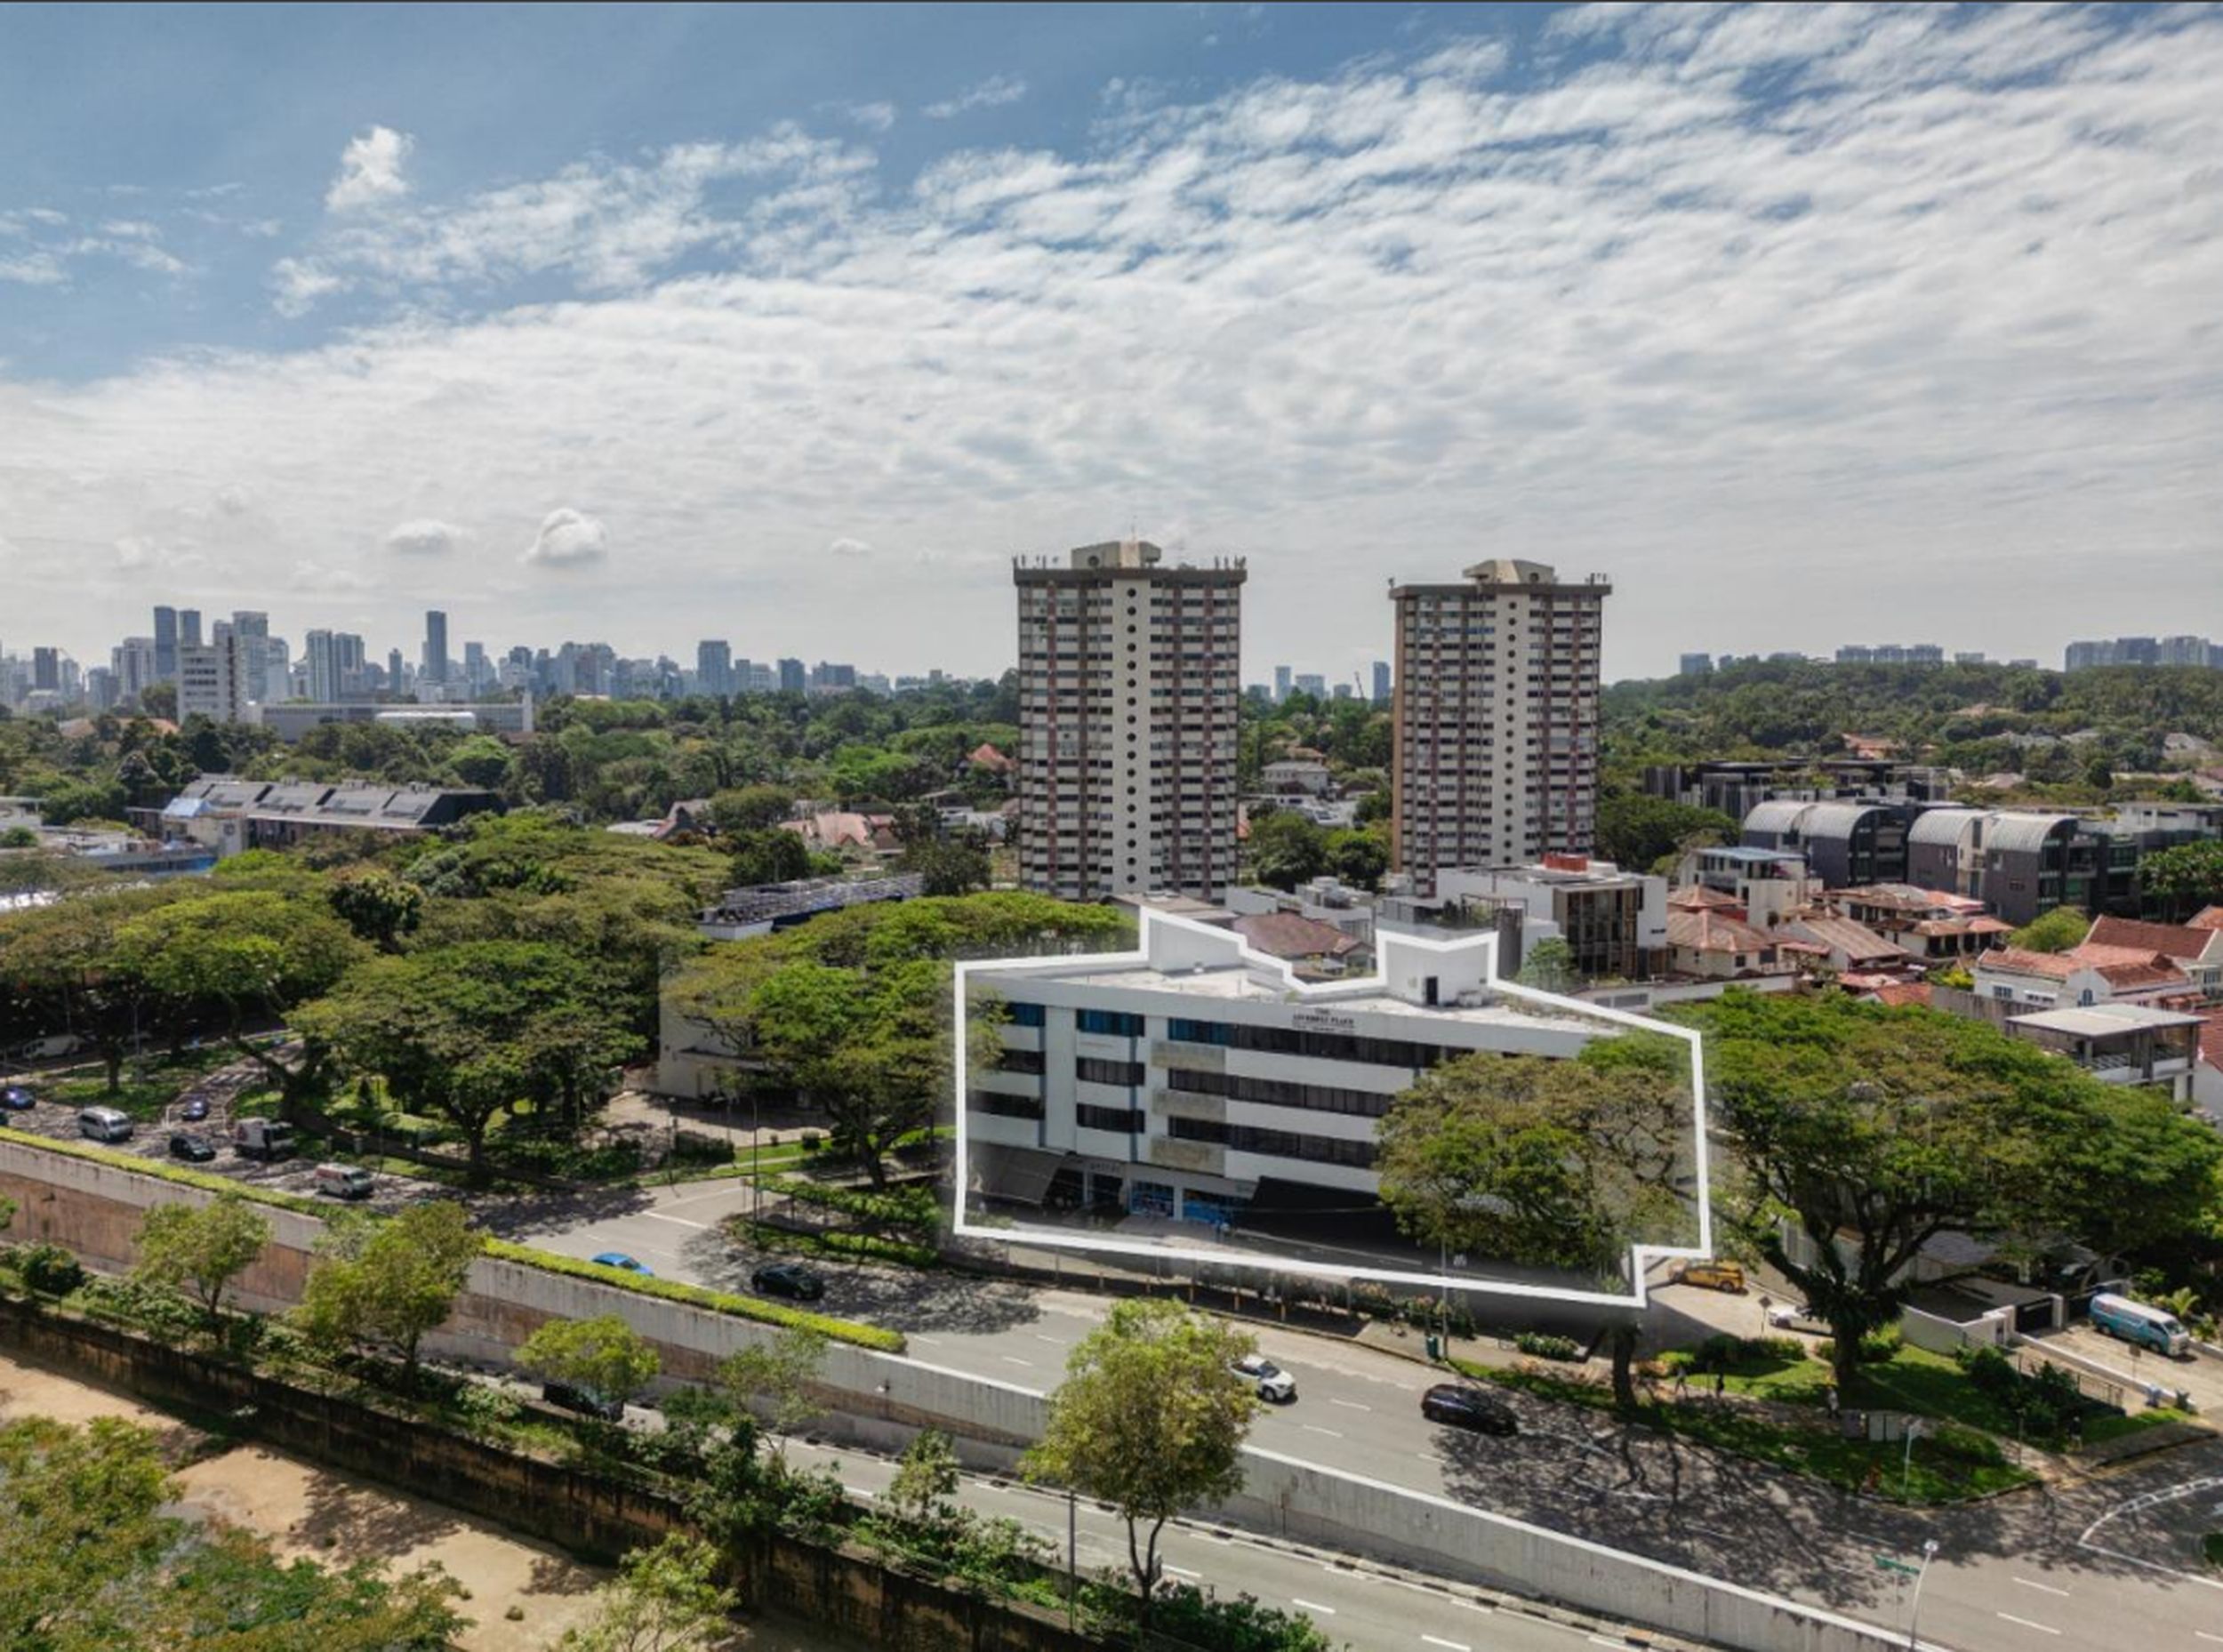
But at the same time, there’s no avoiding the fact that age matters. How much do ageing layouts and facilities, or lease decay (if not freehold), affect the value? Let’s find out with a close-up look at price gaps between newer and older projects in each district. We’ll begin with D15, long known for its coastal living and higher-end projects:
Let’s start by looking at the overall performance of resale condos in D15
Year | D15 | All non-landed private properties |
2014 | $1,230 | $1,215 |
2015 | $1,222 | $1,197 |
2016 | $1,209 | $1,248 |
2017 | $1,306 | $1,293 |
2018 | $1,325 | $1,323 |
2019 | $1,317 | $1,346 |
2020 | $1,321 | $1,280 |
2021 | $1,458 | $1,354 |
2022 | $1,575 | $1,473 |
2023 | $1,711 | $1,595 |
2024 | $1,805 | $1,681 |
Annualised | 3.90% | 3.30% |

Overall, we see that D15 has outperformed the overall property market over the past decade. But this is a broad and unspecific view.
Our next step is to filter out the freehold projects and look at how the leasehold condos in D15 have performed on their own. This is relevant when comparing older to newer condos, because freehold properties are not subject to lease decay.
Here’s how the leasehold properties have performed:
Year | D15 | All non-landed private properties |
2014 | $1,144 | $1,066 |
2015 | $1,127 | $1,051 |
2016 | $1,051 | $1,140 |
2017 | $1,062 | $1,123 |
2018 | $1,177 | $1,164 |
2019 | $1,168 | $1,189 |
2020 | $1,184 | $1,159 |
2021 | $1,381 | $1,227 |
2022 | $1,469 | $1,370 |
2023 | $1,534 | $1,516 |
2024 | $1,646 | $1,616 |
Annualised | 3.70% | 4.25% |

When we isolate the 99-year segment, the performance is noticeably weaker. Over the past decade, leasehold condos in D15 have averaged about 3.7 per cent annualised growth, compared to 4.25 per cent for the broader condo market.
This suggests that D15’s strong showing over the past decade may have come mainly from its freehold properties.
Next, let’s look at the performance of freehold properties in D15:
Note: We group 999-year lease properties with freehold properties in this article, as 999-year lease projects also effectively ignore lease decay.
Year | D15 | All non-landed private properties |
2014 | $1,250 | $1,385 |
2015 | $1,248 | $1,366 |
2016 | $1,256 | $1,393 |
2017 | $1,385 | $1,461 |
2018 | $1,369 | $1,524 |
2019 | $1,364 | $1,572 |
2020 | $1,362 | $1,488 |
2021 | $1,478 | $1,586 |
2022 | $1,610 | $1,709 |
2023 | $1,773 | $1,799 |
2024 | $1,865 | $1,855 |
Annualised | 4.08% | 2.97% |

Over the past decade, freehold condos in D15 have done noticeably better than the broader market. Prices here have risen at an annualised rate of around 4.08 per cent, compared to just 2.97 per cent for all freehold condos across Singapore. This supports our earlier view that D15 is mainly propped up by its freehold projects.
Now let’s compare the performance of newer versus older LEASEHOLD projects in D15:
To do this, we’ll split the condos into two broad groups based on age. New condos are defined as those 20 years old and below, while old condos are those above 20 years old.
(We use 20 years as the mark because, as we’ve shown in this prior study, the average lifespan of a condo before it’s redeveloped is around 19 to 24 years.)
Also, to keep the comparison consistent, we track projects based on their original lease commencement dates, i.e., new condos are projects with leases starting from 1994 to 2014, old condos are projects with leases starting from 1993 and earlier. This ensures we’re following the same set of projects over time; otherwise, new launches appearing during the time period will distort the numbers.
We’re also limiting the data to sub sale and resale transactions. This is to weed out the effect of developer discounts, which are usually present in early launch phases.
Year | New | Old | Difference |
2014 | $1,244 | $921 | $323 |
2015 | $1,244 | $892 | $351 |
2016 | $1,148 | $836 | $312 |
2017 | $1,185 | $869 | $317 |
2018 | $1,238 | $990 | $248 |
2019 | $1,257 | $971 | $285 |
2020 | $1,269 | $973 | $297 |
2021 | $1,374 | $1,072 | $301 |
2022 | $1,508 | $1,152 | $356 |
2023 | $1,599 | $1,204 | $394 |
2024 | $1,708 | $1,233 | $475 |
Annualised | 3.22% | 2.96% |

There’s almost no difference in performance between older and newer leasehold projects here.
From 2014 to 2024, the newer condos saw an annualised growth rate of 3.22 per cent, compared to 2.96 per cent for older projects; a mostly negligible difference.
That said, older condos – despite their lower $PSF – often compensate with much larger unit sizes. This means the overall quantum (the total price you pay) can still be higher than you’d expect.
To understand how this plays out for actual buyers, let’s take a look at the average transaction prices between new and old projects.
Year | New | Old | Difference |
2014 | $1,933,390 | $1,312,390 | $621,000 |
2015 | $2,039,061 | $1,291,221 | $747,840 |
2016 | $1,804,272 | $1,201,896 | $602,376 |
2017 | $1,935,110 | $1,222,344 | $712,767 |
2018 | $1,812,798 | $1,357,561 | $455,237 |
2019 | $1,954,770 | $1,477,881 | $476,889 |
2020 | $1,947,815 | $1,390,135 | $557,680 |
2021 | $2,075,108 | $1,527,990 | $547,118 |
2022 | $2,319,007 | $1,685,072 | $633,935 |
2023 | $2,388,717 | $1,801,874 | $586,843 |
2024 | $2,560,294 | $1,811,428 | $748,866 |
% increase from 2014 to 2024 | 32.43% | 38.03% |

Quantum-wise, the price gap between new and old projects has widened steadily from 2014 to 2024. But the mix of unit types being transacted can also skew the numbers – so it’s worth breaking things down further before drawing conclusions:
One-bedroom units
Average $PSF
Year | New | Old | Difference |
2014 | $1,297 | $1,087 | $210 |
2015 | $947 | ||
2016 | $957 | $1,110 | -$153 |
2017 | $1,257 | $997 | $260 |
2018 | $1,237 | $1,205 | $33 |
2019 | $1,135 | $1,095 | $40 |
2020 | $1,382 | $1,129 | $253 |
2021 | $1,473 | $1,281 | $192 |
2022 | $1,391 | $1,316 | $76 |
2023 | $1,690 | $1,352 | $338 |
2024 | $1,576 | $1,526 | $50 |
Annualised | 1.97% | 3.45% |

Older one-bedders outperformed new ones over the past decade; we see 3.45 per cent compared to just 1.97 per cent for new launches. By 2024, the average $PSF was $1,576 for new and $1,526 for old, a negligible $50 gap.
But let’s look at it in terms of actual quantum:
Average price
Year | New | Old | Difference |
2014 | $1,092,500 | $795,600 | $296,900 |
2015 | $693,000 | ||
2016 | $923,000 | $742,500 | $180,500 |
2017 | $985,467 | $711,914 | $273,552 |
2018 | $1,131,778 | $830,750 | $301,028 |
2019 | $1,055,000 | $801,500 | $253,500 |
2020 | $1,160,000 | $752,500 | $407,500 |
2021 | $1,176,667 | $963,157 | $213,509 |
2022 | $1,299,000 | $951,667 | $347,333 |
2023 | $1,335,000 | $989,000 | $346,000 |
2024 | $1,434,500 | $1,060,429 | $374,071 |
% increase from 2014 to 2024 | 31.30% | 33.29% |

While the $PSF gap between new and old one-bedders has narrowed, the price gap in quantum has widened: in 2014, the average new one-bedder cost about $1.09 million compared to $796,000 for an older unit.
As of last year, the gap had widened, with new one-bedders averaging $1.43 million and older ones at $1.06 million.
While it’s not by a large margin, the older one-bedders have edged out new ones in terms of percentage growth; their average price rose by 33.3 per cent, compared to 31.3 per cent for new launches.
Let’s also look at the average unit sizes, to put the prices in context:
Year | New | Old |
2014 | 843 | 732 |
2015 | 732 | |
2016 | 980 | 673 |
2017 | 800 | 717 |
2018 | 924 | 689 |
2019 | 933 | 732 |
2020 | 840 | 673 |
2021 | 804 | 750 |
2022 | 947 | 723 |
2023 | 791 | 732 |
2024 | 912 | 695 |

This is the transaction volume:
Year | New | Old |
2014 | 4 | 5 |
2015 | 1 | |
2016 | 2 | 2 |
2017 | 6 | 13 |
2018 | 5 | 4 |
2019 | 3 | 4 |
2020 | 2 | 4 |
2021 | 6 | 12 |
2022 | 5 | 6 |
2023 | 2 | 2 |
2024 | 4 | 7 |
An interesting difference is that, for one and two-bedders, the older condos have a higher square footage on average. This inversion is due to a few specific projects: Pebble Bay, Costa Rhu, and Cote D’Azur.
These projects built unusually large one and two-bedders; one-bedders can be upward of 840 sq ft., while the two-bedders can be upward of 1,100 sq ft. As such, this skewed the average size for older condos upward.
Now, let’s look deeper into the specific projects sold in 2024
New
Project | Average $PSF | Average price | Average size | No. of units sold | Lease start year |
COTE D’AZUR | $1,425 | $1,288,000 | 904 | 1 | 2001 |
PEBBLE BAY | $1,627 | $1,483,333 | 915 | 3 | 1994 |
Old
Project | Average $PSF | Average price | Average size | No. of units sold | Lease start year |
TANJONG RIA CONDOMINIUM | $1,564 | $959,333 | 614 | 3 | 1993 |
MANDARIN GARDENS | $1,407 | $1,030,000 | 732 | 2 | 1982 |
CASUARINA COVE | $1,589 | $1,242,500 | 780 | 2 | 1993 |
On the surface, Cote D’Azur and Pebble Bay show higher average prices compared to the older developments, with larger unit sizes as well. But as we noted earlier, this is because their one and two-bedders were built much larger than today’s norms.
Let’s take a look at one-bedder units in these specific projects, to see how they’ve performed over the decade:
Year | COTE D’AZUR | PEBBLE BAY | TANJONG RIA CONDOMINIUM | MANDARIN GARDENS | CASUARINA COVE |
2014 | $1,330 | $1,199 | $1,087 | ||
2015 | $947 | ||||
2016 | $957 | $1,174 | $1,045 | ||
2017 | $1,152 | $1,219 | $1,181 | $963 | |
2018 | $1,275 | $1,088 | $1,174 | $1,235 | |
2019 | $1,135 | $1,095 | |||
2020 | $1,382 | $1,247 | $1,011 | ||
2021 | $1,453 | $1,459 | $1,304 | $1,214 | $1,393 |
2022 | $1,516 | $1,155 | $1,268 | $1,325 | |
2023 | $1,658 | $1,352 | |||
2024 | $1,425 | $1,627 | $1,564 | $1,407 | $1,589 |
Annualised | 0.69% | 3.10% | 2.61% |
The picture is quite mixed across these projects.
Cote D’Azur has been fairly subdued, with annualised growth of just 0.69 per cent – a far cry from Pebble Bay, which came in at 3.1 per cent. Among the older developments, Mandarin Gardens isn’t far off Pebble Bay’s pace, and clearly outperforms Cote D’Azur.
While Pebble Bay’s performance stands out among the newer condos, age alone doesn’t explain the differences. Some older developments have actually outpaced one of the newer ones, highlighting how much individual project dynamics can matter.
Next, let’s see how these projects fare on rental. We’ll highlight the newer developments to make the comparison clearer.
Project | Average price in 2024 | Average monthly rent (June 2024 – June 2025) | Rental yield |
CASUARINA COVE | $1,242,500 | $3,083 | 2.98% |
PEBBLE BAY | $1,483,333 | $3,928 | 3.18% |
COTE D’AZUR | $1,288,000 | $3,864 | 3.60% |
TANJONG RIA CONDOMINIUM | $959,333 | $3,007 | 3.76% |
MANDARIN GARDENS | $1,030,000 | $3,249 | 3.79% |
Note: Gross rental yield = annual rental income/cost of property
Older projects often show stronger yields, largely because of their lower entry prices. Tanjong Ria Condominium is a good example: despite having both the lowest average price and rent, it managed one of the highest yields at 3.76 per cent. Mandarin Gardens was similar, with yields just under 3.8 per cent.
That said, the pattern isn’t absolute. Cote D’Azur, a newer project with a higher average price, still turned in a respectable yield of 3.6 per cent. That’s not far behind the older condos, and even ahead of Casuarina Cove. Pebble Bay, meanwhile, saw the highest average rent but only mid-range yields, reflecting its higher price point.
Overall, it doesn’t appear that age has compromised the ability to attract tenants for the one-bedders.
Next, we’ll look at two-bedroom units
Average $PSF
Year | New | Old | Difference |
2014 | $1,212 | $1,152 | $60 |
2015 | $1,201 | $1,064 | $138 |
2016 | $1,153 | $964 | $189 |
2017 | $1,171 | $1,008 | $162 |
2018 | $1,240 | $1,141 | $99 |
2019 | $1,227 | $1,118 | $109 |
2020 | $1,288 | $1,118 | $170 |
2021 | $1,340 | $1,239 | $101 |
2022 | $1,492 | $1,316 | $176 |
2023 | $1,588 | $1,450 | $138 |
2024 | $1,738 | $1,532 | $206 |
Annualised | 3.67% | 2.89% |
More from Stacked
How Have Older Leasehold Condos Performed Compared To Newer Ones? A Case Study Of The Tanamera
In this Stacked Pro breakdown:

We can see that over the past decade, newer two-bedders have outperformed older ones. The price gap has also widened: in 2014, the difference in average $PSF was just $60; by 2024, it had grown to $206. At no point in the last 10 years did older projects pull ahead: the $PSF for newer two-bedders has remained higher throughout.
Now let’s look at overall prices for two-bedders:
Average Price:
Year | New | Old | Difference |
2014 | $1,268,176 | $1,251,429 | $16,748 |
2015 | $1,322,900 | $1,055,900 | $267,000 |
2016 | $1,332,779 | $953,250 | $379,529 |
2017 | $1,330,526 | $1,004,933 | $325,592 |
2018 | $1,404,576 | $1,053,875 | $350,701 |
2019 | $1,281,161 | $1,067,167 | $213,995 |
2020 | $1,394,714 | $1,148,636 | $246,078 |
2021 | $1,503,024 | $1,319,535 | $183,489 |
2022 | $1,665,325 | $1,366,500 | $298,825 |
2023 | $1,709,000 | $1,378,088 | $330,912 |
2024 | $1,834,551 | $1,617,321 | $217,230 |
% increase from 2014 to 2024 | 44.66% | 29.24% |

There’s no difference when we look at quantum. Over the past decade, average prices of new two-bedders climbed by 44.7 per cent, compared to 29.2 per cent for older projects; so the newer two-bedders come out ahead again.
The gap between new and old has also widened. In 2014, the quantum difference was just under $17,000. By 2024, it had grown to more than $217,000.
In short, buyers who paid the premium for a new launch two-bedder a decade ago made the right choice; most would have come out ahead.
Here are the sizes of the transacted units:
Year | New | Old |
2014 | 1073 | 1087 |
2015 | 1113 | 988 |
2016 | 1168 | 986 |
2017 | 1149 | 984 |
2018 | 1156 | 915 |
2019 | 1062 | 947 |
2020 | 1097 | 1016 |
2021 | 1129 | 1067 |
2022 | 1131 | 1030 |
2023 | 1088 | 951 |
2024 | 1066 | 1053 |

Newer two-bedders had a larger average size, for the same reasons we mentioned earlier – certain projects like Pebble Bay and Cote D’Azur had unusually large one and two-bedders.
Now here are the transaction numbers:
Year | New | Old |
2014 | 17 | 7 |
2015 | 30 | 10 |
2016 | 34 | 8 |
2017 | 52 | 15 |
2018 | 66 | 8 |
2019 | 31 | 6 |
2020 | 34 | 11 |
2021 | 75 | 11 |
2022 | 55 | 6 |
2023 | 42 | 10 |
2024 | 47 | 9 |
With that, let’s look further into the projects sold in 2024:
New
Project | Average $PSF | Average price | Average size | No. of units sold | Lease start year |
THE RED HOUSE | $1,662 | $1,225,000 | 737 | 2 | 2012 |
SANCTUARY GREEN | $1,741 | $1,448,100 | 832 | 10 | 1997 |
DUNMAN VIEW | $1,764 | $1,500,000 | 850 | 1 | 1997 |
LEGENDA AT JOO CHIAT | $1,471 | $1,520,000 | 1033 | 1 | 2001 |
VILLA MARINA | $1,359 | $1,536,000 | 1130 | 3 | 1995 |
RIVEREDGE | $1,664 | $1,630,000 | 980 | 1 | 2004 |
WATER PLACE | $1,825 | $1,650,000 | 904 | 1 | 1998 |
COSTA RHU | $1,406 | $1,891,143 | 1347 | 7 | 1994 |
COTE D’AZUR | $1,728 | $2,027,000 | 1179 | 4 | 2001 |
SILVERSEA | $2,041 | $2,076,074 | 1019 | 12 | 2007 |
PEBBLE BAY | $1,785 | $2,425,200 | 1358 | 5 | 1994 |
Old
Project | Average $PSF | Average price | Average size | No. of unit sold | Lease start year |
MANDARIN GARDENS | $1,432 | $1,377,222 | 958 | 4 | 1982 |
TANJONG RIA CONDOMINIUM | $1,627 | $1,443,500 | 888 | 2 | 1993 |
CASUARINA COVE | $1,602 | $2,053,333 | 1288 | 3 | 1993 |
Among the older condos, average prices for two-bedders often sit within the same range as the newer ones. Mandarin Gardens, for instance, averaged about $1.38 million – not far off The Red House, which came in at $1.23 million despite being much newer. In fact, The Red House was cheaper than any of the older projects on this list, which underlines how project-specific factors can outweigh age alone.
One possible issue with The Red House, which explains the lower price point, is that it’s a 99-year leasehold project sitting on freehold land. This is perceived as a drawback that can weaken en-bloc prospects in the far future.
Costa Rhu, Cote D’Azur, and Pebble Bay stood out with larger unit sizes and correspondingly higher quantums, while newer high-profile projects like Silversea also commanded premiums above $2 million.
To see how these differences have played out over time, let’s look at the 10-year performance of two-bedders across these projects. For easier comparison, we’ll highlight the newer developments separately.
Year | THE RED HOUSE | SANCTUARY GREEN | DUNMAN VIEW | LEGENDA AT JOO CHIAT | VILLA MARINA | RIVEREDGE | WATER PLACE | COSTA RHU | COTE D’AZUR | SILVERSEA | PEBBLE BAY | MANDARIN GARDENS | TANJONG RIA CONDOMINIUM | CASUARINA COVE |
2014 | $1,289 | $977 | $871 | $1,501 | $1,255 | $1,207 | $1,565 | $1,129 | $1,136 | $1,189 | $1,138 | |||
2015 | $1,284 | $997 | $889 | $1,339 | $1,269 | $1,154 | $1,267 | $1,606 | $1,233 | $1,054 | $1,152 | |||
2016 | $1,164 | $849 | $1,391 | $1,080 | $1,289 | $1,429 | $1,138 | $936 | $1,004 | $1,025 | ||||
2017 | $1,195 | $920 | $916 | $1,429 | $1,137 | $1,240 | $1,437 | $1,225 | $945 | $1,048 | $1,268 | |||
2018 | $1,303 | $1,129 | $961 | $940 | $1,364 | $1,383 | $1,155 | $1,224 | $1,634 | $1,291 | $1,139 | $1,069 | $1,296 | |
2019 | $1,462 | $1,247 | $929 | $975 | $1,429 | $1,319 | $1,253 | $1,238 | $1,664 | $1,100 | $1,090 | $1,217 | ||
2020 | $1,456 | $1,289 | $1,140 | $1,026 | $975 | $1,403 | $1,195 | $1,347 | $1,591 | $1,394 | $1,067 | $1,141 | $1,202 | |
2021 | $1,442 | $1,385 | $1,141 | $1,082 | $1,113 | $1,545 | $1,438 | $1,274 | $1,401 | $1,669 | $1,382 | $1,237 | $1,244 | $1,238 |
2022 | $1,608 | $1,521 | $1,072 | $1,169 | $1,633 | $1,378 | $1,527 | $1,833 | $1,514 | $1,251 | $1,340 | $1,401 | ||
2023 | $1,566 | $1,634 | $1,482 | $1,454 | $1,271 | $1,681 | $1,474 | $1,702 | $1,854 | $1,612 | $1,446 | $1,473 | $1,407 | |
2024 | $1,662 | $1,741 | $1,764 | $1,471 | $1,359 | $1,664 | $1,825 | $1,406 | $1,728 | $2,041 | $1,785 | $1,432 | $1,627 | $1,602 |
Annualised | 3.05% | 4.18% | 4.55% | 1.04% | 1.14% | 3.65% | 2.69% | 4.69% | 2.35% | 3.19% | 3.48% |
Newer projects like Silversea and Dunman View have shown strong annualised growth of 4.7 and 4.2 per cent respectively, but several older developments have kept pace. Mandarin Gardens and Tanjong Ria Condominium, for example, posted growth rates above three per cent, broadly comparable to mid-level performers like Cote d’Azur. Age doesn’t seem to be having a particularly strong effect.
Next, let’s look at their rental yields. We’ll highlight the newer projects separately for easier comparison:
Project | Average price in 2024 | Average monthly rent (June 2024 – June 2025) | Rental yield |
DUNMAN VIEW | $1,500,000 | $3,300 | 2.64% |
PEBBLE BAY | $2,425,200 | $5,843 | 2.89% |
CASUARINA COVE | $2,053,333 | $4,980 | 2.91% |
COTE D’AZUR | $2,027,000 | $5,305 | 3.14% |
COSTA RHU | $1,891,143 | $4,969 | 3.15% |
SILVERSEA | $2,076,074 | $5,465 | 3.16% |
TANJONG RIA CONDOMINIUM | $1,443,500 | $3,867 | 3.21% |
WATER PLACE | $1,650,000 | $4,507 | 3.28% |
MANDARIN GARDENS | $1,377,222 | $3,788 | 3.30% |
SANCTUARY GREEN | $1,448,100 | $4,092 | 3.39% |
RIVEREDGE | $1,630,000 | $4,623 | 3.40% |
LEGENDA AT JOO CHIAT | $1,520,000 | $4,425 | 3.49% |
VILLA MARINA | $1,536,000 | $4,483 | 3.50% |
THE RED HOUSE | $1,225,000 | $3,633 | 3.56% |
It’s a more or less a middle-of-the-road performance for these projects. The Red House, Villa Marina, and Legenda at Joo Chiat all delivered yields above 3.4 per cent, with The Red House topping the list at 3.56 per cent. By contrast, higher-profile projects like Pebble Bay and Silversea, which command steeper entry prices, saw yields dip below three per cent.
This does suggest that tenants aren’t especially opposed to older projects; perhaps they’re willing to overlook it for a highly desirable D15 location (in particular, the Katong/Joo Chiat area is a well-established expatriate enclave.)
Now, let’s look at three-bedroom leasehold units
Average $PSF
Year | New | Old | Difference |
2014 | $1,215 | $860 | $355 |
2015 | $1,243 | $855 | $388 |
2016 | $1,123 | $804 | $318 |
2017 | $1,181 | $833 | $348 |
2018 | $1,228 | $951 | $276 |
2019 | $1,252 | $945 | $307 |
2020 | $1,216 | $939 | $277 |
2021 | $1,324 | $1,015 | $309 |
2022 | $1,467 | $1,125 | $342 |
2023 | $1,571 | $1,164 | $406 |
2024 | $1,737 | $1,176 | $561 |
Annualised | 3.64% | 3.17% |

The results are not too different from the smaller units. Over the past decade, newer projects have consistently outperformed older ones, with annualised growth of 3.64 per cent compared to 3.17 per cent.
As of 2024, the gap has widened significantly: from a gap of $355 in 2014 to $561 in 2024.
In short, the premium for newer three-bedders has widened against older counterparts.
Now let’s look at it in terms of overall quantum:
Average price
Year | New | Old | Difference |
2014 | $1,774,971 | $1,356,681 | $418,289 |
2015 | $1,934,989 | $1,318,112 | $616,877 |
2016 | $1,735,980 | $1,260,056 | $475,925 |
2017 | $1,872,990 | $1,314,836 | $558,154 |
2018 | $1,841,965 | $1,441,574 | $400,391 |
2019 | $1,913,837 | $1,518,851 | $394,986 |
2020 | $1,802,559 | $1,437,378 | $365,182 |
2021 | $2,010,675 | $1,609,227 | $401,449 |
2022 | $2,239,229 | $1,748,359 | $490,870 |
2023 | $2,295,912 | $1,826,364 | $469,549 |
2024 | $2,721,525 | $1,877,446 | $844,079 |
% increase from 2014 to 2024 | 53.33% | 38.39% |

The pattern remains the same if we look at quantum. From 2014 to 2024, the average price of new three-bedders rose by 53.3 per cent, compared to 38.4 per cent for older ones.
The gap has also widened – in 2014, the difference in quantum was about $418,000. By 2024, that gap had more than doubled to $844,000.
Both segments saw decent appreciation, but newer three-bedders clearly pulled further ahead.
Here’s a look at the unit sizes:
Year | New | Old |
2014 | 1450 | 1575 |
2015 | 1553 | 1547 |
2016 | 1544 | 1567 |
2017 | 1578 | 1572 |
2018 | 1497 | 1511 |
2019 | 1523 | 1607 |
2020 | 1469 | 1528 |
2021 | 1506 | 1582 |
2022 | 1519 | 1552 |
2023 | 1461 | 1569 |
2024 | 1570 | 1593 |

We see a return to normalcy here, compared to the compact units where size was skewed by a few condos with super-large units. For the three bedders, we see a usual situation where older units are bigger on average.
These are the transaction volumes for the units:
Year | New | Old |
2014 | 64 | 38 |
2015 | 60 | 49 |
2016 | 73 | 50 |
2017 | 112 | 107 |
2018 | 105 | 54 |
2019 | 60 | 47 |
2020 | 67 | 59 |
2021 | 123 | 80 |
2022 | 105 | 66 |
2023 | 66 | 64 |
2024 | 91 | 79 |
Now let’s dive into the specific projects sold in 2024:
New
Project | Average $PSF | Average price | Average size | No. of units sold | Lease start year |
EAST BAY GARDENS | $968 | $1,355,000 | 1399 | 1 | 1995 |
LEGENDA AT JOO CHIAT | $1,324 | $1,879,167 | 1460 | 3 | 2001 |
DUNMAN VIEW | $1,546 | $1,891,111 | 1223 | 9 | 1997 |
VILLA MARINA | $1,447 | $1,986,500 | 1400 | 12 | 1995 |
SANCTUARY GREEN | $1,647 | $2,061,778 | 1251 | 5 | 1997 |
WATER PLACE | $1,817 | $2,338,000 | 1286 | 11 | 1998 |
RIVEREDGE | $1,789 | $2,388,000 | 1335 | 1 | 2004 |
COTE D’AZUR | $1,986 | $2,643,111 | 1332 | 9 | 2001 |
COSTA RHU | $1,546 | $2,927,000 | 1899 | 10 | 1994 |
SILVERSEA | $2,190 | $3,482,154 | 1588 | 13 | 2007 |
PEBBLE BAY | $1,780 | $3,681,335 | 2076 | 16 | 1994 |
CAMELOT BY-THE-WATER | $1,530 | $4,166,000 | 2723 | 1 | 1996 |
Old
Project | Average $PSF | Average price | Average size | No. of units sold | Lease start year |
NEPTUNE COURT | $1,019 | $1,508,494 | 1473 | 27 | 1975 |
TANJONG RIA CONDOMINIUM | $1,534 | $1,862,222 | 1214 | 4 | 1993 |
LAGOON VIEW | $1,150 | $1,894,222 | 1647 | 9 | 1977 |
LAGUNA PARK | $1,182 | $1,926,167 | 1641 | 18 | 1977 |
MANDARIN GARDENS | $1,298 | $2,287,050 | 1762 | 20 | 1982 |
CASUARINA COVE | $1,649 | $2,680,000 | 1625 | 1 | 1993 |
The average prices of older three-bedders often overlap with newer ones. Neptune Court, Lagoon View, Laguna Park, and Mandarin Gardens all transacted within the same price range as newer projects like Dunman View, Villa Marina, and Sanctuary Green.
East Bay Gardens is a curious outlier: despite being a newer development, it recorded both a lower $PSF and a lower average price than Neptune Court, which is two decades older! We can’t see the reason for the pricing data alone, but sometimes project-specific quirks can overturn the usual assumptions.
With that in mind, let’s look at how three-bedders across these projects have performed over the decade. We’ll highlight the newer developments separately to make the comparisons clearer:
Year | EAST BAY GARDENS | LEGENDA AT JOO CHIAT | DUNMAN VIEW | VILLA MARINA | SANCTUARY GREEN | WATER PLACE | RIVEREDGE | COTE D’AZUR | COSTA RHU | SILVERSEA | PEBBLE BAY | CAMELOT BY-THE-WATER | NEPTUNE COURT | TANJONG RIA CONDOMINIUM | LAGOON VIEW | LAGUNA PARK | MANDARIN GARDENS | CASUARINA COVE |
2014 | $795 | $870 | $1,002 | $966 | $1,154 | $1,249 | $1,235 | $1,256 | $1,245 | $1,770 | $1,351 | $777 | $1,234 | $750 | $833 | $957 | $1,069 | |
2015 | $837 | $1,001 | $925 | $1,152 | $1,201 | $1,269 | $1,339 | $1,208 | $1,629 | $1,285 | $727 | $1,087 | $757 | $821 | $887 | $1,058 | ||
2016 | $795 | $849 | $953 | $869 | $1,118 | $1,237 | $1,240 | $1,131 | $1,477 | $1,279 | $702 | $1,064 | $743 | $819 | $839 | $1,048 | ||
2017 | $747 | $807 | $1,000 | $854 | $1,089 | $1,181 | $1,290 | $1,311 | $1,147 | $1,571 | $1,323 | $1,284 | $736 | $1,128 | $782 | $866 | $861 | $1,104 |
2018 | $830 | $907 | $1,044 | $939 | $1,166 | $1,300 | $1,325 | $1,405 | $1,268 | $1,673 | $1,402 | $887 | $1,153 | $970 | $1,008 | $1,023 | $1,244 | |
2019 | $748 | $922 | $1,094 | $994 | $1,182 | $1,292 | $1,376 | $1,262 | $1,268 | $1,623 | $1,479 | $907 | $1,050 | $886 | $966 | $988 | $1,237 | |
2020 | $772 | $786 | $1,065 | $997 | $1,221 | $1,266 | $1,355 | $1,423 | $1,205 | $1,624 | $1,448 | $836 | $1,187 | $918 | $961 | $996 | $1,153 | |
2021 | $887 | $1,072 | $1,110 | $1,003 | $1,274 | $1,310 | $1,420 | $1,455 | $1,330 | $1,681 | $1,477 | $1,212 | $906 | $1,194 | $1,024 | $1,052 | $1,074 | $1,177 |
2022 | $885 | $1,235 | $1,278 | $1,100 | $1,438 | $1,526 | $1,554 | $1,721 | $1,448 | $2,031 | $1,682 | $1,629 | $996 | $1,355 | $1,129 | $1,150 | $1,207 | $1,460 |
2023 | $900 | $1,333 | $1,423 | $1,299 | $1,478 | $1,648 | $1,734 | $1,798 | $1,523 | $2,009 | $1,762 | $1,030 | $1,468 | $1,151 | $1,197 | $1,248 | $1,474 | |
2024 | $968 | $1,324 | $1,546 | $1,447 | $1,647 | $1,817 | $1,789 | $1,986 | $1,546 | $2,190 | $1,780 | $1,530 | $1,019 | $1,534 | $1,150 | $1,182 | $1,298 | $1,649 |
Annualised | 1.99% | 4.29% | 4.43% | 4.13% | 3.62% | 3.81% | 3.77% | 4.69% | 2.19% | 2.15% | 2.79% | 2.75% | 2.20% | 4.37% | 3.56% | 3.09% | 4.43% |
Older three-bedders are still able to keep pace with their newer counterparts. Newer developments like Cote D’Azur and Dunman View posted good annualised growth of over four per cent, several older condos – such as Lagoon View and Casuarina Cove – matched or even exceeded that pace.
At the other end of the spectrum, some newer projects, including East Bay Gardens and Silversea, actually saw much lower growth, closer to two per cent. This underlines that age doesn’t always mean weaker performance.
Next, let’s see how these three-bedders stack up in terms of rental yields. We’ll highlight the newer projects separately to make the comparisons clearer:
Project | Average price in 2024 | Average monthly rent (June 2024 – June 2025) | Rental yield |
CASUARINA COVE | $2,680,000 | $6,264 | 2.80% |
COTE D’AZUR | $2,643,111 | $6,187 | 2.81% |
SILVERSEA | $3,482,154 | $8,492 | 2.93% |
MANDARIN GARDENS | $2,287,050 | $5,661 | 2.97% |
PEBBLE BAY | $3,681,335 | $9,130 | 2.98% |
DUNMAN VIEW | $1,891,111 | $4,728 | 3.00% |
WATER PLACE | $2,338,000 | $5,939 | 3.05% |
COSTA RHU | $2,927,000 | $7,583 | 3.11% |
RIVEREDGE | $2,388,000 | $6,275 | 3.15% |
VILLA MARINA | $1,986,500 | $5,395 | 3.26% |
SANCTUARY GREEN | $2,061,778 | $5,657 | 3.29% |
TANJONG RIA CONDOMINIUM | $1,862,222 | $5,395 | 3.48% |
LEGENDA AT JOO CHIAT | $1,879,167 | $5,675 | 3.62% |
Two of the older projects – Casuarina Cove and Mandarin Gardens – posted some of the lowest yields, at around 2.8 to three per cent.
By contrast, several newer developments delivered stronger rental performance. Legenda at Joo Chiat led the way with a yield of 3.6 per cent, while Sanctuary Green, Villa Marina, and Dunman View all landed above the three per cent mark. Even high-profile projects like Silversea and Pebble Bay, despite their higher price points, managed to keep yields competitive in the 2.9 to three per cent range.
Overall, newer three-bedders appear to offer an edge on rental returns.
Next, we’ll look at four-bedroom units
Average $PSF
Year | New | Old | Difference |
2014 | $1,365 | ||
2015 | $1,300 | $953 | $347 |
2016 | $1,235 | ||
2017 | $1,243 | ||
2018 | $1,293 | ||
2019 | $1,362 | $901 | $461 |
2020 | $1,388 | $848 | $540 |
2021 | $1,569 | $1,336 | $233 |
2022 | $1,714 | $1,005 | $709 |
2023 | $1,695 | $1,103 | $592 |
2024 | $1,661 | $1,069 | $592 |
Annualised | 2.76% | 1.28% |

We need to use 2015 to 2024 as the time period, since there were no older four-bedder transactions in 2014.
New four-bedders saw annualised growth of 2.76 per cent, compared to just 1.28 per cent for older ones. The gap has also widened: from $347 in 2015 to $592 in 2024, peaking at more than $700 in 2022.
In short, the premium for newer four-bedders has held, and they’ve stayed ahead of older counterparts.
Now let’s look at the differences in quantum:
Average price
Year | New | Old | Difference |
2014 | $2,884,236 | ||
2015 | $2,957,230 | $2,925,000 | $32,230 |
2016 | $2,672,933 | ||
2017 | $2,727,075 | ||
2018 | $2,822,030 | ||
2019 | $3,056,348 | $3,100,000 | -$43,652 |
2020 | $3,257,087 | $2,600,000 | $657,087 |
2021 | $3,379,919 | $4,100,000 | -$720,081 |
2022 | $4,084,339 | $3,820,000 | $264,339 |
2023 | $4,060,564 | $3,950,000 | $110,564 |
2024 | $3,778,300 | $3,600,000 | $178,300 |
% increase from 2015 to 2024 | 27.76% | 23.08% |

The results are still the same if we go by quantum. Newer four-bedders saw prices rise by 27.8 per cent, compared to 23.1 per cent for older units.
By 2024, the difference from older four-bedders had grown to about $178,000, with occasional years where older projects briefly outpaced on quantum – such as 2019 and 2021. But it was not enough to overturn the long-term trend, and newer condos came out ahead.
These are the sizes of the transacted units:
Year | New | Old |
2014 | 2061 | |
2015 | 2228 | 3068 |
2016 | 2122 | |
2017 | 2116 | |
2018 | 2168 | |
2019 | 2209 | 3434 |
2020 | 2304 | 3068 |
2021 | 2113 | 3068 |
2022 | 2321 | 3800 |
2023 | 2392 | 3579 |
2024 | 2245 | 3369 |

As expected, older four-bedders tended to have larger sizes.
This is the transaction volume:
Year | New | Old |
2014 | 25 | |
2015 | 31 | 1 |
2016 | 24 | |
2017 | 33 | |
2018 | 25 | |
2019 | 23 | 2 |
2020 | 23 | 2 |
2021 | 41 | 1 |
2022 | 28 | 1 |
2023 | 22 | 2 |
2024 | 26 | 1 |
Because four-bedders come with such high price tags, they are not widely affordable. This results in a lower transaction volume, which we unfortunately have to work with; we have to accept a little more volatility in the prices of such high-cost units.
This would also explain many of the fluctuations in price gaps, between old and newer four-bedders.
Let’s look at the specific projects transacted in 2024:
New
Project | Average $PSF | Average price | Average size | No. of unit sold | Completion year |
WATER PLACE | $1,594 | $2,385,000 | 1493 | 3 | 1998 |
VILLA MARINA | $1,226 | $2,480,000 | 2024 | 2 | 1995 |
SANCTUARY GREEN | $1,494 | $2,837,600 | 1942 | 8 | 1997 |
RIVEREDGE | $1,964 | $3,150,000 | 1604 | 1 | 2004 |
COSTA RHU | $1,728 | $3,872,500 | 2239 | 4 | 1994 |
PEBBLE BAY | $1,802 | $5,030,000 | 2788 | 2 | 1994 |
CAMELOT BY-THE-WATER | $1,529 | $5,400,000 | 3531 | 1 | 1996 |
SILVERSEA | $2,001 | $5,864,000 | 2928 | 5 | 2007 |
Old
Project | Average $PSF | Average price | Average size | No. of unit sold | Completion year |
LAGUNA PARK | $1,069 | $3,600,000 | 3369 | 1 | 1978 |
For four-bedroom units sold in 2024, most of the transactions were in newer developments. As we warned above, prices were volatile and varied widely – from about $2.4 million at Water Place and Villa Marina, to over $5.8 million at Silversea!
Larger-format projects like Pebble Bay and Camelot by-the-Water naturally pushed the averages higher, with unit sizes often exceeding 2,700 sq ft.
On the older side, only a single transaction was recorded at Laguna Park. Its price of $3.6 million, which placed it squarely in the mid-range compared to the newer projects.
None of this is particularly representative due to limited transaction volumes, but that’s all we have to work with.
With that in mind, let’s look at how these four-bedders have performed over the past 10 years. We’ll highlight the newer developments separately for easier comparison:
Year | WATER PLACE | VILLA MARINA | SANCTUARY GREEN | RIVEREDGE | COSTA RHU | PEBBLE BAY | CAMELOT BY-THE-WATER | SILVERSEA | LAGUNA PARK |
2014 | $1,244 | $825 | $1,169 | $1,247 | $1,317 | $1,406 | $1,790 | $1,740 | |
2015 | $1,247 | $785 | $1,112 | $1,311 | $1,380 | $1,396 | $1,916 | ||
2016 | $1,179 | $786 | $1,111 | $1,240 | $1,342 | $1,443 | $1,659 | ||
2017 | $1,202 | $796 | $1,016 | $1,340 | $1,276 | $1,389 | $1,780 | ||
2018 | $1,202 | $808 | $1,133 | $1,446 | $1,430 | $1,547 | $1,571 | $1,858 | |
2019 | $1,338 | $815 | $1,233 | $1,378 | $1,438 | $1,677 | $1,573 | $1,495 | |
2020 | $1,141 | $823 | $1,280 | $1,402 | $1,482 | $1,629 | $1,533 | $1,873 | |
2021 | $1,304 | $914 | $1,516 | $1,518 | $1,724 | $1,708 | $1,848 | ||
2022 | $1,444 | $1,432 | $1,650 | $1,669 | $1,796 | $1,746 | $1,940 | ||
2023 | $1,325 | $1,026 | $1,621 | $2,070 | $1,741 | $1,788 | $2,017 | $1,990 | $1,083 |
2024 | $1,594 | $1,226 | $1,494 | $1,964 | $1,728 | $1,802 | $1,529 | $2,001 | $1,069 |
Annualised | 2.51% | 4.04% | 2.48% | 4.65% | 2.75% | 2.51% | -1.56% | 1.40% |
It’s hard to see much of a pattern given the limited transaction volume, especially for older projects; so there isn’t much that we can conclude here.
But let’s turn to rental yields to see how that went. We’ll highlight the newer projects separately for easier comparison:
Project | Average price in 2024 | Average monthly rent (June 2024 – June 2025) | Rental yield |
CAMELOT BY-THE-WATER | $5,400,000 | $11,463 | 2.55% |
RIVEREDGE | $3,150,000 | $7,125 | 2.71% |
SILVERSEA | $5,864,000 | $13,545 | 2.77% |
COSTA RHU | $3,872,500 | $9,280 | 2.88% |
VILLA MARINA | $2,480,000 | $5,978 | 2.89% |
PEBBLE BAY | $5,030,000 | $12,931 | 3.08% |
SANCTUARY GREEN | $2,837,600 | $7,475 | 3.16% |
WATER PLACE | $2,385,000 | $7,089 | 3.57% |
(There weren’t any rental transactions for 4-bedders in Laguna Park)
There’s nothing too exceptional that we found here. The rental yields are expectedly lower than compact units, due to the higher cost of the property. It’s also uncommon for landlords to buy such large units as rental assets, as frankly one or two-bedders will suit such purposes better.
A further observation regarding freehold and leasehold status
When it comes to tenure, D15 shows a split performance, and the impact of freehold/leasehold is not entirely consistent.
At the district level, freehold properties are clearly the stronger driver (see above). At the project level, however, the picture becomes more nuanced. Among leasehold condos, the difference between newer and older projects has been negligible: newer projects (20 years old and below) grew at 3.22 per cent annualised, while older ones (above 20 years) managed 2.96 per cent. Lease decay has not yet shown up as a sharp drag within this 10-year window, suggesting that other factors, such as layout and facilities, play a more immediate role than age alone.
Breaking things down further by unit type also shows that tenure is not the sole deciding factor. For one-bedroom units, older leasehold projects actually outperformed newer ones on $PSF growth (although this may be partly due to unusually large one-bedder layouts in projects like Pebble Bay and Costa Rhu. Larger units tend to have a lower $PSF, allowing for more visible percentage gains in this area.)
By contrast, newer leasehold two- and three-bedroom units consistently pulled ahead, both in $PSF and in quantum.
Overall, freehold has appreciated better in D15 as a collective whole. But when you drill down, it’s not always clear if 99-year condos suffer more purely on account of being leasehold.
Due to that, buyers should focus on more decisive elements like layout efficiency, facilities, and state of upkeep.
Conclusion
Across all unit types, the price gap between new and old projects has widened over the past decade. Outside of the one-bedders, newer projects have also notched higher price growth compared to older ones.
That said, the broad averages may not match experiences on the ground. When you look at individual developments, some older condos still transact at prices comparable to newer ones; and growth trends show that older projects don’t always underperform. Transaction volumes for one- to three-bedders in these older projects also remain healthy, so there’s clearly ongoing demand.
(Four-bedders or larger see lower transaction volume, but that’s always been the case everywhere, due to higher pricing and lower supply in general.)
On the rental front, newer projects have generally delivered stronger yields, despite higher sale prices. This suggests that there is at least some preference for newer projects among tenants.
However, realtors have pointed out that this may be specific to a prime area like D15. In these areas, particularly the expat enclave in D15, well-heeled tenants with higher housing allowances can afford more luxury; and that includes newer facilities. In heartland areas with more budget-conscious tenants, we may not see the same advantages for newer units.
Finally, it’s one thing to know how averages play out across a district; it’s another to decide what this means for your own property goals. Should you be stretching for a newer project with higher yields, or is there an older condo that balances space and value better?
Our agents help buyers make these trade-offs every week, using both transaction data and on-the-ground experience.
If you’d like a clearer view of your options, let’s chat.
We’ll see if this is true in future deep dives in other districts, so follow us on Stacked Pro.
Ryan J
A seasoned content strategist with over 17 years in the real estate and financial journalism sectors, Ryan has built a reputation for transforming complex industry jargon into accessible knowledge. With a track record of writing and editing for leading financial platforms and publications, Ryan's expertise has been recognised across various media outlets. His role as a former content editor for 99.co and a co-host for CNA 938's Open House programme underscores his commitment to providing valuable insights into the property market.Read next from Property Investment Insights

Property Advice Condo Vs HDB Price Gap Analysis: Singapore Estates Where Resale HDBs Present A Clearer Value Case Than Condos

Property Investment Insights District 15 Resale vs New Launch Condos – Analysing Price Gaps for Larger Family Units

Property Investment Insights Are Singapore’s Suburban Condos Still Affordable? The Surprising Truth

Property Investment Insights New Launch vs Resale One and Two Bedders in D15: Here’s Where The Price Gaps Are The Biggest
Latest Posts

Property Market Commentary Why Land Price Is the Single Biggest Factor Behind New Launch Condo Pricing

Homeowner Stories I Waited for Property Prices to Drop — and Ended Up Paying More

Editor's Pick We Review 10 Of The October 2025 BTO Launch Sites – Which Is The Best Option For You?

Singapore Property News 5-Room Tampines HDB With Large Balcony Sold For A Record $1,068,000

Property Market Commentary 5 Property Hotspots In Singapore You Did Not Know Were Built Over Graveyards

Editor's Pick We Toured A Convenient Freehold Landed Estate In The East From $4.1 Million

Singapore Property News What Really Drives HDB Resale Prices (And Why COV Matters More Than You Think)

Editor's Pick Where Should Singaporeans Buy Property In France? A Full Guide For Young Investors

Editor's Pick How A Waterfront Development With 4,000 Homes Is Going To Reshape Singapore’s Property Market

On The Market 5 Rare HDB Flats Above 1,700 Sq Ft You Can Buy Right Now – From $850K

On The Market Rare 16,000 Sq ft Freehold Plot In D15 Hits The Market For $39M

Editor's Pick I Transformed My Two-Bedroom Unit Into A Dual-Key Layout – Here’s Why I Would Not Do It Again

Property Market Commentary Why More Families Are Choosing Two-Bedders Over Bigger Properties in 2025

Property Market Commentary What The URA Master Plan Reveals About Marina Bay’s Future (And How It Could Impact Property Values)

Editor's Pick We Toured An ‘Exclusive’ Freehold Landed Enclave In Singapore That Feels Close To Nature – And Even Has A Canal Running Through It
