


In this Stacked Pro breakdown:
Comparison
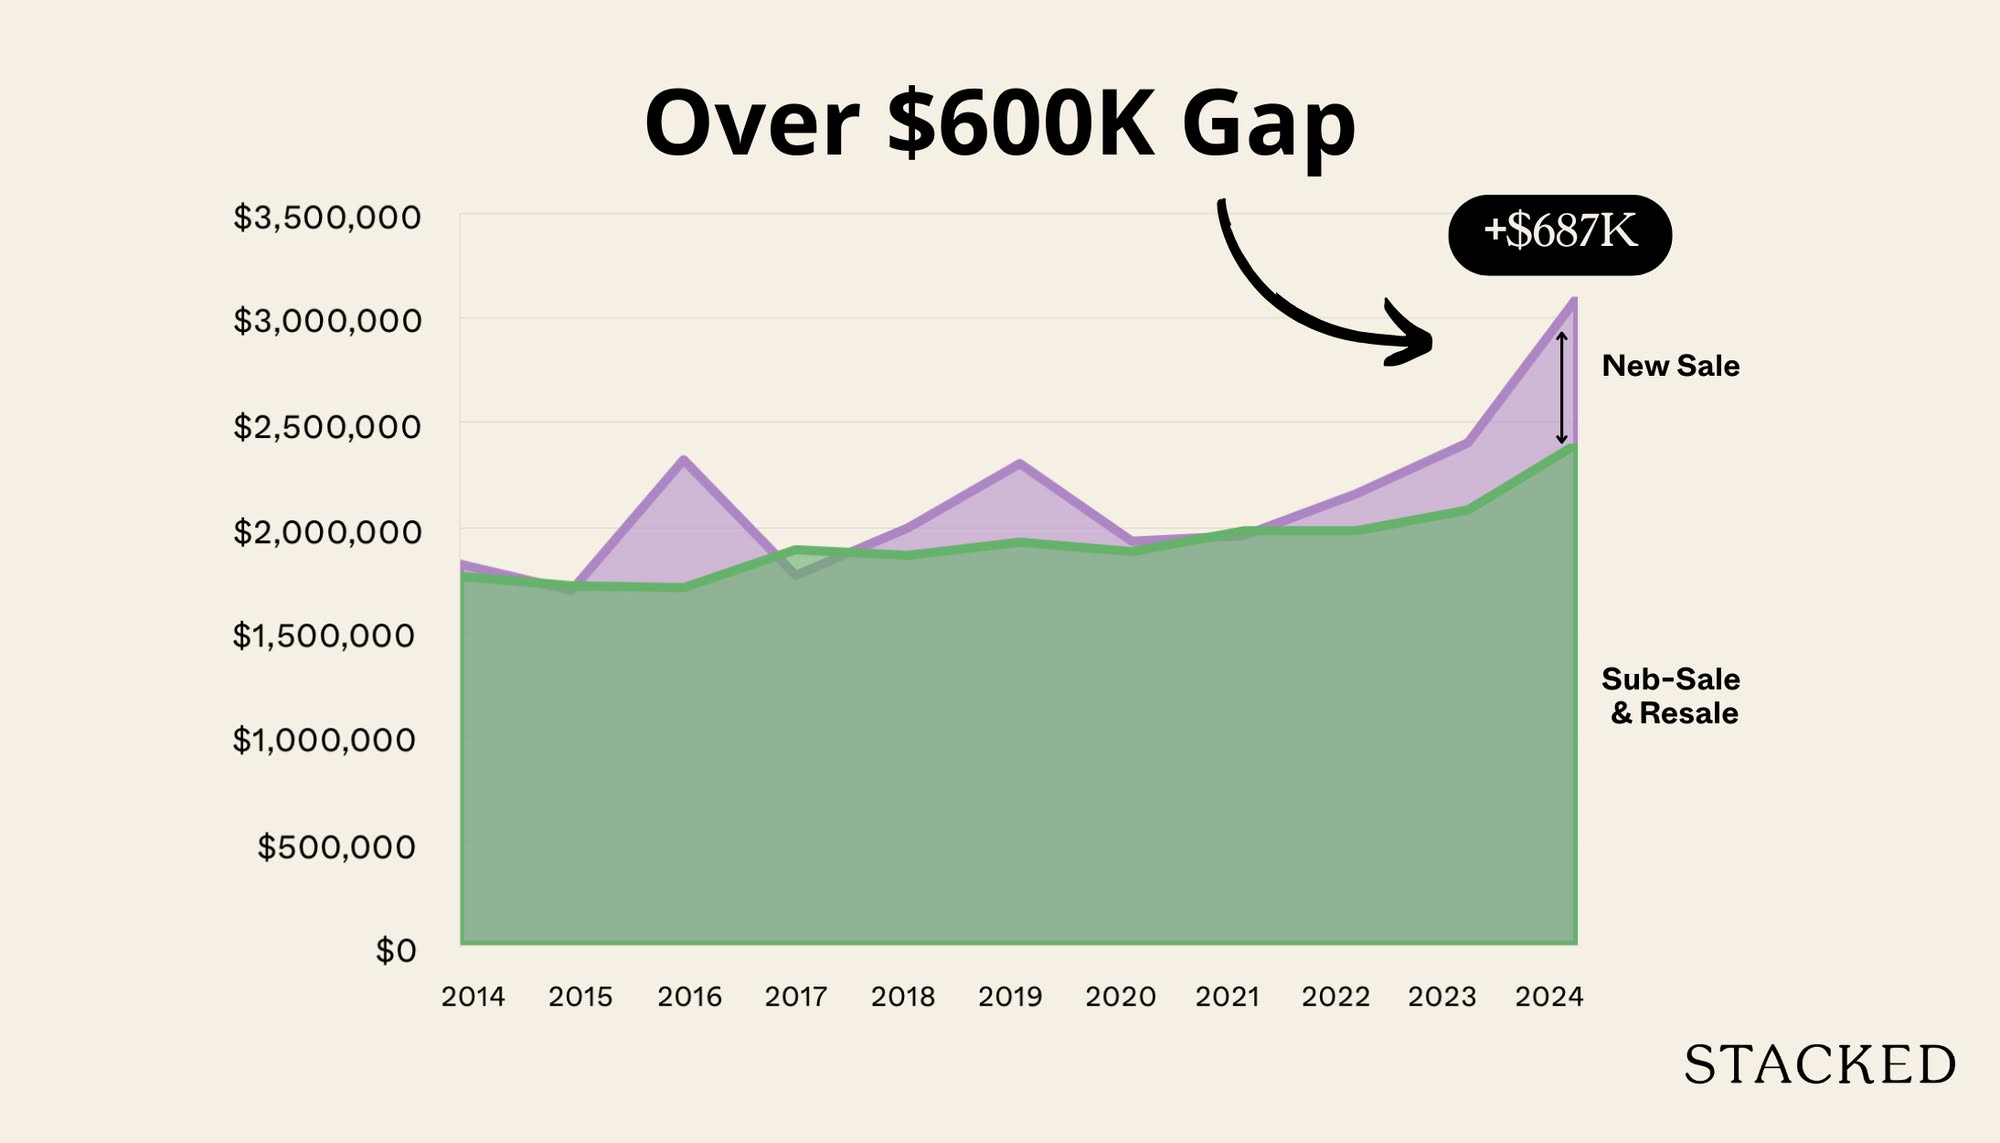
We analysed 10 years of price data (2014–2024) for two-bedroom condos in District 10, comparing new launch, sub sale, and resale transactions. Featured projects include 19 Nassim, Grange 1866, and Perfect Ten on the new launch front, versus resale standouts like D’Leedon, Spring Grove, and Dynasty Garden.
Key Insight
Join our Telegram group for instant notifications
Join Now
0 Comments