

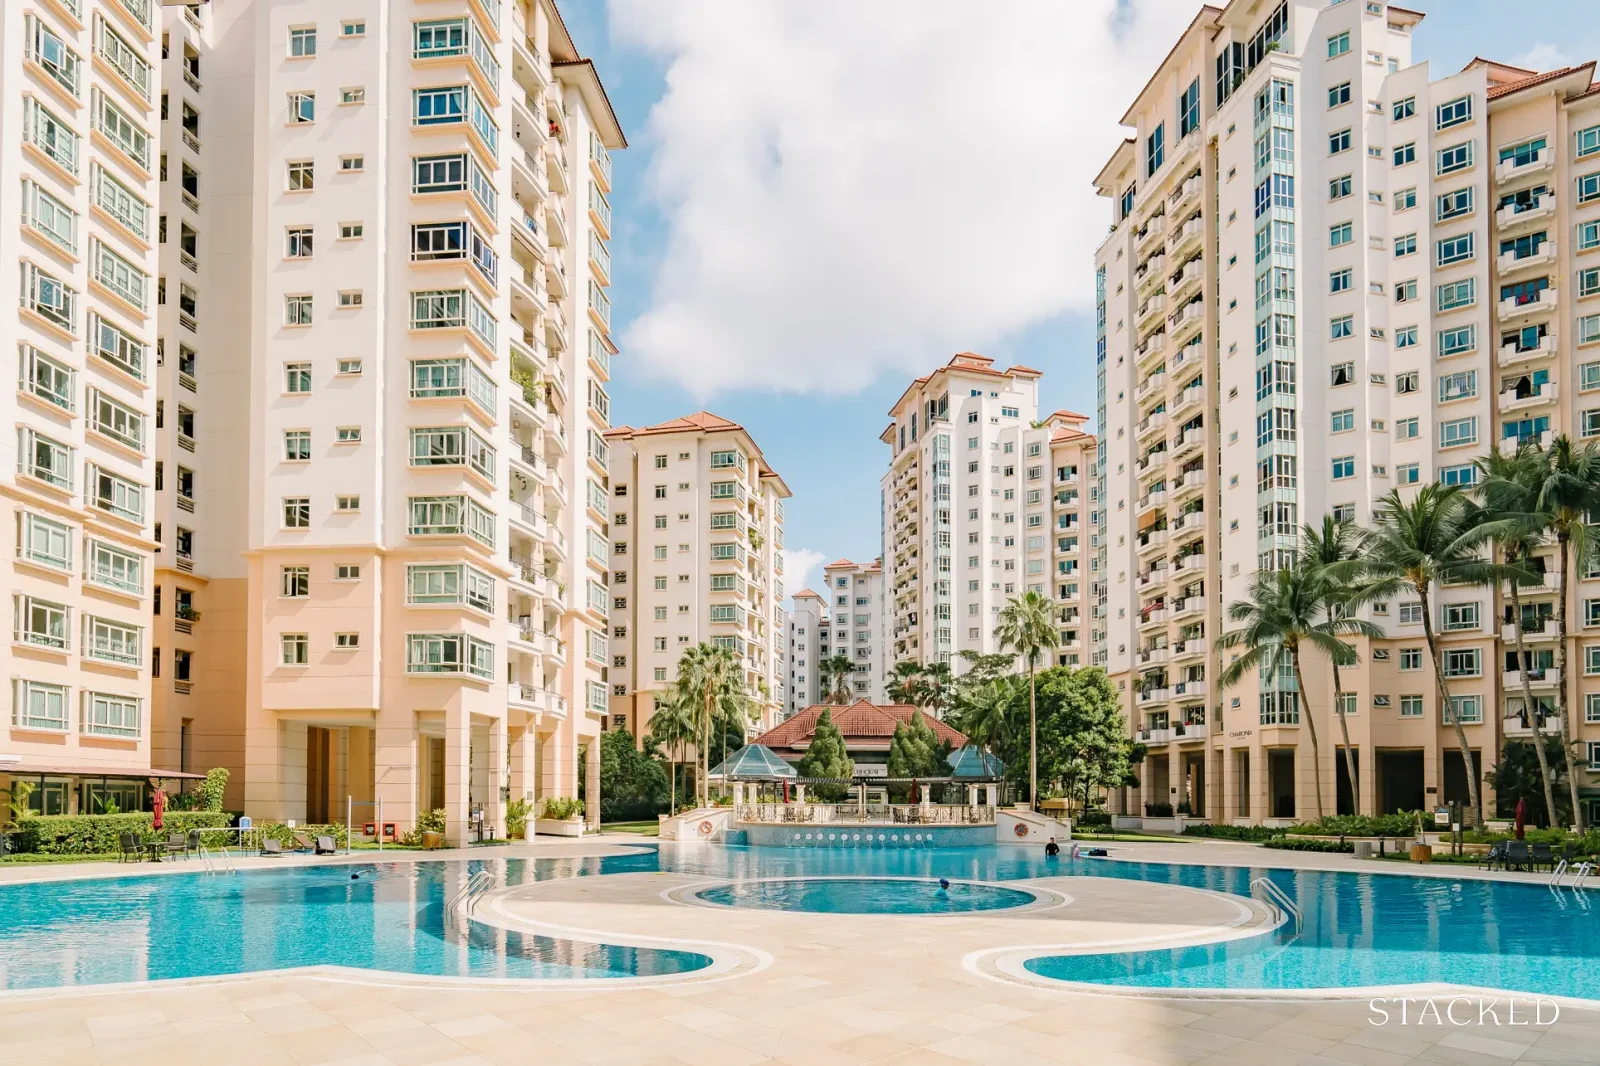
The perspective on leasehold condos has been changing in recent years. Homebuyers are a little less hung-up on freehold status; that’s thanks to the high freehold premium and the realisation that many condos go en-bloc long before it matters. But this doesn’t change the fact that leasehold condos do depreciate over time - and many buyers still want to know what they can expect. So we took a look at the performance of older leasehold condos over the years:
The challenge for many buyers today isn't access to information.
It's interpreting that information in a way that makes sense for their finances, goals, and stage of life.
Over time, that's also why we decided to work with agents who shared the same data-driven and advisory-led approach behind our editorial, consultants who could help readers think through decisions more objectively, rather than simply push transactions.
Today, the team has worked with more than 2,000 clients across over $5B in property transactions.
Looking at older leasehold condos
For the following, we looked only at condos with 99 to 103-year leases. This covers 355 condos, with 61,766 transactions.
First, let’s look at the average price per square foot of a leasehold condo, based on age:
| Years/Age | Less Than 10 Years Old | Less Than 20 Years Old | Less Than 30 Years Old | Less Than 40 Years Old | Over 40 Years Old | Grand Total |
| 2014 | $1,356 | $1,038 | $900 | $872 | $870 | $1,276 |
| 2015 | $1,344 | $1,033 | $911 | $828 | $908 | $1,222 |
| 2016 | $1,384 | $1,016 | $854 | $762 | $816 | $1,247 |
| 2017 | $1,438 | $1,019 | $897 | $805 | $875 | $1,272 |
| 2018 | $1,408 | $1,051 | $959 | $946 | $1,007 | $1,252 |
| 2019 | $1,416 | $1,059 | $971 | $976 | $1,078 | $1,242 |
| 2020 | $1,363 | $1,038 | $940 | $918 | $944 | $1,208 |
| 2021 | $1,365 | $1,101 | $1,019 | $987 | $1,043 | $1,251 |
| 2022 | $1,462 | $1,214 | $1,134 | $1,071 | $1,124 | $1,361 |
| 2023 | $1,583 | $1,342 | $1,232 | $1,175 | $1,230 | $1,465 |
| 2024 | $1,606 | $1,398 | $1,279 | $1,206 | $1,159 | $1,504 |
| Grand Total | $1,410 | $1,100 | $991 | $931 | $997 | $1,283 |
So those of you looking for a quantum of under $1.5 million (affordable to many HDB upgraders), do take note: you probably can get a 1,000 sq. ft. unit, if you’re okay with a resale condo in the 20+ year age range.
Now let’s look at percentage gains or losses in price psf, based on age
| Years/Age | Less Than 10 Years Old | Less Than 20 Years Old | Less Than 30 Years Old | Less Than 40 Years Old | Over 40 Years Old |
| 2014 | |||||
| 2015 | -0.9% | -0.4% | 1.3% | -5.0% | 4.4% |
| 2016 | 3.0% | -1.7% | -6.3% | -7.9% | -10.2% |
| 2017 | 3.9% | 0.2% | 5.0% | 5.7% | 7.2% |
| 2018 | -2.1% | 3.1% | 7.0% | 17.5% | 15.1% |
| 2019 | 0.6% | 0.8% | 1.3% | 3.1% | 7.0% |
| 2020 | -3.8% | -2.0% | -3.2% | -5.9% | -12.4% |
| 2021 | 0.1% | 6.1% | 8.4% | 7.6% | 10.5% |
| 2022 | 7.1% | 10.2% | 11.3% | 8.5% | 7.7% |
| 2023 | 8.3% | 10.5% | 8.6% | 9.6% | 9.5% |
| 2024 | 1.4% | 4.2% | 3.8% | 2.7% | -5.7% |
| Grand Total | 1.77% | 3.11% | 3.71% | 3.58% | 3.31% |
For the newest ones (10 years old or under), the gain is due to the shorter holding period. But we can see that older leasehold condos do continue to show gains, even after 20, 30, or 40 years and beyond.
Here’s a look at average profits based on age:
| Years/Age | Less Than 10 Years Old | Less Than 20 Years Old | Less Than 30 Years Old | Less Than 40 Years Old | Over 40 Years Old | Grand Total |
| 2014 | 14.5% | 8.9% | 13.0% | 18.0% | -0.5% | 13.6% |
| 2015 | 13.1% | 15.2% | 18.6% | 26.0% | 22.0% | 14.2% |
| 2016 | 15.7% | 18.6% | 21.9% | 31.5% | 23.6% | 16.9% |
| 2017 | 13.9% | 22.4% | 23.8% | 29.8% | 17.8% | 16.9% |
| 2018 | 13.1% | 20.1% | 22.6% | 18.9% | 26.7% | 15.8% |
| 2019 | 19.1% | 27.4% | 27.9% | 20.4% | 24.5% | 22.0% |
| 2020 | 23.9% | 34.7% | 30.7% | 37.5% | 27.5% | |
| 2021 | 21.4% | 30.4% | 33.5% | 19.9% | 25.0% | |
| 2022 | 8.5% | 37.8% | 3.5% | 15.6% | ||
| 2023 | -0.4% | -0.4% | ||||
| Grand Total | 14.8% | 18.8% | 21.4% | 25.5% | 18.2% | 16.3% |
The gains do get noticeably weaker once a project is past 40 years, and one possible reason is the financing issues:
Once a project has 60 years or less remaining, banks often lower the maximum loan quantum (e.g., buyers may only be able to borrow up to 55 per cent of the value, instead of the usual norm of 75 per cent). This means a higher cash outlay for the oldest condos, which can pull prices down.
Another point of note is that 40+ year-old condos are quite rare - most projects tend to go en-bloc before that stage. As such, there’s also a much lower volume of transactions for these units.
Next, we take a look at how location plays a role. Here’s the performance by district:
| Years/District | D1 | D2 | D3 | D4 | D5 | D9 | D10 | D11 | D14 | D15 | D16 | D17 | D18 | D19 | D20 | D21 | D22 | D23 | D26 | D27 |
| 2014 | 25.0% | 33.8% | 16.2% | -2.6% | 17.8% | -3.9% | 0.0% | 15.2% | 12.1% | 28.4% | 1.4% | -9.5% | 36.3% | 27.9% | 19.5% | 9.9% | 23.0% | 9.0% | ||
| 2015 | 23.7% | 24.8% | 26.7% | 6.8% | 20.1% | 23.5% | 4.6% | 24.7% | 18.0% | 21.5% | 12.5% | 42.0% | 21.8% | 19.7% | 27.1% | 11.9% | 21.8% | 6.9% | ||
| 2016 | 12.1% | 24.4% | 18.3% | 44.1% | 14.5% | 39.2% | 31.0% | 25.4% | 29.0% | 15.9% | 19.8% | 12.6% | 62.2% | 30.7% | 32.0% | 17.7% | 6.3% | 17.6% | ||
| 2017 | 4.0% | 19.3% | 18.9% | 26.9% | 28.7% | 18.5% | 30.0% | 29.7% | 33.1% | 17.9% | 35.6% | 30.2% | 29.1% | 27.3% | 26.0% | 26.6% | 12.0% | |||
| 2018 | 19.0% | 16.9% | 24.2% | 15.0% | 18.2% | 21.8% | 37.8% | 14.4% | 18.0% | 20.6% | 38.9% | 29.6% | 18.0% | 33.3% | 18.6% | |||||
| 2019 | 14.4% | 19.8% | 24.2% | 1.7% | 24.1% | 20.8% | 24.6% | 26.7% | 21.2% | 63.2% | 17.5% | 13.2% | 16.6% | 34.8% | 46.4% | 26.2% | ||||
| 2020 | 48.0% | 26.4% | 24.3% | 44.6% | 33.6% | 37.7% | 45.4% | 29.0% | 36.6% | 26.1% | 41.6% | |||||||||
| 2021 | 25.7% | 24.3% | 34.0% | 28.3% | 50.6% | |||||||||||||||
| 2022 | 1.2% | 5.8% | ||||||||||||||||||
| Grand Total | 36.5% | 14.9% | 22.4% | 26.7% | 18.0% | 10.1% | 20.6% | 23.1% | 17.1% | 23.3% | 25.8% | 29.6% | 14.2% | 29.3% | 29.8% | 27.2% | 25.5% | 18.6% | 28.9% | 15.1% |
Unfortunately, not much is revealed as districts are not like HDB towns. They are quite wide-ranging, which makes it hard to generalise factors - and the distribution of condos across districts is much less even, with some districts having low transaction volumes.
As an example, here are the transaction volumes:
| Years/District | D1 | D2 | D3 | D4 | D5 | D9 | D10 | D11 | D14 | D15 | D16 | D17 | D18 | D19 | D20 | D21 | D22 | D23 | D26 | D27 |
| 2014 | 1 | 1 | 7 | 2 | 2 | 3 | 1 | 15 | 9 | 4 | 12 | 2 | 5 | 7 | 12 | 9 | 4 | 5 | ||
| 2015 | 2 | 4 | 1 | 4 | 6 | 1 | 1 | 16 | 15 | 1 | 7 | 6 | 4 | 7 | 5 | 5 | 6 | 4 | ||
| 2016 | 1 | 4 | 8 | 1 | 3 | 2 | 2 | 19 | 20 | 1 | 8 | 3 | 1 | 5 | 7 | 13 | 2 | 4 | ||
| 2017 | 3 | 5 | 11 | 4 | 7 | 10 | 25 | 37 | 5 | 14 | 2 | 5 | 9 | 11 | 10 | 5 | 4 | |||
| 2018 | 5 | 1 | 2 | 6 | 16 | 18 | 1 | 4 | 1 | 2 | 4 | 2 | 10 | 7 | 5 | |||||
| 2019 | 2 | 1 | 5 | 1 | 6 | 6 | 11 | 1 | 4 | 1 | 1 | 1 | 2 | 3 | 4 | 2 | ||||
| 2020 | 1 | 1 | 7 | 6 | 1 | 1 | 1 | 4 | 1 | 1 | 1 | |||||||||
| 2021 | 1 | 2 | 1 | 1 | 1 | |||||||||||||||
| 2022 | 1 | 1 | ||||||||||||||||||
| Grand Total | 2 | 9 | 14 | 1 | 41 | 4 | 17 | 21 | 20 | 107 | 117 | 14 | 51 | 16 | 22 | 34 | 40 | 51 | 29 | 25 |
Nonetheless, we can see some interesting quirks. A significant portion of condos 30+ years old (224 of 635 transactions) come from Districts 15 and 16, which are the areas of Marine Parade and Bedok (including the stretch of Upper East Coast).
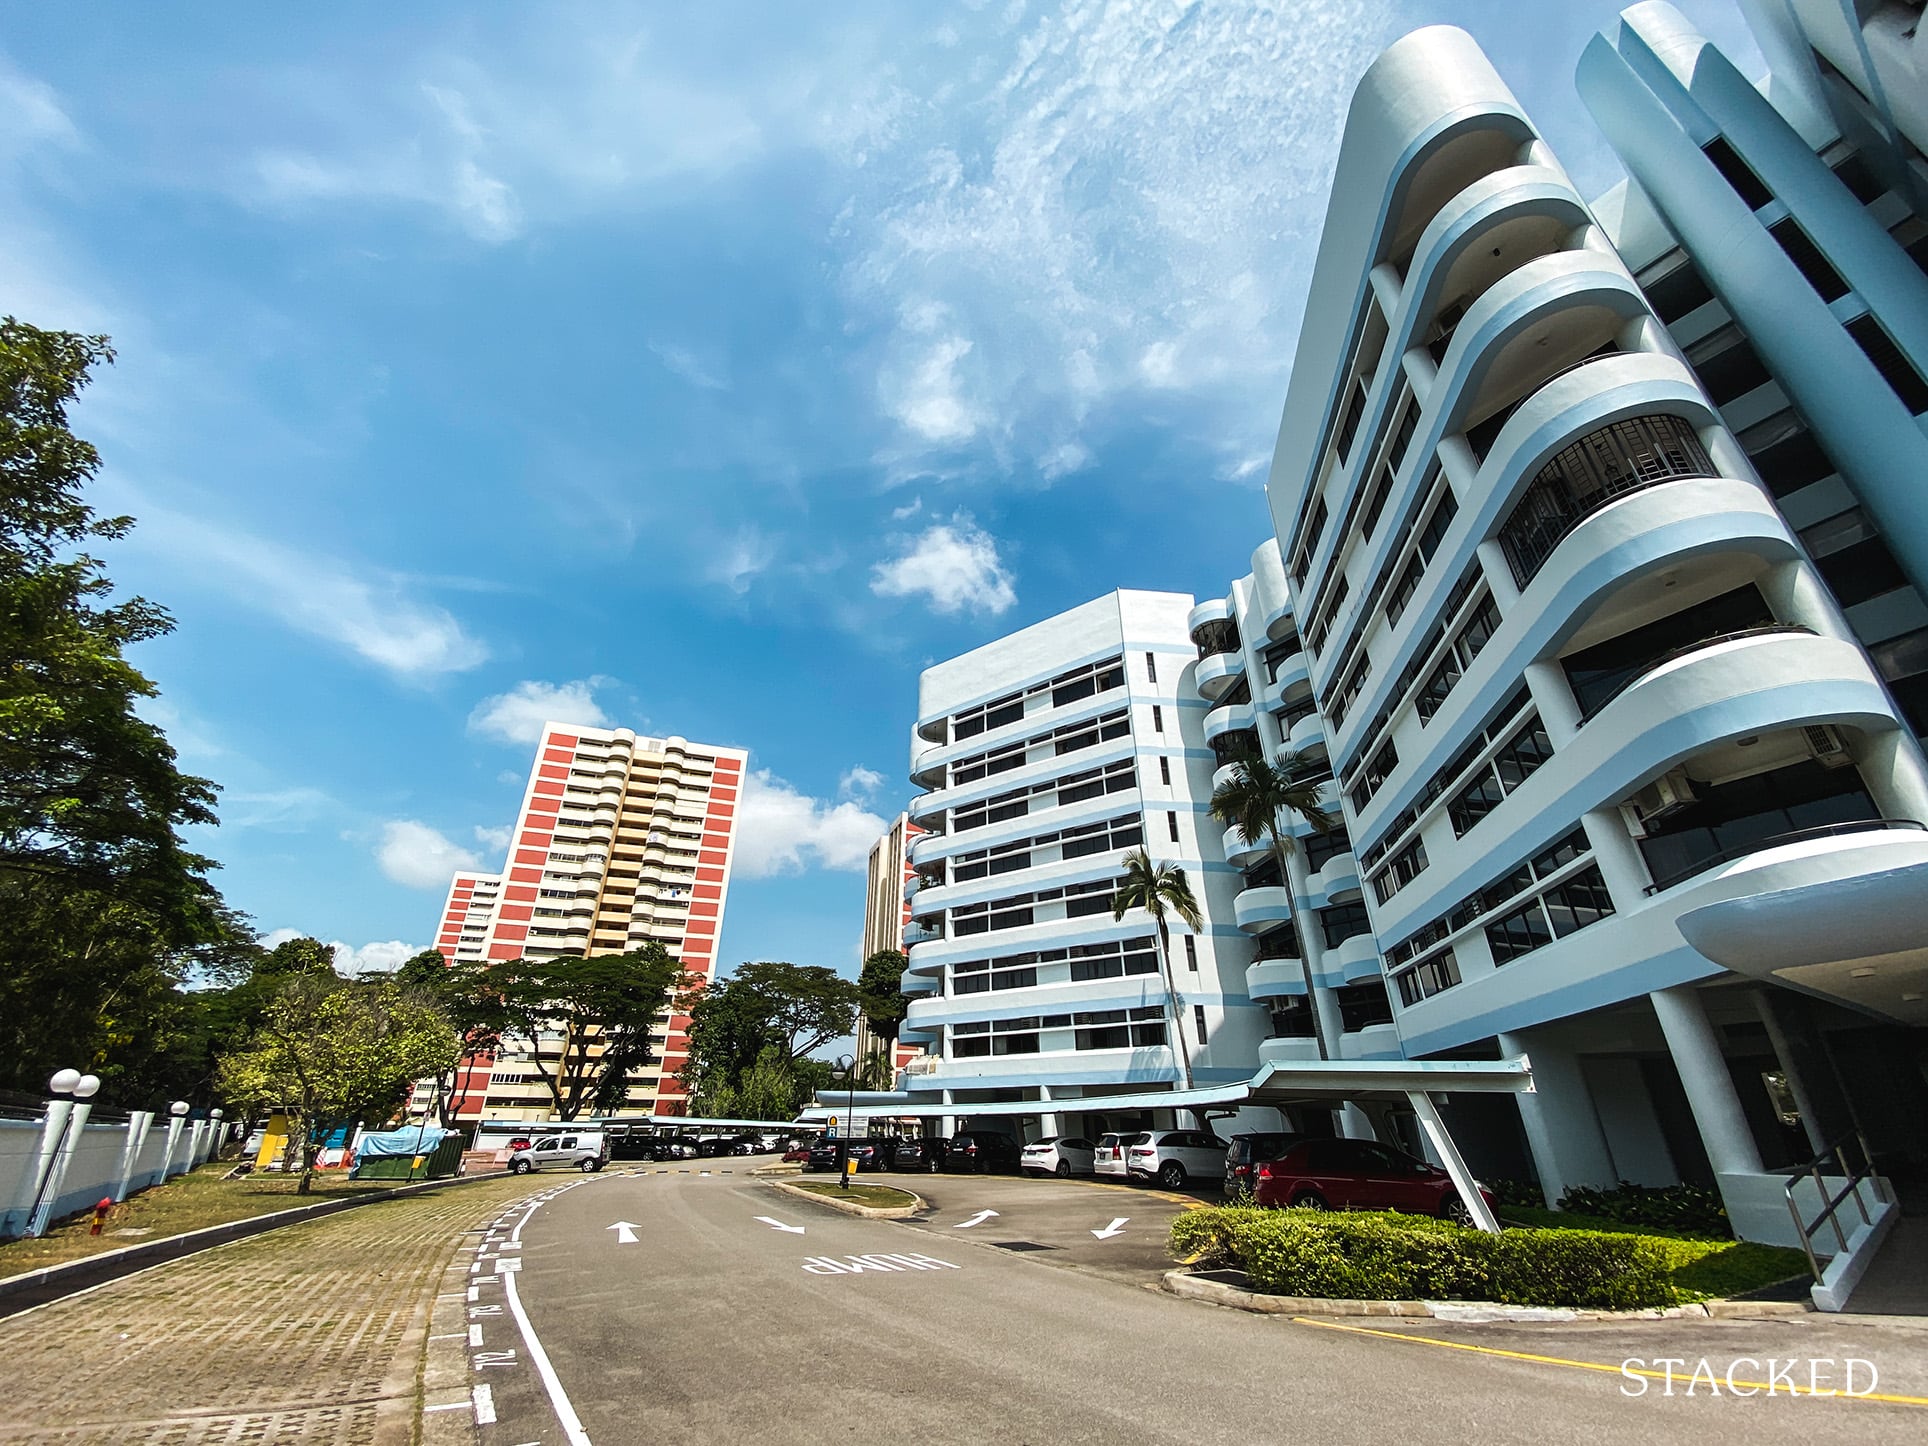
There is a higher concentration of older properties here, with about a third of them being in the 30+ age range. The locations here also seem to see better performance, but it’s unclear if this is related to the age issue - it may also be down to the individual quirks of the condos here.
We can also conclude that, even in districts with low transaction volumes, the relative performance of older leasehold condos is still decent.
Contrary to common fears, leasehold condos don’t start plummeting in value as soon as they reach 20+ or even 40+ years old.
This could be due to us having never actually seen a condo reach the end of its lease. We’ve only seen residential properties reach the end of their lease once so far, and those were not condo developments.
There seems to be a general assumption that an en-bloc will happen before that, thus providing an exit plan for even the oldest leasehold condos. It’s a bold assumption, but it’s one that hasn’t been proven wrong so far.
It’s certainly an issue to think about in 2024, when new launch prices are still high, and freehold status could add a premium of over 15 per cent on top of that.
At Stacked, we like to look beyond the headlines and surface-level numbers, and focus on how things play out in the real world.
If you'd like to discuss how this applies to your own circumstances, you can reach out for a one-to-one consultation here.
And if you simply have a question or want to share a thought, feel free to write to us at stories@stackedhomes.com. We read every message.





0 Comments