

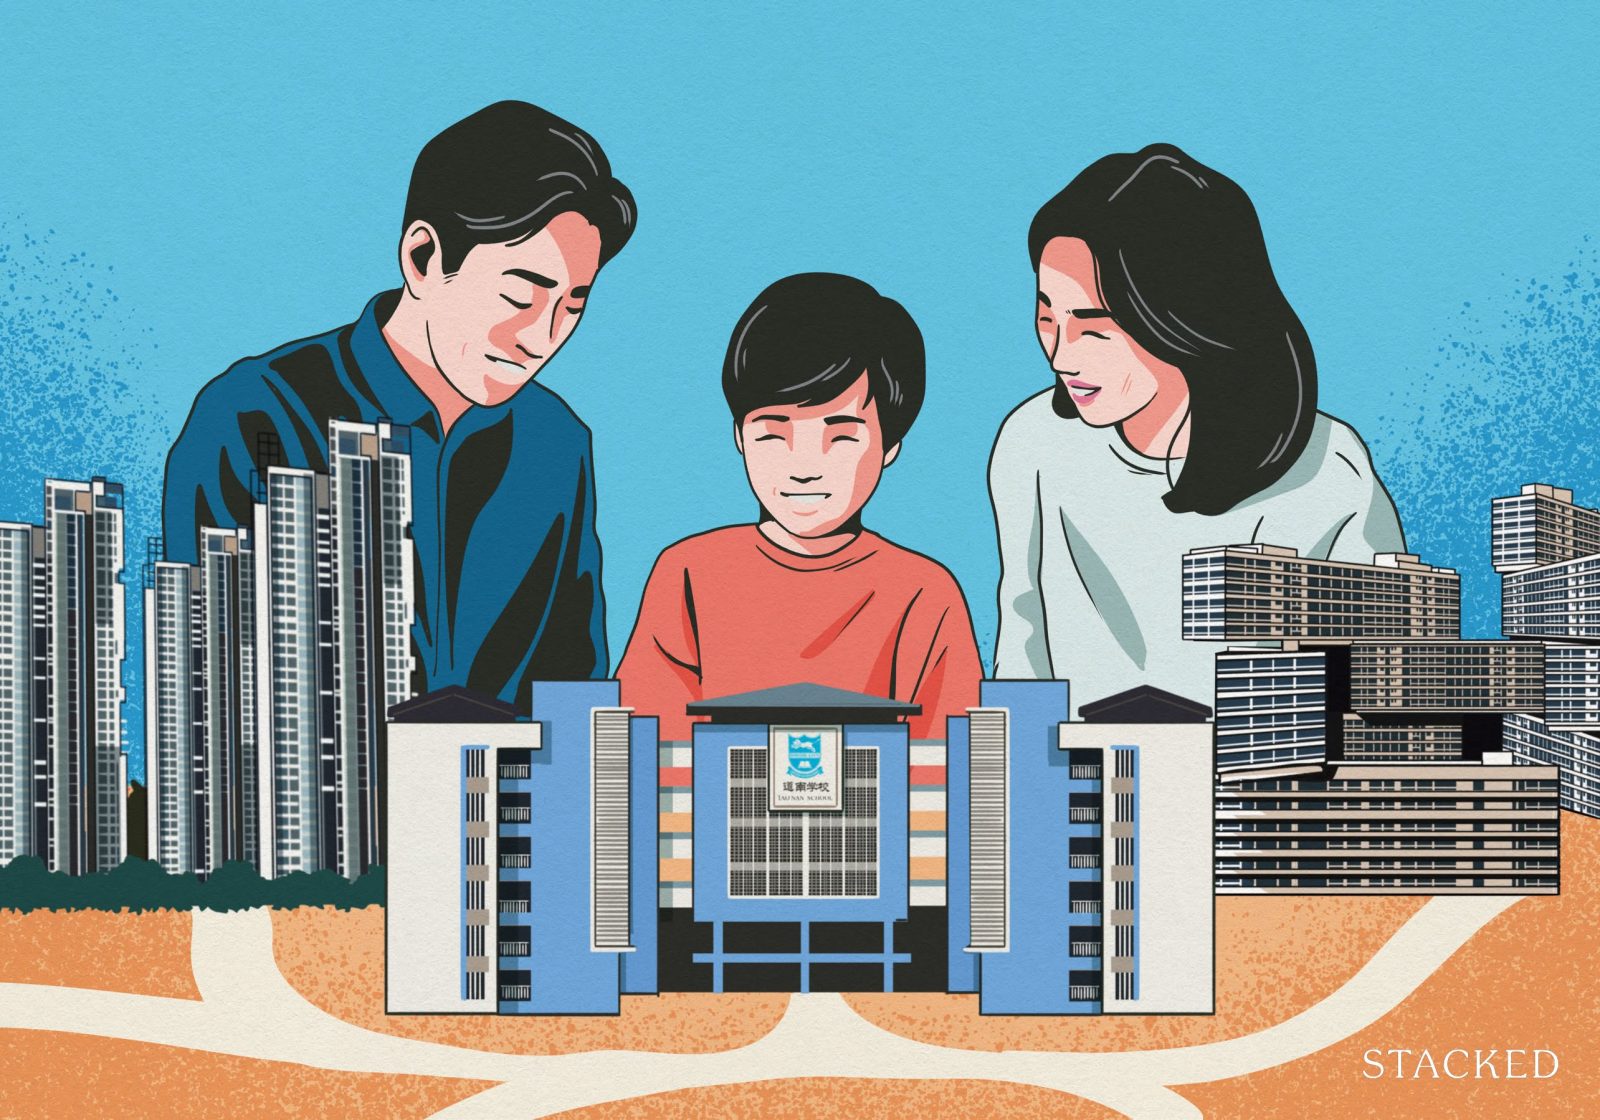
Our children’s education needs to hinge less on postal codes and property ownership.
That’s the issue that comes to mind, when I think about desperate parents faking addresses to be near certain schools. This happened very recently, with a lady lying about her home address for her daughter’s Primary 1 enrolment. If convicted, she faces up to two years in jail, or a fine, or both. Her child will likely be transferred to another school.
This isn’t the first time it’s happened. I recall in 2018, a single mother was fined $5,000 over the same offence. There was also a father who was caught, a Bishan couple whose fine hit $9,000, and a few others.
The government has made a pretty clear statement: rules are rules, and this one helps ensure fairness. But if we’re honest with ourselves, this isn’t just about fairness. There’s a sensitive element of property ownership and privilege tied up in it.
The challenge for many buyers today isn't access to information.
It's interpreting that information in a way that makes sense for their finances, goals, and stage of life.
Over time, that's also why we decided to work with agents who shared the same data-driven and advisory-led approach behind our editorial, consultants who could help readers think through decisions more objectively, rather than simply push transactions.
Today, the team has worked with more than 2,000 clients across over $5B in property transactions.
What’s the price of proximity?
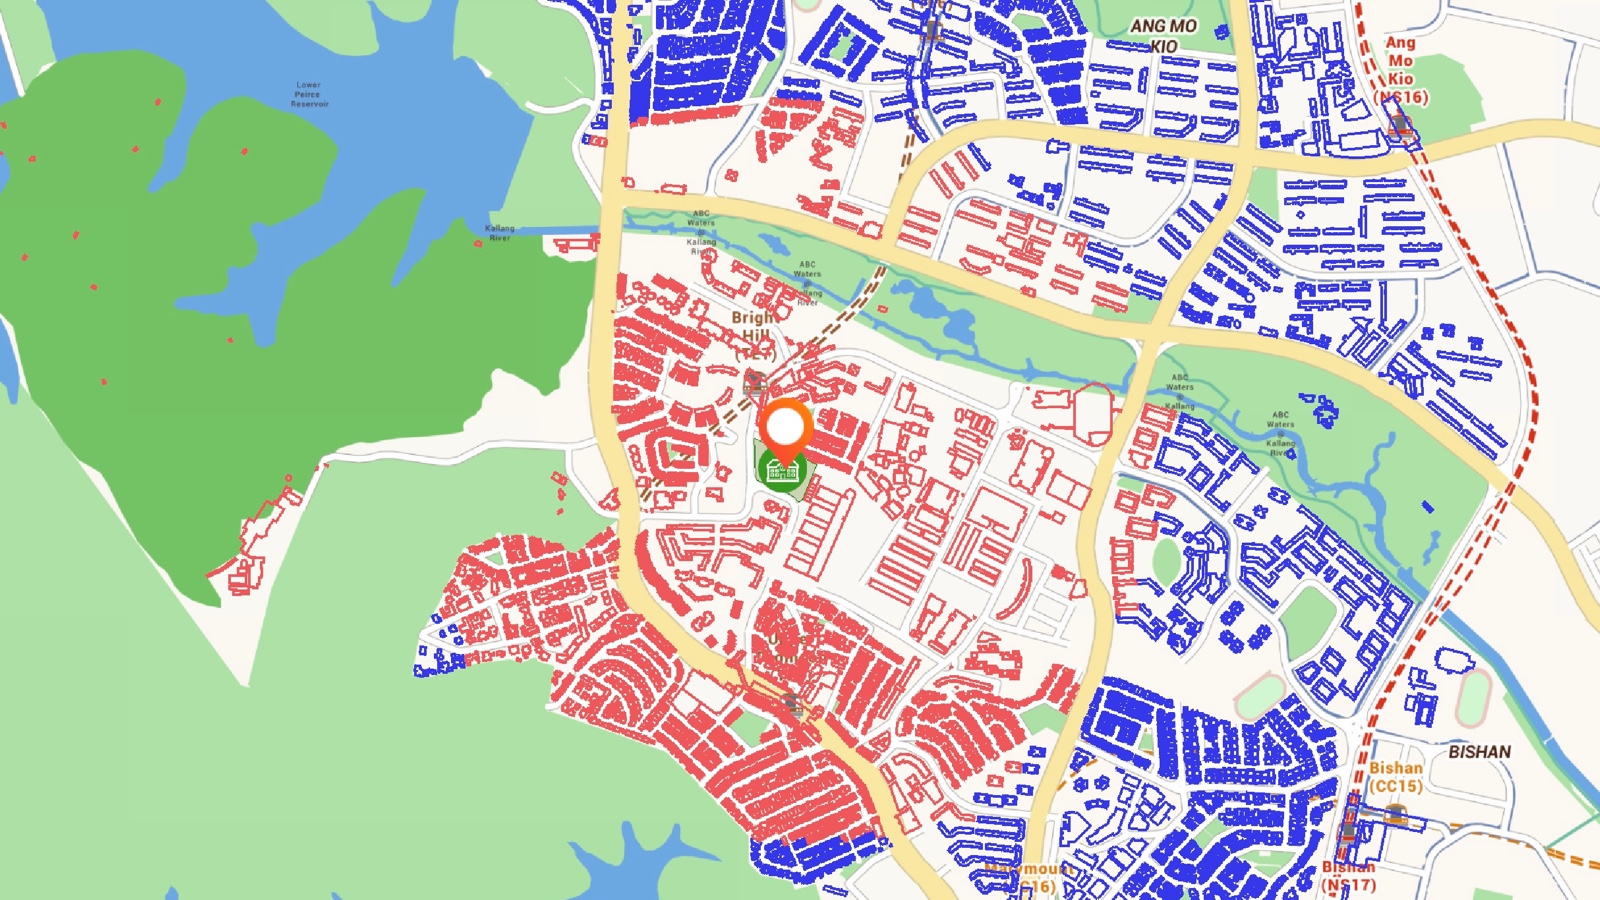
In Singapore, the proximity rule for Primary 1 registration is well known: children living within 1km of a school get priority, followed by those within 2km. This was meant to ensure community ties and reduce travel time, but over time, it’s become something else by accident: a sort of “wealth filter” that confers possible educational advantage based on real estate ownership.
It’s an unspoken truth that, most of the time, living near a “top” school costs money. A lot of it. Properties within 1km of elite schools like Nanyang Primary, Henry Park, or Ai Tong often command a hefty price premium; and that’s the fundamental tension:
Children who attend elite schools may gain access not only to possibly better academic outcomes, but also to stronger networks, greater opportunities, and a smoother path to prestigious secondary schools and beyond.
These advantages accumulate and with them, wealth and status. Parents who are already of means secure a place for their children, who then go on to repeat the cycle. In this way, a school system anchored by proximity-based admissions gives an advantage to those who already tend to be advantaged: a classic rich-getting-richer situation.
Perhaps it’s time we took a page from our successful HDB system
In our public housing system, we deliberately mix income groups, ethnic backgrounds, and family types to foster social cohesion. In the BTO model, for example, flats in mature estates are set aside for lower-income buyers and young couples, not just the affluent. We don’t let high-value estates become entrenched enclaves of wealth.
So why do we allow it for schools? If we believe in mixing communities through housing, we should be more open to mixing students through school admissions too. Perhaps we could use a more varied approach: we might limit the percentage of slots allocated purely by distance - say 70 to 80 per cent - and reserve the remainder for students who live further away, who are from lower-income situations, etc (with the caveat that it may mean longer travel distances, should their families accept it.)
We’re already one of the countries that leads the world in integrating housing across income and ethnicity; we did it because we decided that social harmony requires deliberate design. Perhaps it’s time we applied the same deliberation to Home-School Distance.
This will be on the 25th of June. This draft, which will include land plans for the next 10 to 15 years, will feature a few notable changes:
- More homes in the Central Region, in particular Bukit Timah (the former Turf City area), Mount Pleasant, Marina South, and the redevelopment areas around the former Keppel Golf Course.
- New hub areas, with Jurong Lake District to be the “largest mixed-use district” outside the CBD.
- Further development of hubs like Changi Aviation Park, Changi City, and Punggol Digital District.
Along with this, there’s going to be news regarding the Long Island Project, likely to be viewed with grumpy comments, by those who have condos overlooking East Coast Beach. This seaview-blocking monstrosity is sadly necessary, to stop our east-side properties resembling that underwater city in Aquaman.
We’ll update you with more details as they become available.
Meanwhile in other property news…
- Freehold three-bedder units for $2 million or under? They can still be found, and here are some examples.
- A sudden switch from HDB, to buying a $1.23 million, two-bedder unit at Parc Vista. Check out this homebuyer’s rationale.
- On Stacked Pro, we’re looking at how older leasehold condos perform as they age, versus newer ones - and a great case study is The Tanamera.
- I went looking for homes in Mexico City, one of my favourite haunts - and found freehold homes for $400 to $600 psf even in prime areas.
Weekly Sales Roundup (26 May - 01 June)
Top 5 Most Expensive New Sales (By Project)
| PROJECT NAME | PRICE S$ | AREA (SQFT) | $PSF | TENURE |
| 21 ANDERSON | $9,500,000 | 3197 | $2,972 | FH |
| PINETREE HILL | $4,723,000 | 1733 | $2,725 | 99 yrs (2022) |
| TEMBUSU GRAND | $4,160,000 | 1711 | $2,431 | 99 yrs (2022) |
| NAVA GROVE | $3,881,100 | 1550 | $2,504 | 99 yrs (2024) |
| GRAND DUNMAN | $3,604,000 | 1518 | $2,375 | 99 yrs (2022) |
Top 5 Cheapest New Sales (By Project)
| PROJECT NAME | PRICE S$ | AREA (SQFT) | $PSF | TENURE |
| ONE MARINA GARDENS | $1,223,901 | 420 | $2,915 | 99 yrs (2023) |
| PARKTOWN RESIDENCE | $1,225,000 | 506 | $2,421 | 99 yrs (2023) |
| NOVO PLACE | $1,388,000 | 872 | $1,592 | 99 yrs (2023) |
| HILL HOUSE | $1,399,000 | 431 | $3,249 | 999 yrs |
| LUMINA GRAND | $1,417,000 | 936 | $1,513 | 99 yrs (2022) |
Top 5 Most Expensive Resale
| PROJECT NAME | PRICE S$ | AREA (SQFT) | $PSF | TENURE |
| REGENCY PARK | $7,150,000 | 3175 | $2,252 | FH |
| BOULEVARD 88 | $5,124,300 | 1313 | $3,902 | FH |
| SUI GENERIS | $5,100,000 | 2131 | $2,393 | FH |
| THE TRESOR | $5,050,000 | 1927 | $2,621 | 999 yrs (1875) |
| THE TRIZON | $4,800,000 | 2185 | $2,197 | FH |
Top 5 Cheapest Resale
| PROJECT NAME | PRICE S$ | AREA (SQFT) | $PSF | TENURE |
| STRATUM | $660,000 | 452 | $1,460 | 99 yrs (2012) |
| IDYLLIC SUITES | $720,000 | 441 | $1,631 | FH |
| DOUBLE BAY RESIDENCES | $735,000 | 538 | $1,366 | 99 yrs (2008) |
| THE TAPESTRY | $800,000 | 474 | $1,689 | 99 yrs (2017) |
| BAYSHORE PARK | $808,000 | 624 | $1,294 | 99 yrs (1982) |
Top 5 Biggest Winners
| PROJECT NAME | PRICE S$ | AREA (SQFT) | $PSF | RETURNS | HOLDING PERIOD |
| UE SQUARE | $3,460,000 | 1561 | $2,217 | $2,130,000 | 25 Years |
| REGENCY PARK | $7,150,000 | 3175 | $2,252 | $2,080,000 | 8 Years |
| THE ANCHORAGE | $2,930,000 | 1464 | $2,001 | $1,930,000 | 23 Years |
| MAPLE WOODS | $2,950,000 | 1378 | $2,141 | $1,832,000 | 25 Years |
| THE PETALS | $2,410,000 | 1636 | $1,473 | $1,560,000 | 19 Years |
Top 5 Biggest Losers
| PROJECT NAME | PRICE S$ | AREA (SQFT) | $PSF | RETURNS | HOLDING PERIOD |
| THE COAST AT SENTOSA COVE | $3,250,000 | 2357 | $1,379 | -$430,010 | 18 Years |
| UP@ROBERTSON QUAY | $1,176,000 | 570 | $2,061 | -$172,000 | 12 Years |
| THE OCEANFRONT @ SENTOSA COVE | $2,680,000 | 1679 | $1,596 | -$107,140 | 18 Years |
| HILL HOUSE | $1,399,000 | 431 | $3,249 | $0 | 2 Months |
| AURELLE OF TAMPINES | $1,482,000 | 872 | $1,700 | $0 | 2 Months |
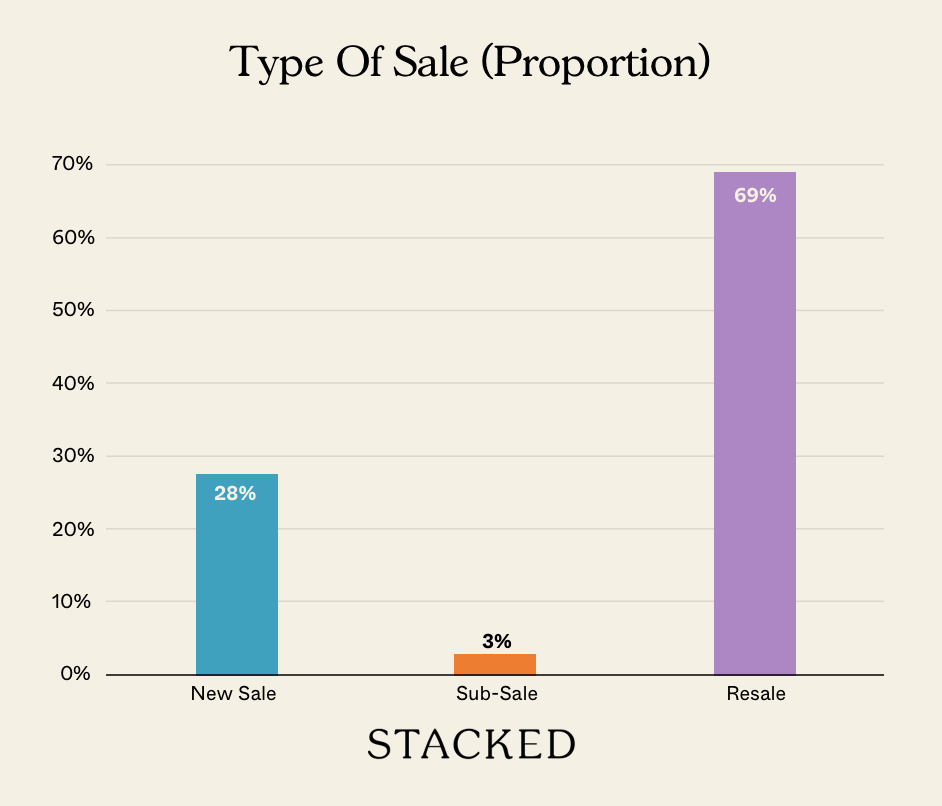
Transaction Breakdown
For more on the Singapore property market, follow us on Stacked.
At Stacked, we like to look beyond the headlines and surface-level numbers, and focus on how things play out in the real world.
If you'd like to discuss how this applies to your own circumstances, you can reach out for a one-to-one consultation here.
And if you simply have a question or want to share a thought, feel free to write to us at stories@stackedhomes.com. We read every message.





0 Comments