

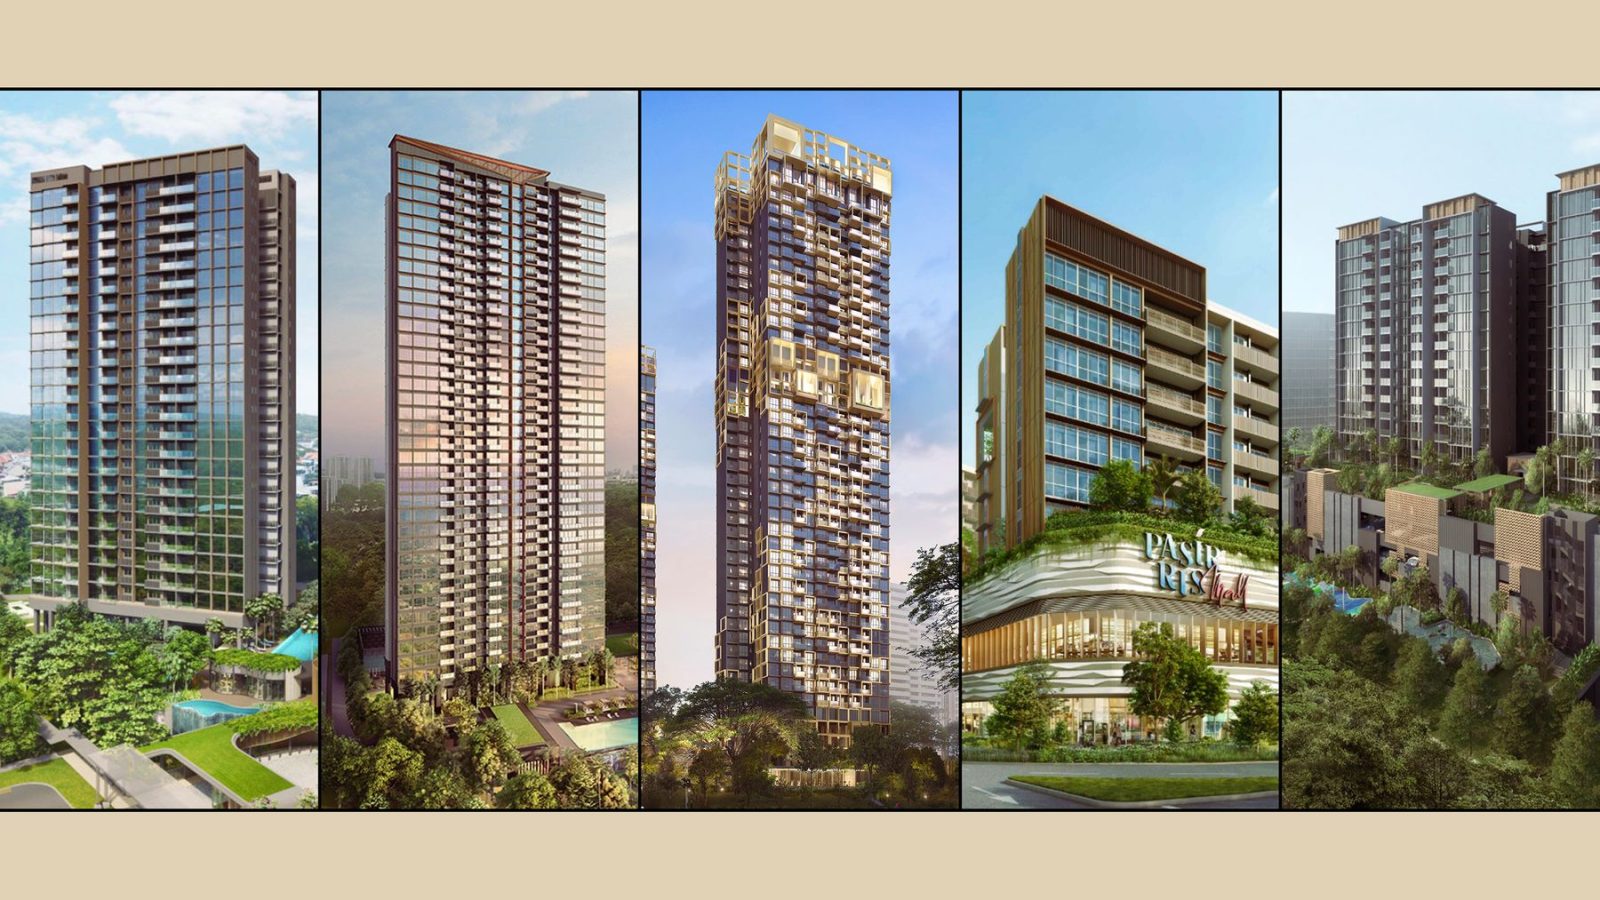
It’s said that, thanks to COVID, we’ve seen more market disruption in the past five years than in the past two decades. We don’t know how true that is for other asset classes, but we’ve certainly seen big disruptions to the property market. Certain “facts” that we once took for granted - such as two-bedders not being for own-stay use, or the CCR being for affluent foreigners - have all been turned on their head. In light of that, how have recently completed condos been affected, as the market around them pivoted? Let’s take a look at their performance to date:
The challenge for many buyers today isn't access to information.
It's interpreting that information in a way that makes sense for their finances, goals, and stage of life.
Over time, that's also why we decided to work with agents who shared the same data-driven and advisory-led approach behind our editorial, consultants who could help readers think through decisions more objectively, rather than simply push transactions.
Today, the team has worked with more than 2,000 clients across over $5B in property transactions.
1. Clavon
Clavon is a leasehold, District 5 project with 640 units, completed in 2024. You can see the full review here.
This is Clavon’s overall price movement since its launch date:
| Year | Clavon average $PSF | D5 average $PSF (only sub sale and resale tnx) |
| 2020 | $1,646 | $1,215 |
| 2021 | $1,637 | $1,348 |
| 2022 | $1,696 | $1,468 |
| 2023 | $1,904 | $1,637 |
| 2024 | $2,031 | $1,779 |
| 2025 (Up till June 2025) | $2,063 | $1,816 |
| Annualised | 4.62% | 8.37% |
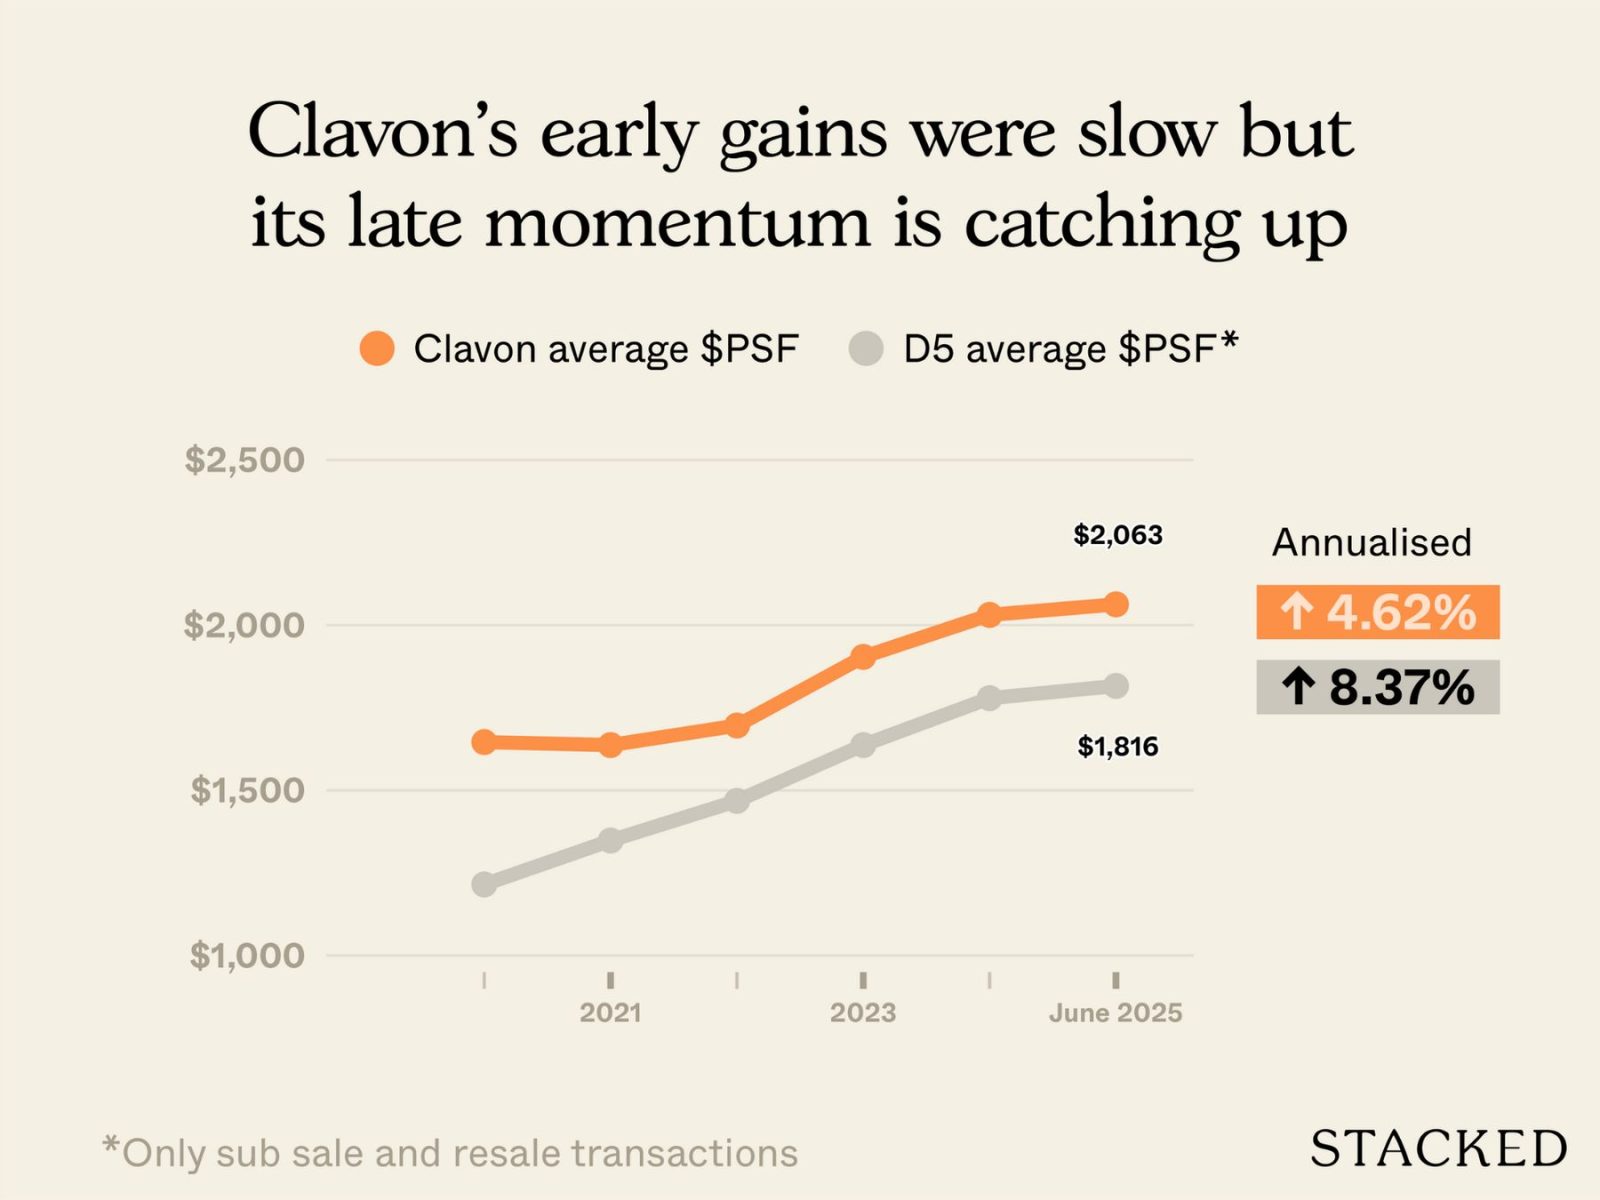
Clavon’s annualised gain of about 4.6 per cent trails the wider District 5 average (8.4 per cent). However, Clavon has shown strong upward momentum more recently.
From 2020 to about 2023, Clavon’s price increases were relatively modest compared to the D5 average, but from 2023 onward, you see a steeper climb in its average $PSF.
Let’s take a look based on unit sizes to see what we can find:
| Year | 1-bedroom | 2-bedroom | 3-bedroom | 4-bedroom | 5-bedroom |
| 2020 | $1,694 | $1,654 | $1,610 | $1,570 | $1,575 |
| 2021 | $1,732 | $1,807 | $1,688 | $1,599 | $1,589 |
| 2022 | $1,727 | $1,679 | |||
| 2023 | $1,904 | ||||
| 2024 | $1,999 | $1,986 | $2,114 | $2,050 | |
| 2025 (Up till June 2025) | $2,014 | $2,043 | $2,148 | $2,126 | |
| Annualised | 3.52% | 4.31% | 5.94% | 6.25% |
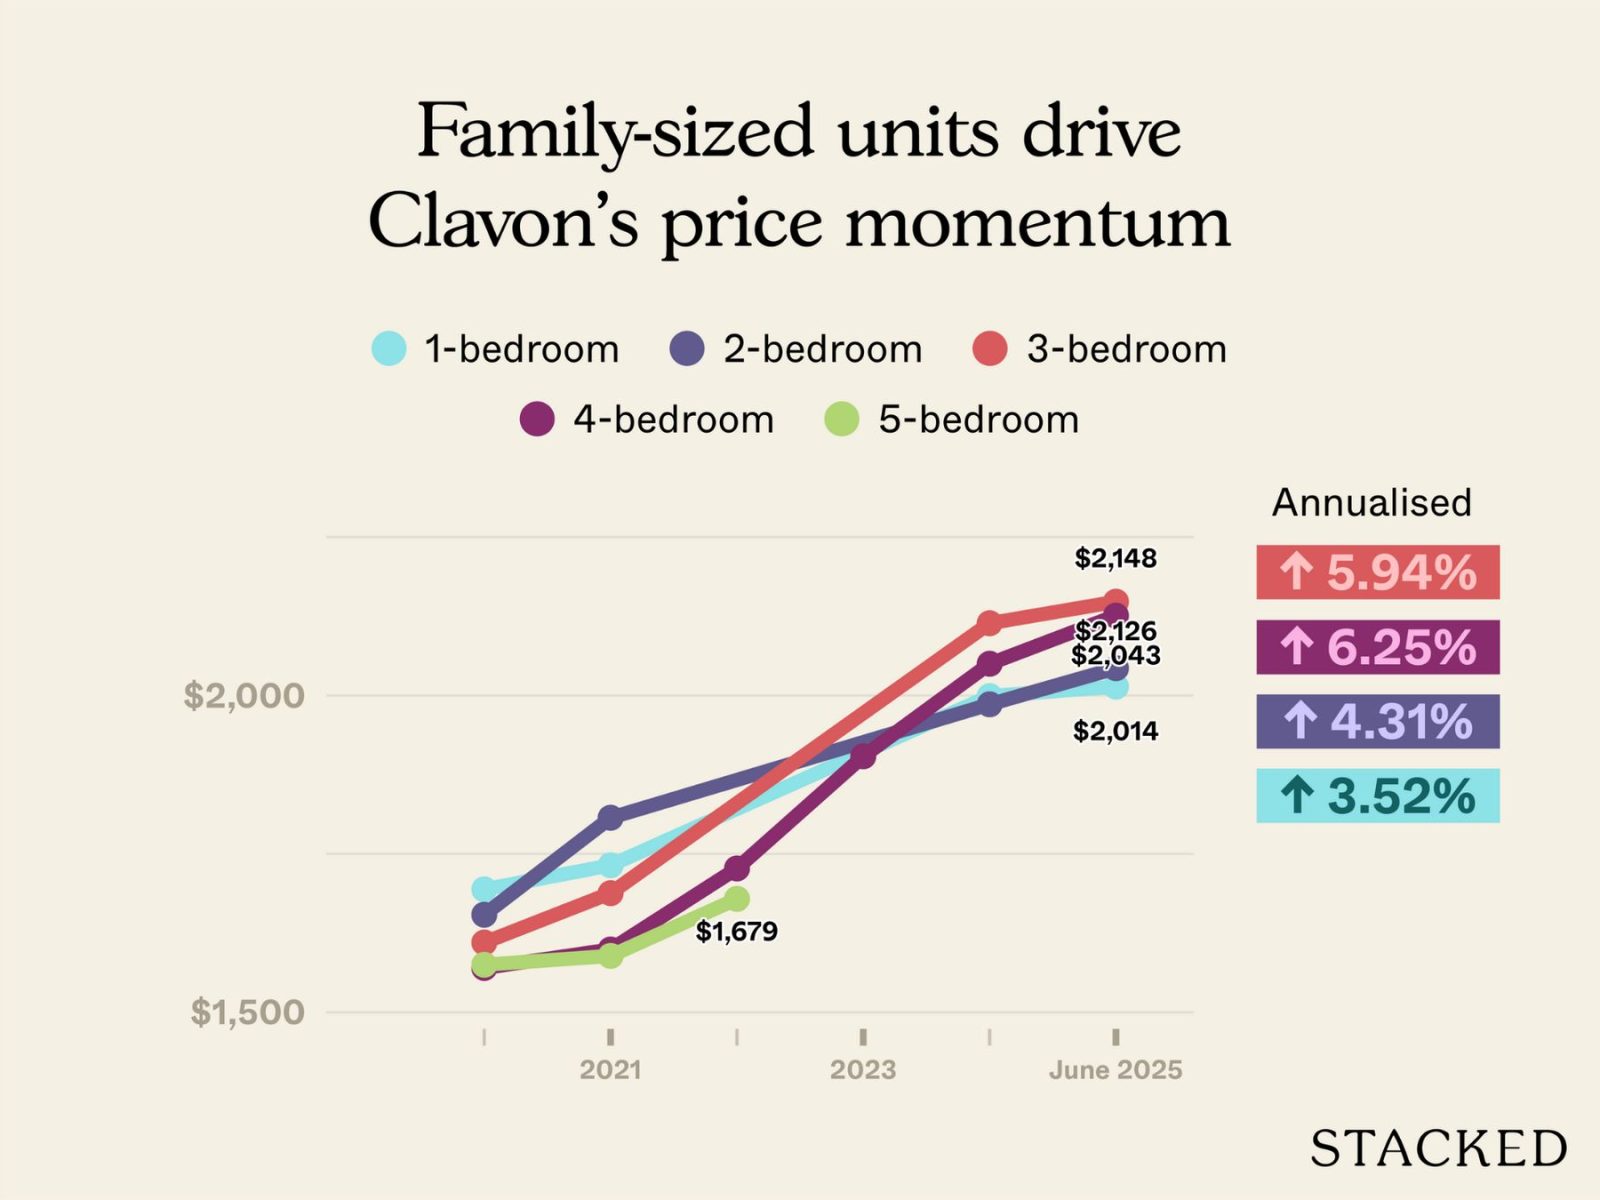
The larger units have shown stronger appreciation over time. The four-bedders recorded the highest annualised growth rate, followed by the three-bedders. Smaller units, particularly one- and two-bedders, posted mediocre gains since launch.
There haven’t been any resale transactions for the five-bedders so far.
Let’s look at the profitability of the transactions from 2024 to June 2025
| Unit types | Average gains | Average purchase price | Average ROI | Units sold | Average holding period (years) |
| 1-bedroom | $161,243 | $895,563 | 18.14% | 16 | 3.9 |
| 2-bedroom | $279,586 | $1,219,213 | 22.99% | 61 | 3.9 |
| 3-bedroom | $516,211 | $1,609,370 | 32.07% | 27 | 3.7 |
| 4-bedroom | $707,500 | $2,219,143 | 32.07% | 14 | 3.4 |
So far, all recorded transactions at Clavon have been profitable. The average gains ranged from about $160,000 for one-bedders to over $700,000 for the four-bedders, with no resale losses.
Again, it’s clear that larger units have delivered higher average gains and ROIs, likely reflecting stronger demand from upgraders and families for this project. The smaller units, while still profitable, show more modest returns.
What could be happening?
The opinion from agents is that average prices in District 5 saw a surge; one that ended up making Clavon’s percentage gains appear weaker by contrast.
D5’s average prices have been pulled upward by nearby projects like Parc Clematis, which saw significant gains after launch.
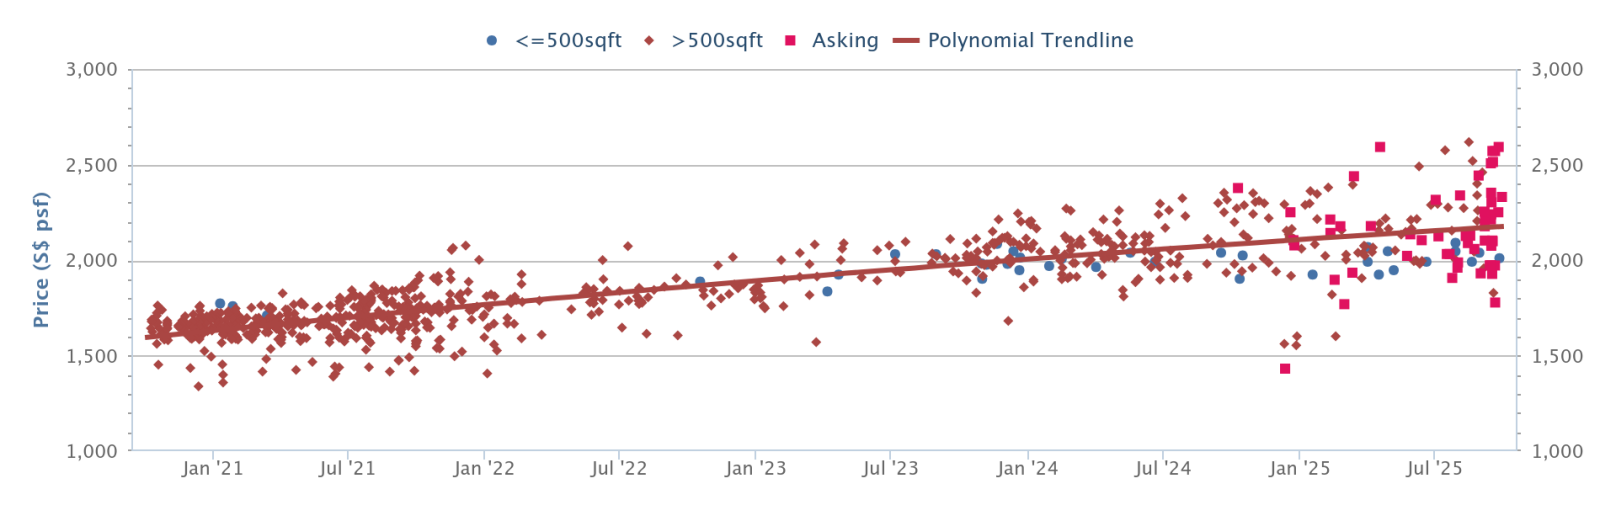
From around 2021 to early 2023, Parc Clematis prices were quite steady, hovering between roughly $1,500 and $1,800 psf. But from 2023 onward, the trendline steepens noticeably, pushing closer to and beyond $2,000 psf by 2024, and toward $2,400–$2,600 psf for some recent transactions and listings.
This contributed to skewing the district’s overall growth higher than what most projects, like Clavon, actually experienced.
As for Clavon’s recently improved resale performance, this is likely influenced by price hikes in newer launches such as ELTA.
At launch, ELTA’s two-bedders of a similar size were priced at about $1.6 million for upper floors and around $1.4 million for lower floors, compared to a recent Clavon resale at about $1.37 million. So in effect, buyers looking in the same area could get a completed, ready-to-move-in Clavon unit for less than a brand-new ELTA launch.
In a market where most new launches have crossed the $2,000 psf threshold, Clavon now suddenly looks like a more sensible buy. As a result, resale demand strengthened of late, pushing up prices through 2024 and 2025.
2. Penrose
Penrose is a leasehold, District 14 project with 566 units, completed in 2024. You can see the full review here.
This is the overall performance to date:
| Year | Penrose average $PSF | D14 average $PSF (only sub sale and resale tnx) |
| 2020 | $1,588 | $1,198 |
| 2021 | $1,676 | $1,286 |
| 2022 | $1,699 | $1,458 |
| 2023 | $1,914 | $1,613 |
| 2024 | $2,052 | $1,727 |
| 2025 (Up till June 2025) | $2,134 | $1,817 |
| Annualised | 6.08% | 8.69% |
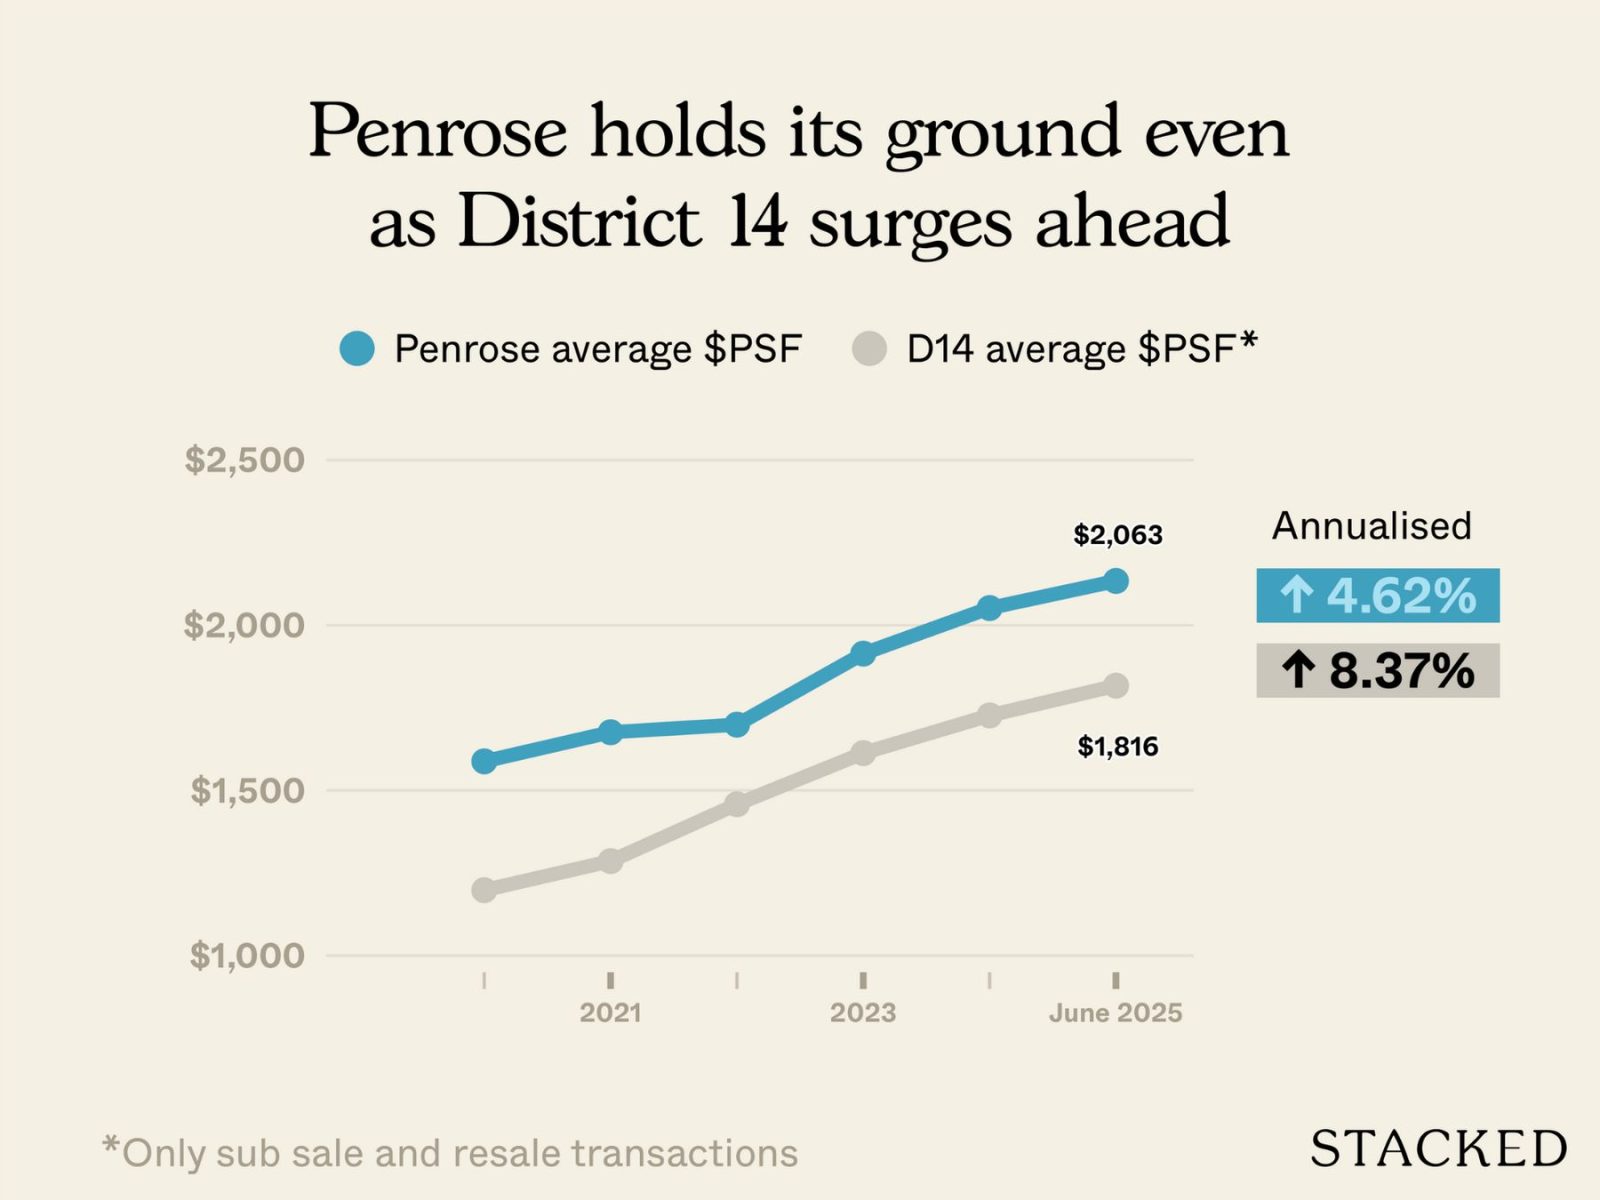
Penrose has seen an annualised growth rate of about 6.1 per cent, compared to 8.7 per cent for the broader D14 market over the same period. So while Penrose has appreciated steadily, it has trailed the overall district average.
Let’s break it down by unit type for a closer look:
| Year | 1-bedroom | 2-bedroom | 3-bedroom | 4-bedroom |
| 2020 | $1,753 | $1,619 | $1,506 | $1,607 |
| 2021 | $1,789 | $1,677 | $1,645 | |
| 2022 | $1,699 | $1,699 | ||
| 2023 | $1,879 | $1,954 | $1,887 | |
| 2024 | $1,966 | $2,063 | $2,057 | |
| 2025 | $1,961 | $2,145 | $2,164 | $2,148 |
| Annualised | 2.27% | 5.79% | 7.52% | 5.97% |
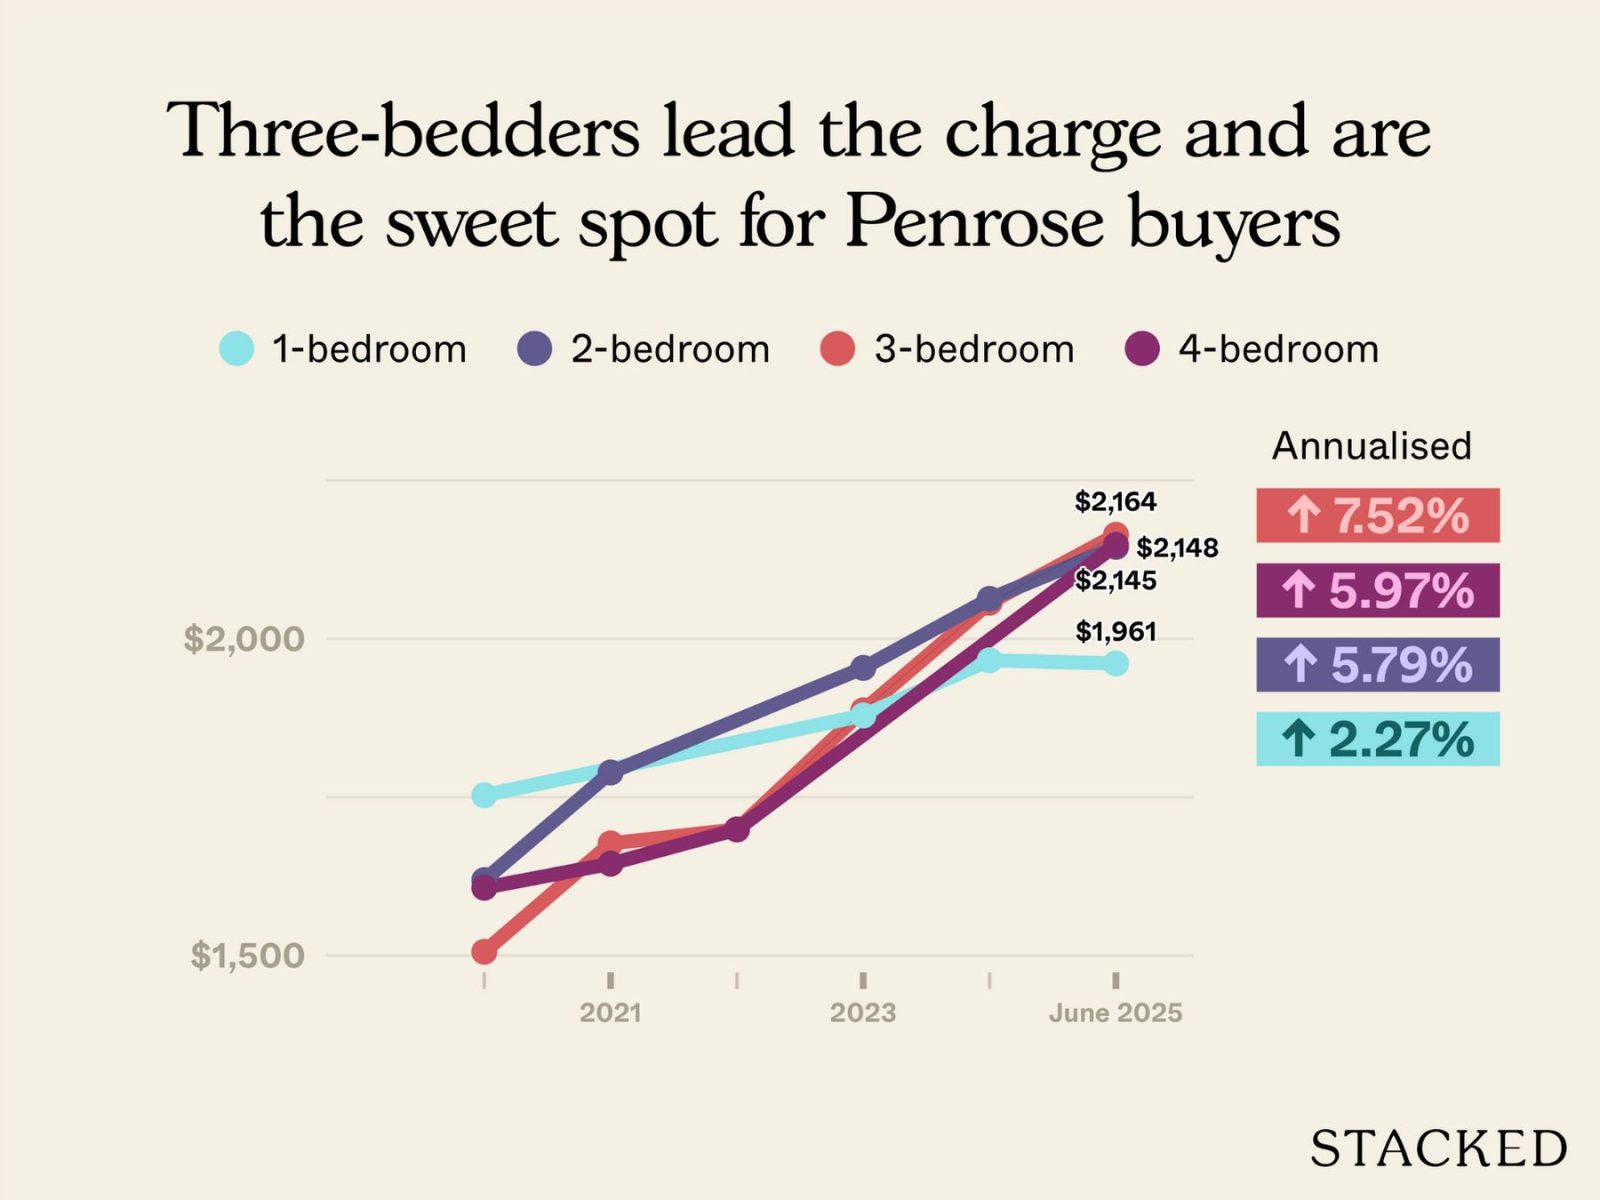
Larger layouts performed better in Penrose. The three-bedders recorded the strongest appreciation, with an annualised growth rate of about 7.5 per cent, followed by the four-bedders at around six per cent. In contrast, smaller one- and two-bedders saw slower growth. As to why the four-bedders didn’t perform as well as the three-bedders, we elaborate more on this below.
Here’s the profitability of transactions from 2024 to June 2025:
| Unit types | Average gains | Average purchase price | Average ROI | Units sold | Average holding period (years) |
| 1-bedroom | $109,565 | $823,587 | 13.35% | 15 | 4.1 |
| 2-bedroom | $323,432 | $1,125,044 | 29.17% | 70 | 4.0 |
| 3-bedroom | $566,377 | $1,564,109 | 36.57% | 69 | 3.9 |
| 4-bedroom | $755,333 | $2,234,667 | 33.76% | 3 | 3.8 |
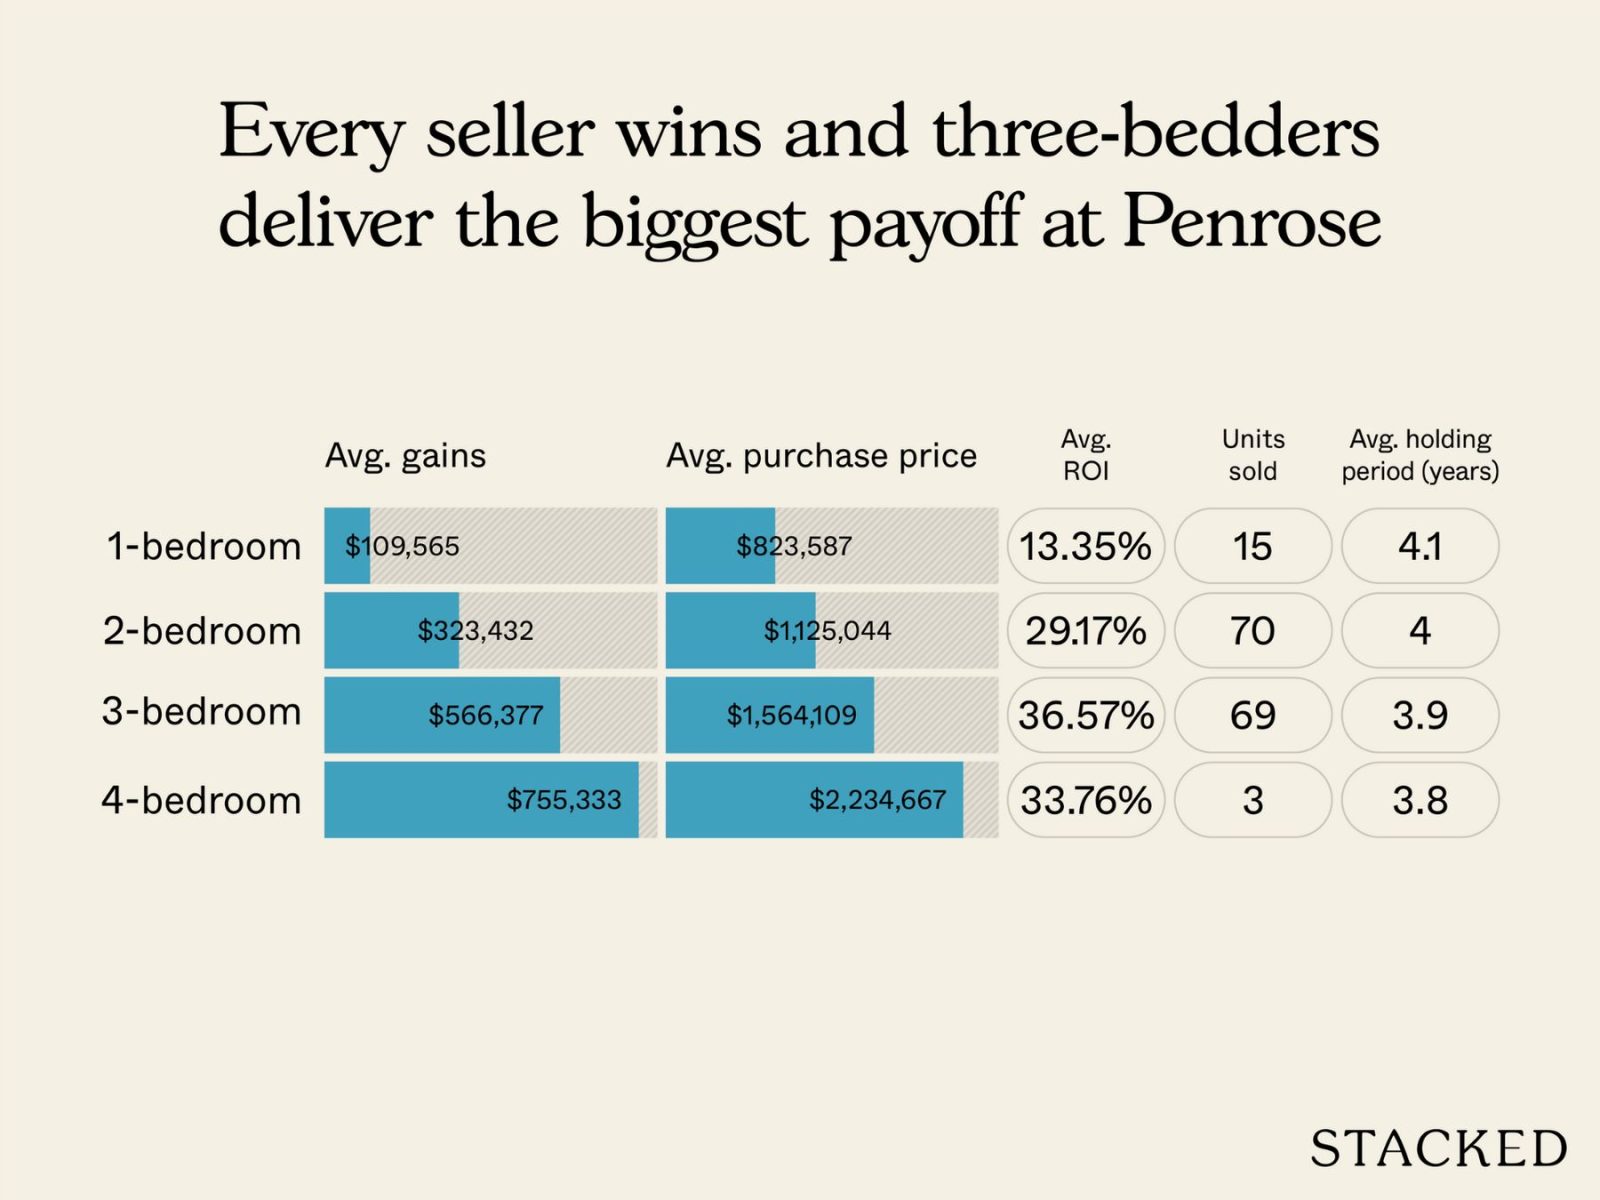
All recorded resale transactions at Penrose have been profitable so far. Average gains ranged from about $110,000 for one-bedders to over $750,000 for the four-bedders.
While larger units clearly led, the two-bedders have performed well also; we see average returns of around 29 per cent.
What could be happening?
According to realtors, Penrose’s slower price growth - compared to the wider District 14 average - has less to do with the project itself; it’s more about how surrounding developments have performed.
Parc Esta, for instance, has seen strong resale activity, with recent two-plus-study units selling for around $1.98 million and $1.975 million, and a three-bedder transacting at about $2.48 million in August 2025. Such benchmark prices, from such a large-scale project, skewed the district average upward, and this made other nearby condos appear to lag.
The same trend can be seen with other developments like Grand Dunman, Dakota Residences, and Waterbank at Dakota - all of which have seen prices move up in recent years and pulled up the D14 average.
Also, Penrose has a shorter average holding period, since most buyers entered around 2020 or 2021. Many of them would have bought around the same time as owners at Waterbank or Dakota, both of which have since had more time to appreciate.
Regarding the weaker performance of the four-bedders compared to the three-bedders, realtors attributed this to tenure: in the city fringe (RCR), buyers who can afford a four-bedder in this price range often look toward freehold projects instead. This reduces the prospective pool of buyers, compared to the three-bedders.
Taken together, these factors suggest Penrose isn’t actually underperforming - its percentage gains just look lower without context. So far, its resale results remain solid, with every transaction being a win.
3. Irwell Hill Residence
Irwell Hill Residence is a leasehold, District 9 project with 540 units, completed in 2024. You can see the full review here.
This is its overall performance since launch:
| Year | Irwell Hill Residences average $PSF | D9 average $PSF (only sub sale and resale tnx) |
| 2021 | $2,663 | $2,198 |
| 2022 | $2,858 | $2,208 |
| 2023 | $2,916 | $2,241 |
| 2024 | $2,805 | $2,277 |
| 2025 | $2,906 | $2,342 |
| Annualised | 2.20% | 1.59% |
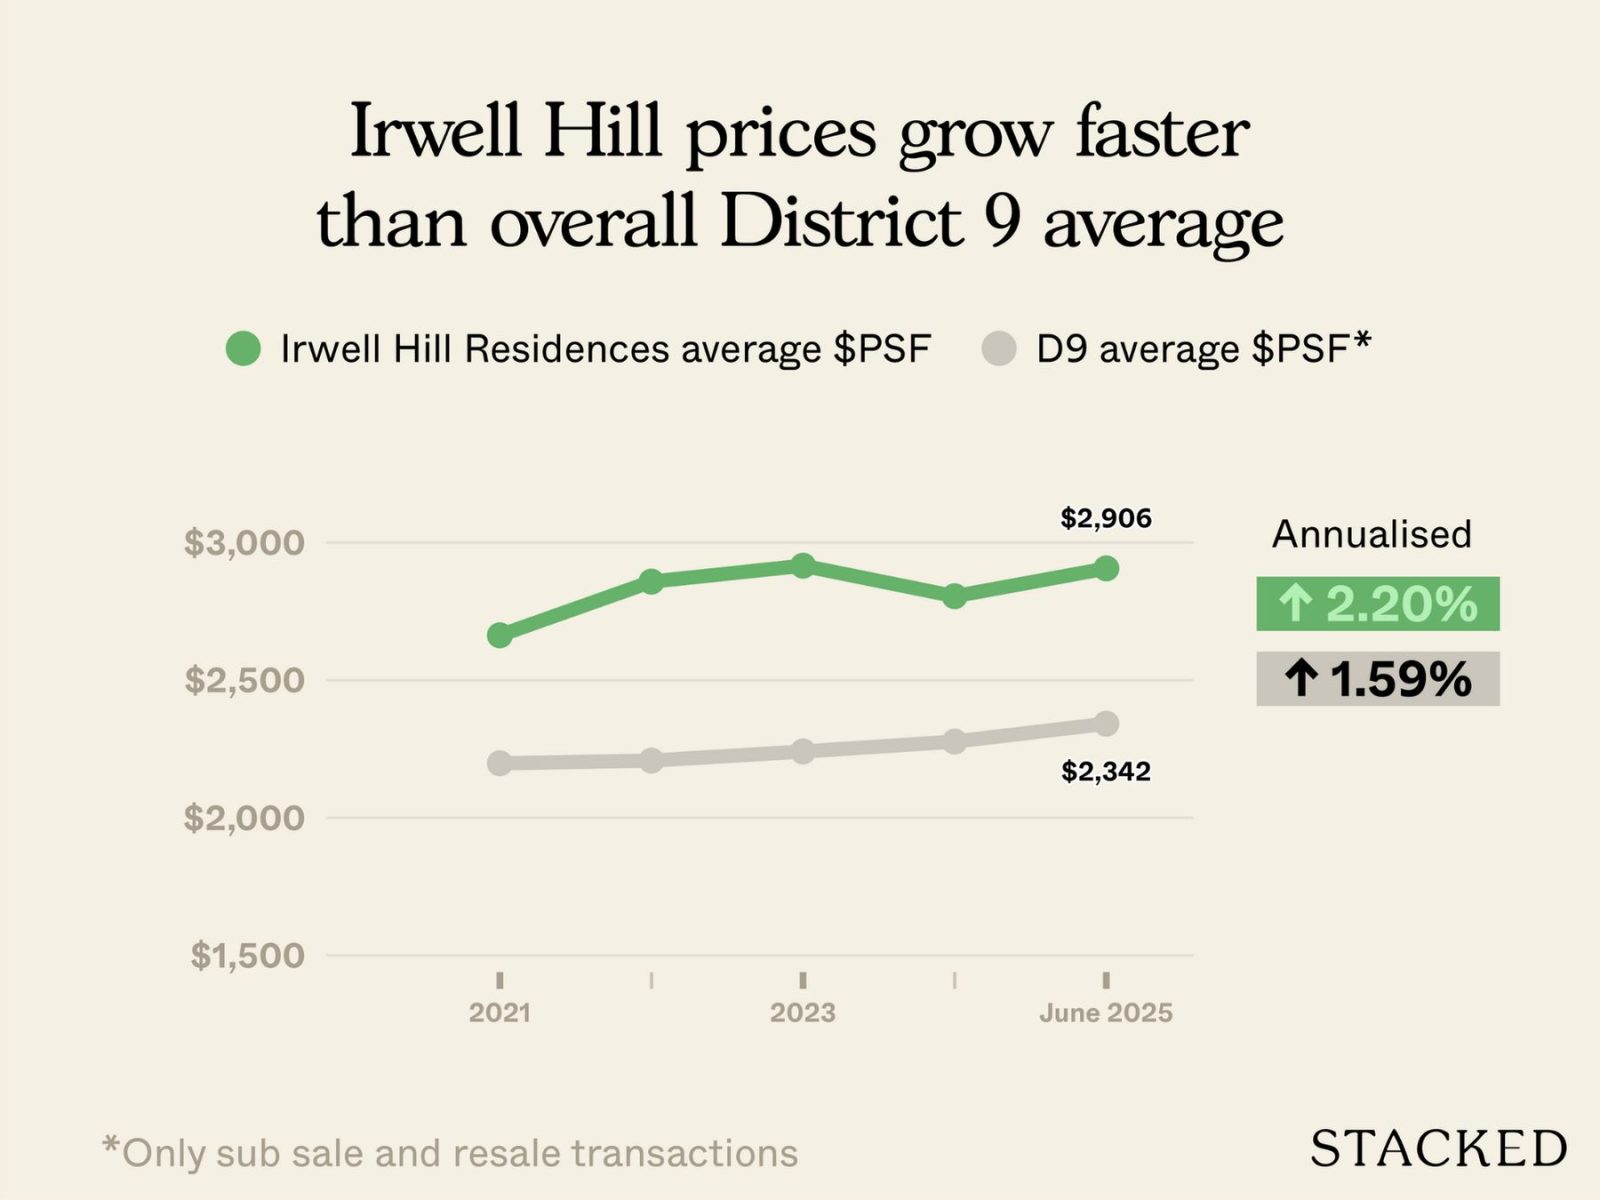
Since its launch in 2021, Irwell Hill has seen an annualised gain of around 2.2 per cent; this is slightly ahead of the D9 average of 1.6 per cent.
Let’s take a closer look by unit type, to see where which unit sizes performed best:
| Year | 1-bedroom | 2-bedroom | 3-bedroom | 4-bedroom |
| 2021 | $2,687 | $2,652 | $2,623 | $2,771 |
| 2022 | $2,981 | $2,890 | $2,713 | $2,758 |
| 2023 | $2,969 | $2,901 | ||
| 2024 | $2,805 | |||
| 2025 | $2,888 | $2,926 | $3,066 | $2,491 |
| Annualised | 1.82% | 2.49% | 3.98% | -2.63% |
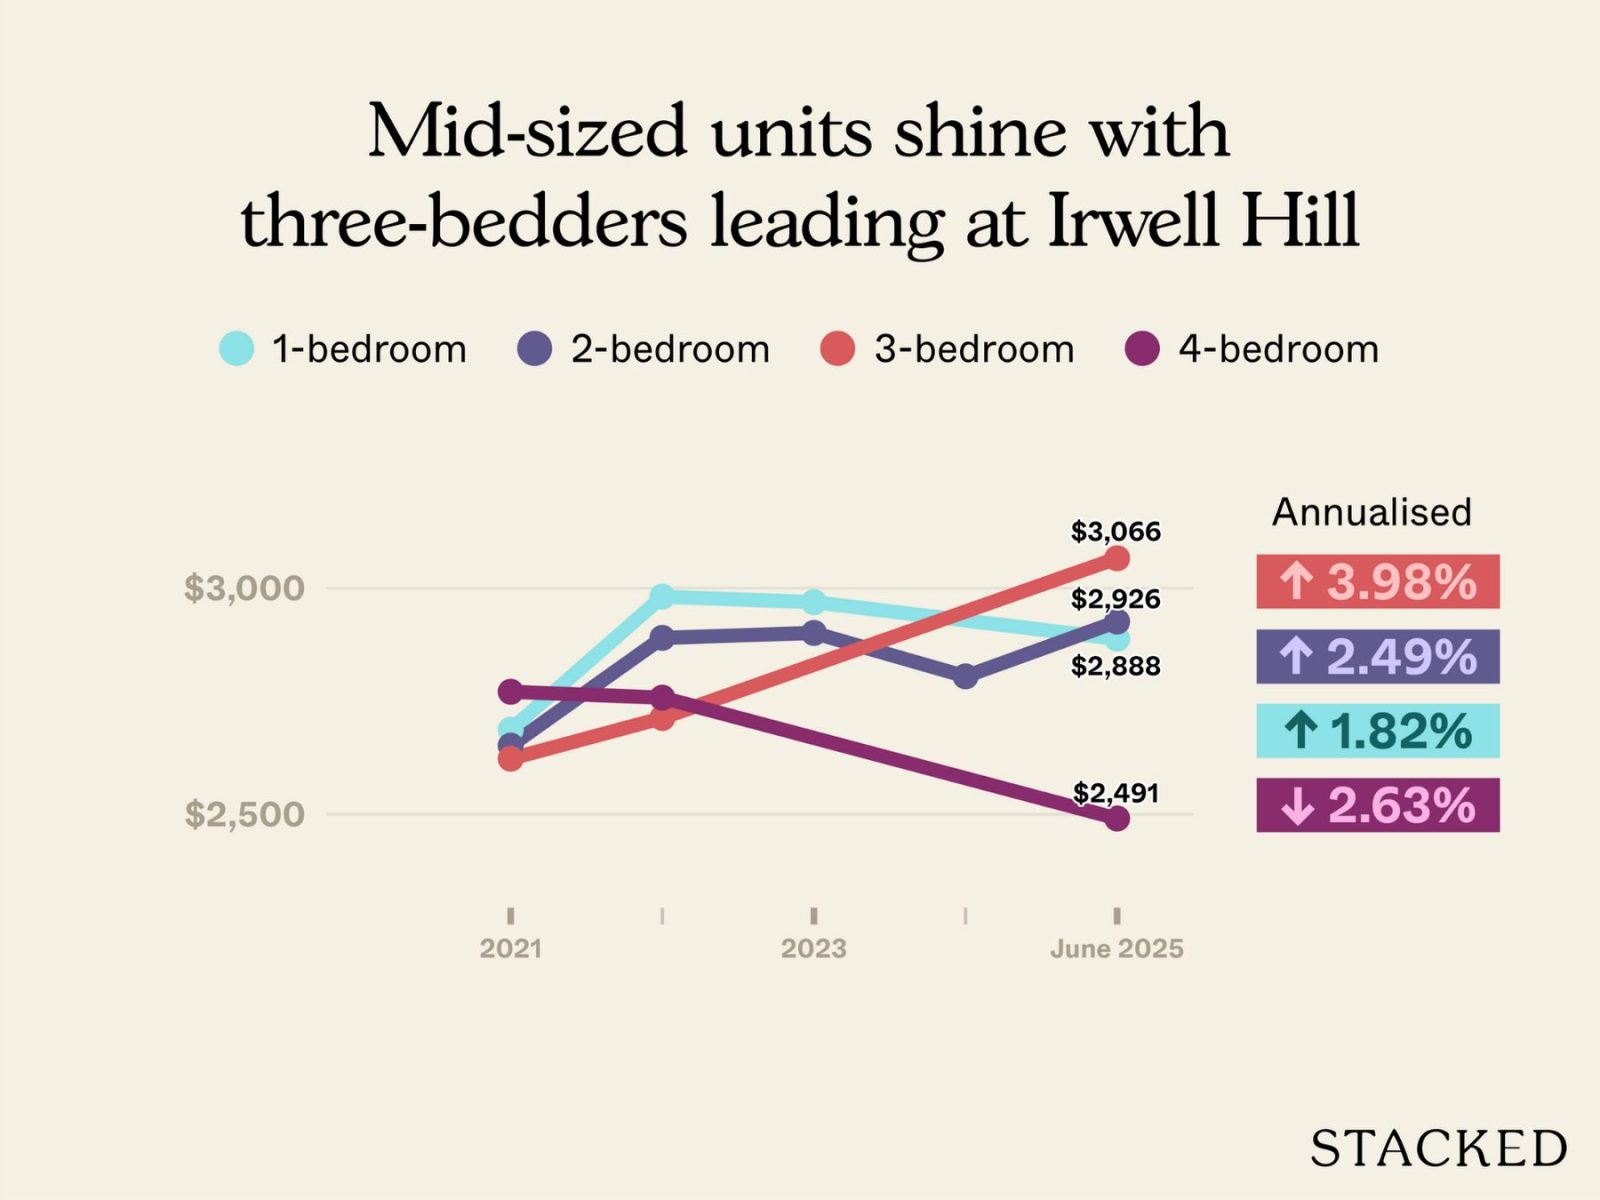
The three-bedders have shown the strongest appreciation so far, for reasons we’ll explain below. This was followed by the two-bedders. This aligns with the broader Core Central Region (CCR) trend to date, where two-bedders (or 2+1 units) are sometimes bought by small families as well, and not just investors.
The four-bedders show a negative growth rate because of a single, high-quantum penthouse transaction in 2025. This is an outlier and can’t be considered representative.
Let’s now take a look at the profitability of transactions completed from 2024 to June 2025.
| Unit types | Average gains | Average purchase price | Average ROI | Units sold | Average holding period (years) |
| 1-bedroom | $105,000 | $1,265,000 | 8.17% | 2 | 3.9 |
| 2-bedroom | $198,991 | $1,733,250 | 11.43% | 12 | 3.8 |
| 3-bedroom | $436,000 | $2,204,000 | 19.78% | 1 | 4.1 |
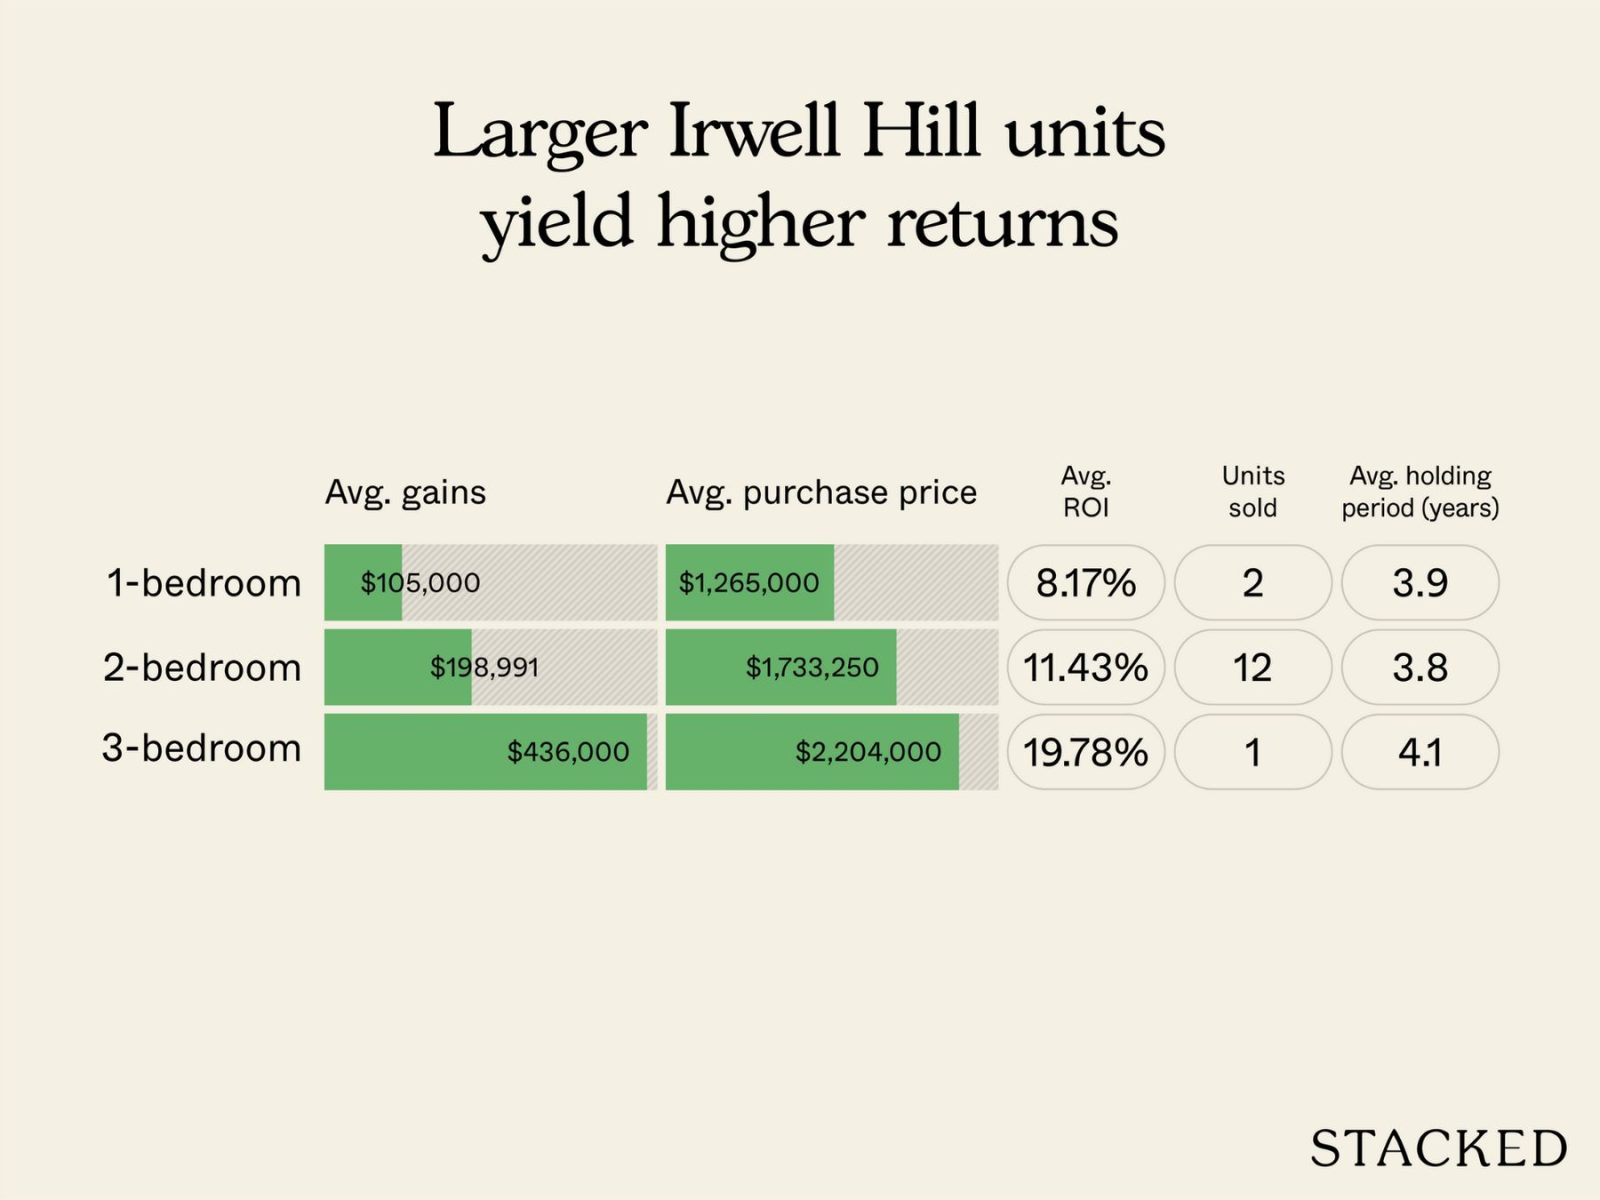
All recorded resale transactions at Irwell Hill Residences have been profitable. Average gains ranged from about $105,000 for one-bedders to roughly $436,000 for three-bedders, which is a solid performance within the context of the short holding period.
What could be happening?
Realtors note that the district’s headline figures have also been influenced by new launches such as Promenade Peak and River Green - these two projects are effectively pulling up the D9 average, as they have a lower quantum but a higher $PSF. This makes Irwell Hill’s performance even stronger than it appears, since it managed to edge out the district average even then.
As for the three-bedders, Irwell Hill’s units have been especially appealing for their size and relative value. They’re widely considered some of the most cost-effective options in the area (see our linked review above), offering efficient layouts at a lower quantum.
The changing character of the Great World area has also played a role. With the completion of Great World MRT (TEL) and the ongoing revitalisation around Great World City, the neighbourhood is one of the few truly family-oriented CCR areas. As a result, more buyers with young children are looking for larger homes in the area, adding steady demand for mid-sized units like Irwell Hill’s three-bedders.
4. Pasir Ris 8
Pasir Ris 8 is a leasehold, District 18 project with 487 units, completed in 2024. You can see the review here.
Let’s look at its overall performance since launch:
| Year | Pasir Ris 8 average $PSF | D18 average $PSF (only sub sale and resale tnx) |
| 2021 | $1,619 | $1,009 |
| 2022 | $1,824 | $1,147 |
| 2023 | $1,829 | $1,325 |
| 2024 | $1,831 | $1,413 |
| 2025 | $2,011 | $1,445 |
| Annualised | 5.57% | 9.39% |
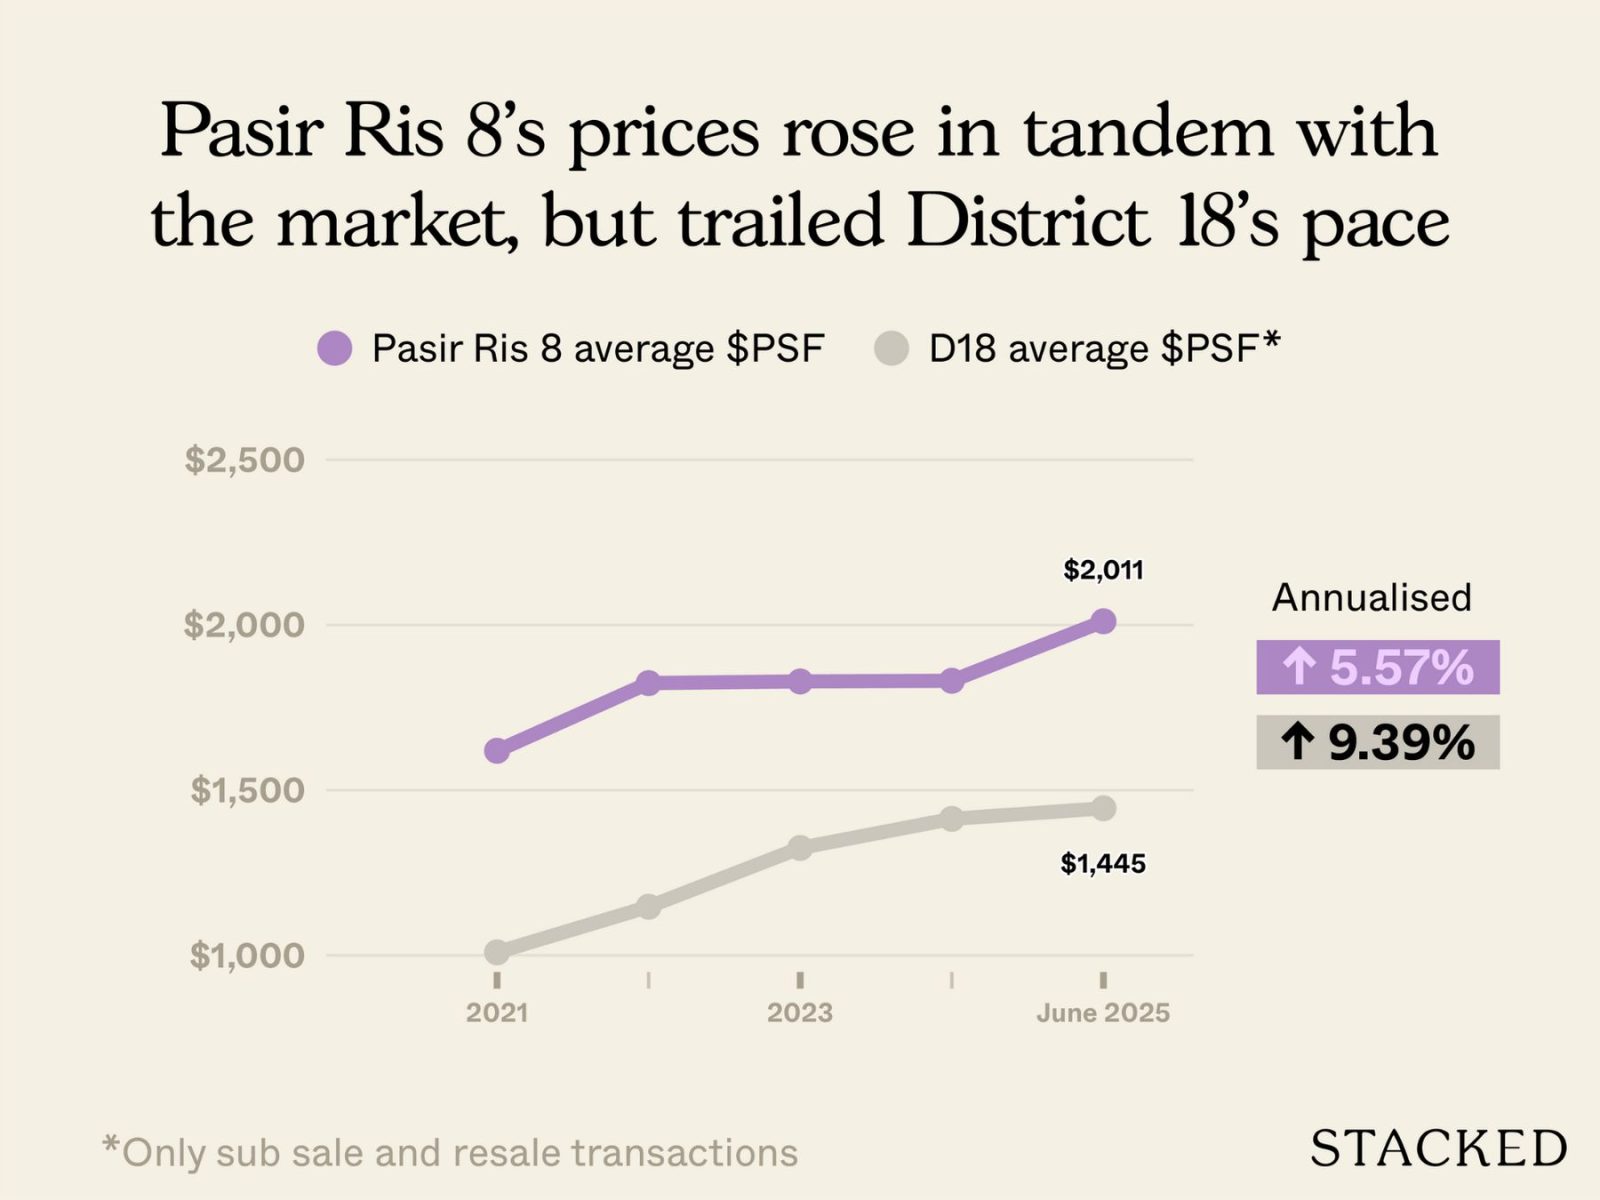
Since its launch in 2021, Pasir Ris 8 has seen an annualised gain of around 5.6 per cent, which trails the overall D18 average of about 9.4 per cent.
Let’s take a closer look by unit type to see where the differences lie:
| Year | 1-bedroom | 2-bedroom | 3-bedroom | 4-bedroom |
| 2021 | $1,712 | $1,641 | $1,503 | $1,597 |
| 2022 | $2,061 | $1,754 | $1,727 | |
| 2023 | $2,077 | $1,794 | $1,763 | |
| 2024 | $1,893 | $1,974 | $1,799 | $1,754 |
| 2025 | $1,990 | $2,077 | $1,963 | |
| Annualised | 3.84% | 6.07% | 6.90% |
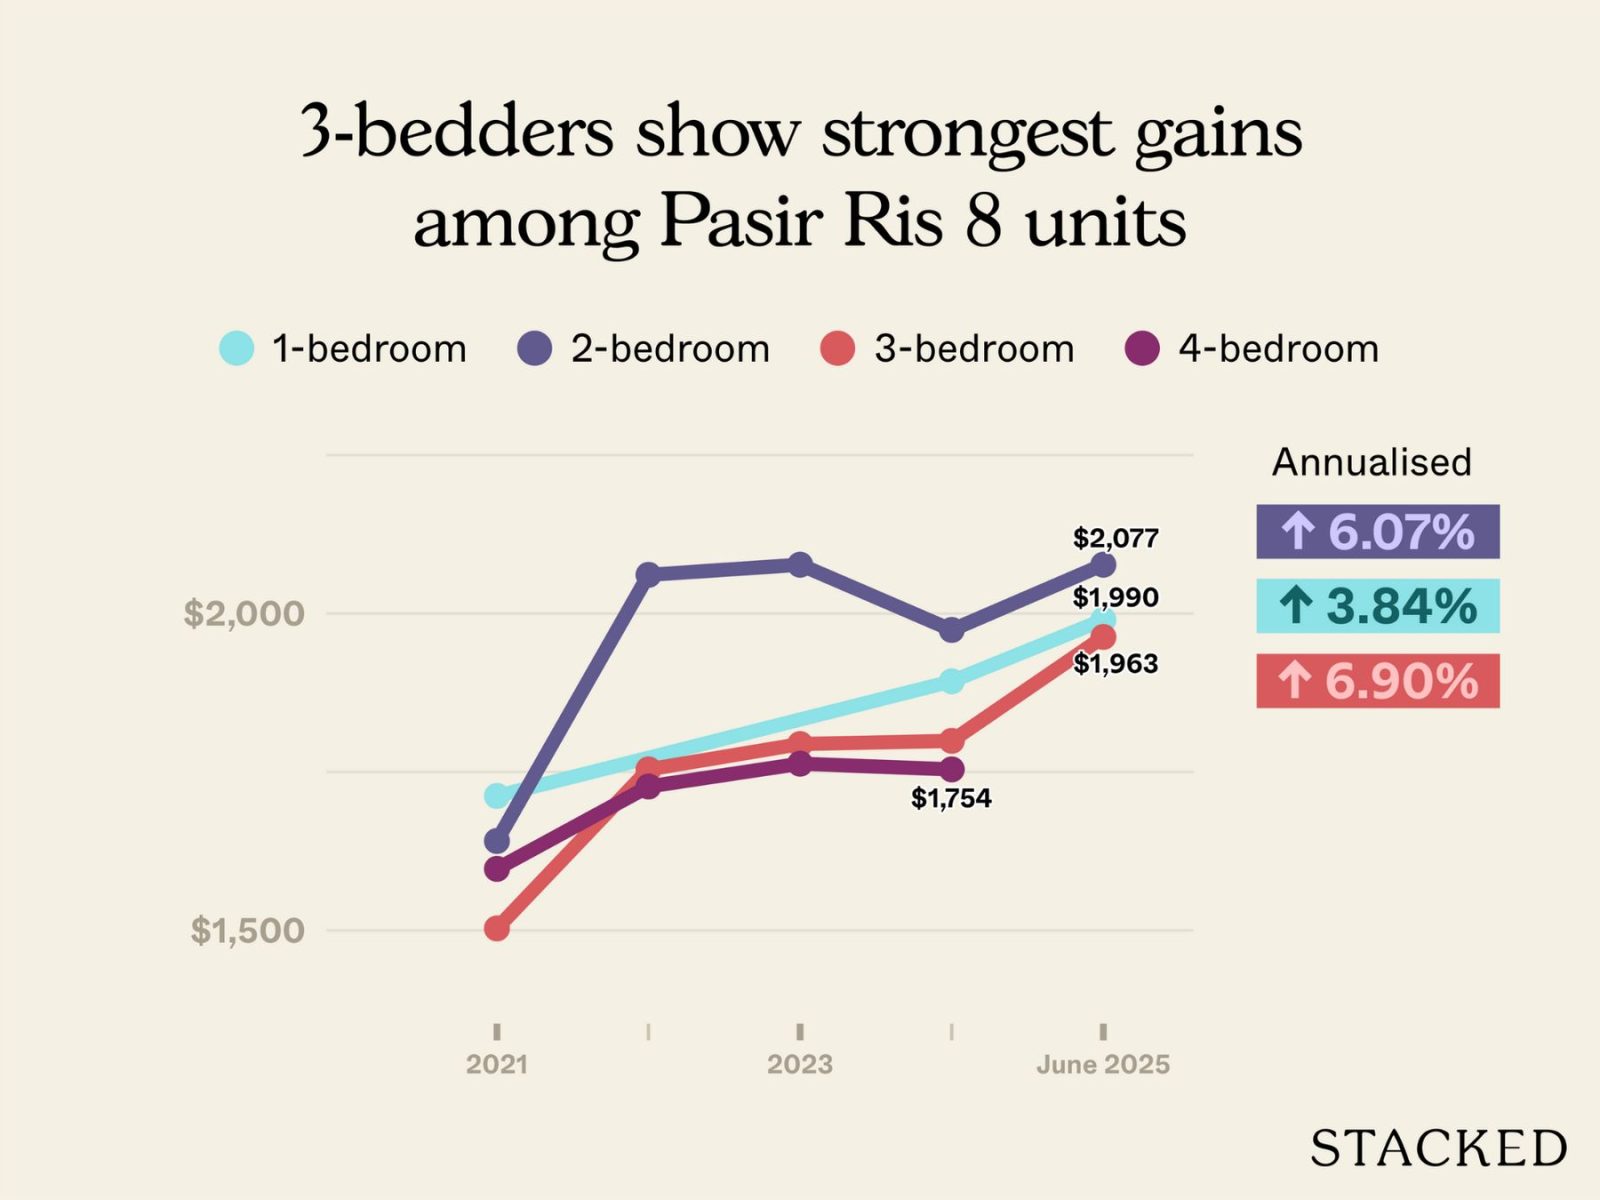
Looking at Pasir Ris 8 by unit type, the three-bedders have shown the strongest appreciation since launch, followed by the two-bedders. This reflects a familiar pattern by now, as seen in the above projects. The one-bedders have seen slower growth, and there were no four-bedder transactions in 2025.
Let’s look at the profitability of the transactions so far:
| Unit types | Average gains | Average purchase price | Average ROI | Units sold | Average holding period (years) |
| 1-bedroom | $120,000 | $883,000 | 13.58% | 2 | 3.4 |
| 2-bedroom | $331,000 | $1,262,600 | 26.20% | 5 | 3.7 |
| 3-bedroom | $482,648 | $1,631,500 | 29.78% | 6 | 3.6 |
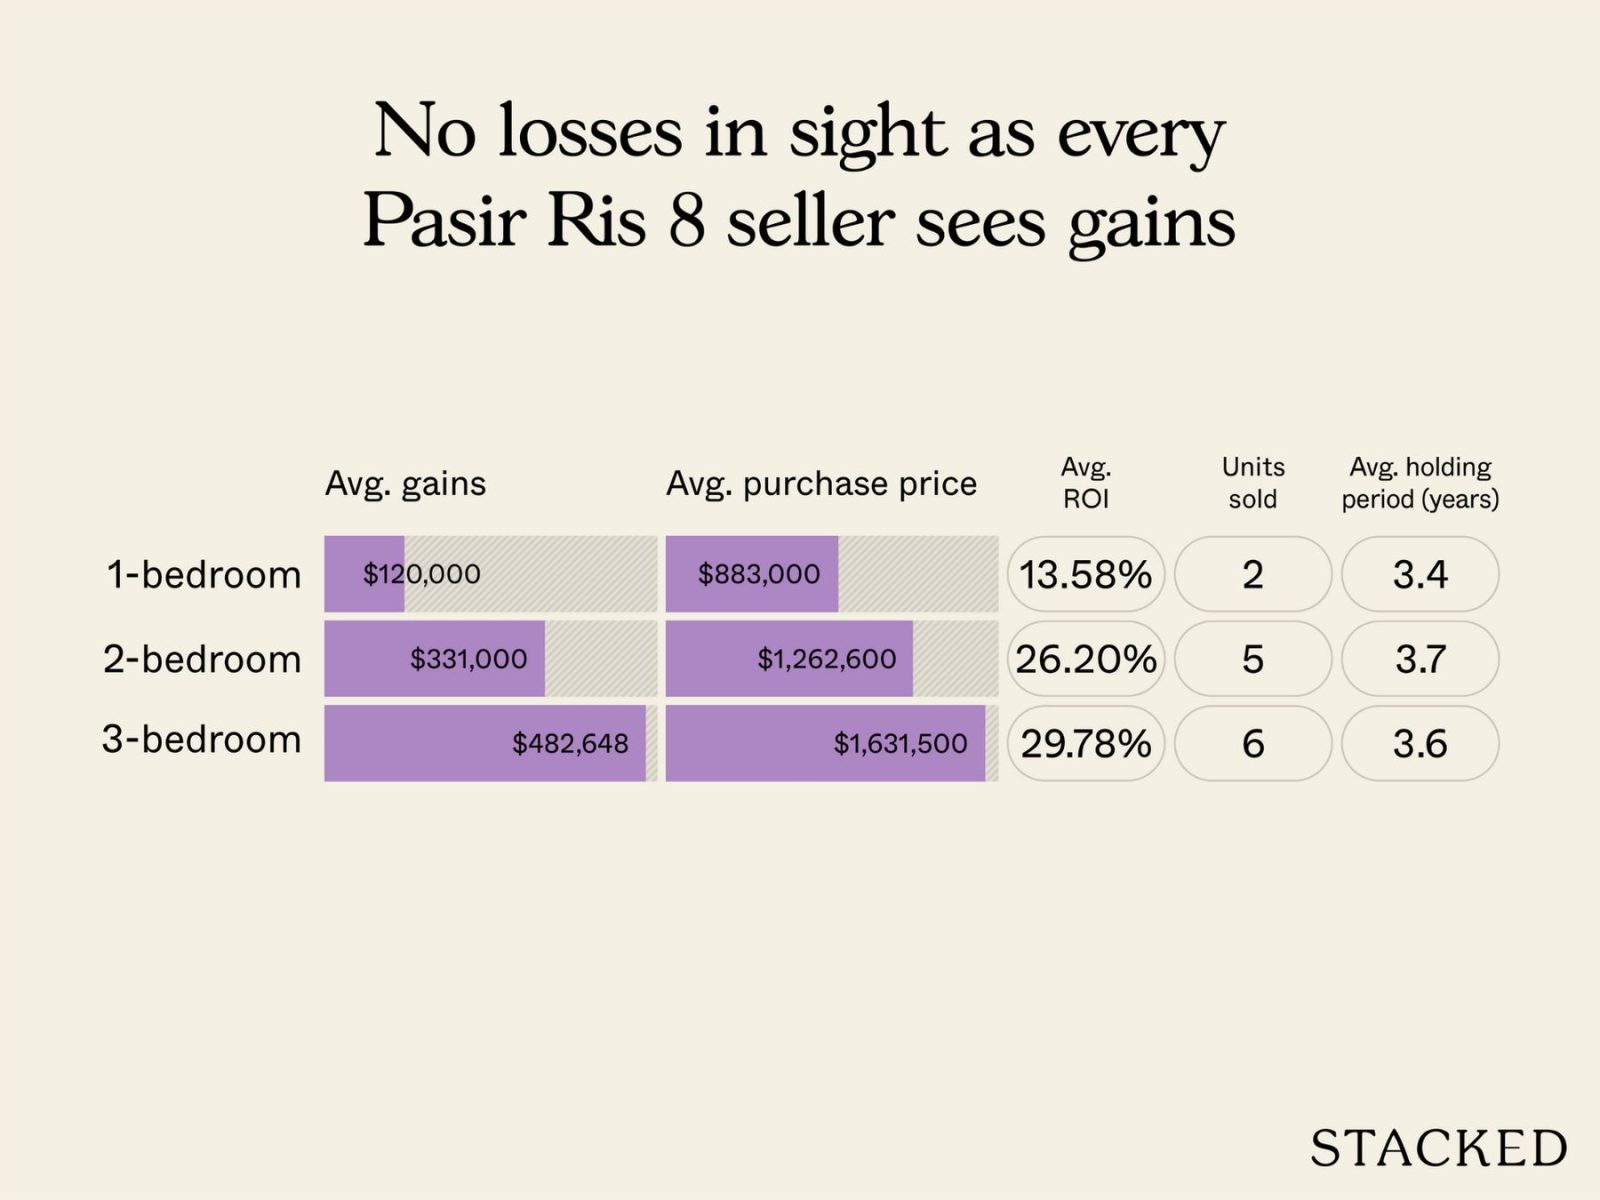
All recorded resale transactions at Pasir Ris 8 have been profitable. Average gains ranged from about $120,000 for one-bedders to roughly $480,000 for three-bedders, with no losses recorded so far.
The trend mirrors what we’ve seen in other recently completed projects: larger units achieved higher absolute and percentage returns, with three-bedders in particular showing strong performance,
What could be happening?
According to realtors, Pasir Ris 8 has played an important role in shaping price expectations in the area. As one of the few integrated developments on the east side, it effectively set the stage for surrounding projects to move upward in price. So even though it appears to be trailing, Pasir Ris 8 may have established a new benchmark that later launches built on.
At the same time, other nearby developments have lifted the broader D18 average. By now, this is a familiar pattern that we also saw above: successful projects such as Aurelle and Park Town have seen strong buyer interest, and also raised the average $PSF in the area - so this skewed the D18 average upward.
However, realtors also warned us that D18 covers an unusually wide area compared to other districts, with many different sub-markets. Within this same district, performance can vary significantly between Pasir Ris, Tampines, Simei, etc.
This makes the idea of “trailing the district average” much less meaningful, and it’s difficult to consider that a reflection of Pasir Ris 8.
BONUS: AMO Residence (almost completed)
AMO Residence isn’t actually complete yet, though it will be in around 2026. We’re going to make an exception and include this, as we can already see interesting subsale transactions.
This is a leasehold, District 20 project with 372 units. You can see the review here.
These are the transactions to date:
| Year | AMO Residence average $PSF | D20 average $PSF (only sub sale) |
| 2022 | $1,824 | $1,554 |
| 2023 | $1,829 | $1,672 |
| 2024 | $1,831 | $1,749 |
| 2025 | $2,011 | $1,824 |
| Annualised | 3.32% | 5.48% |
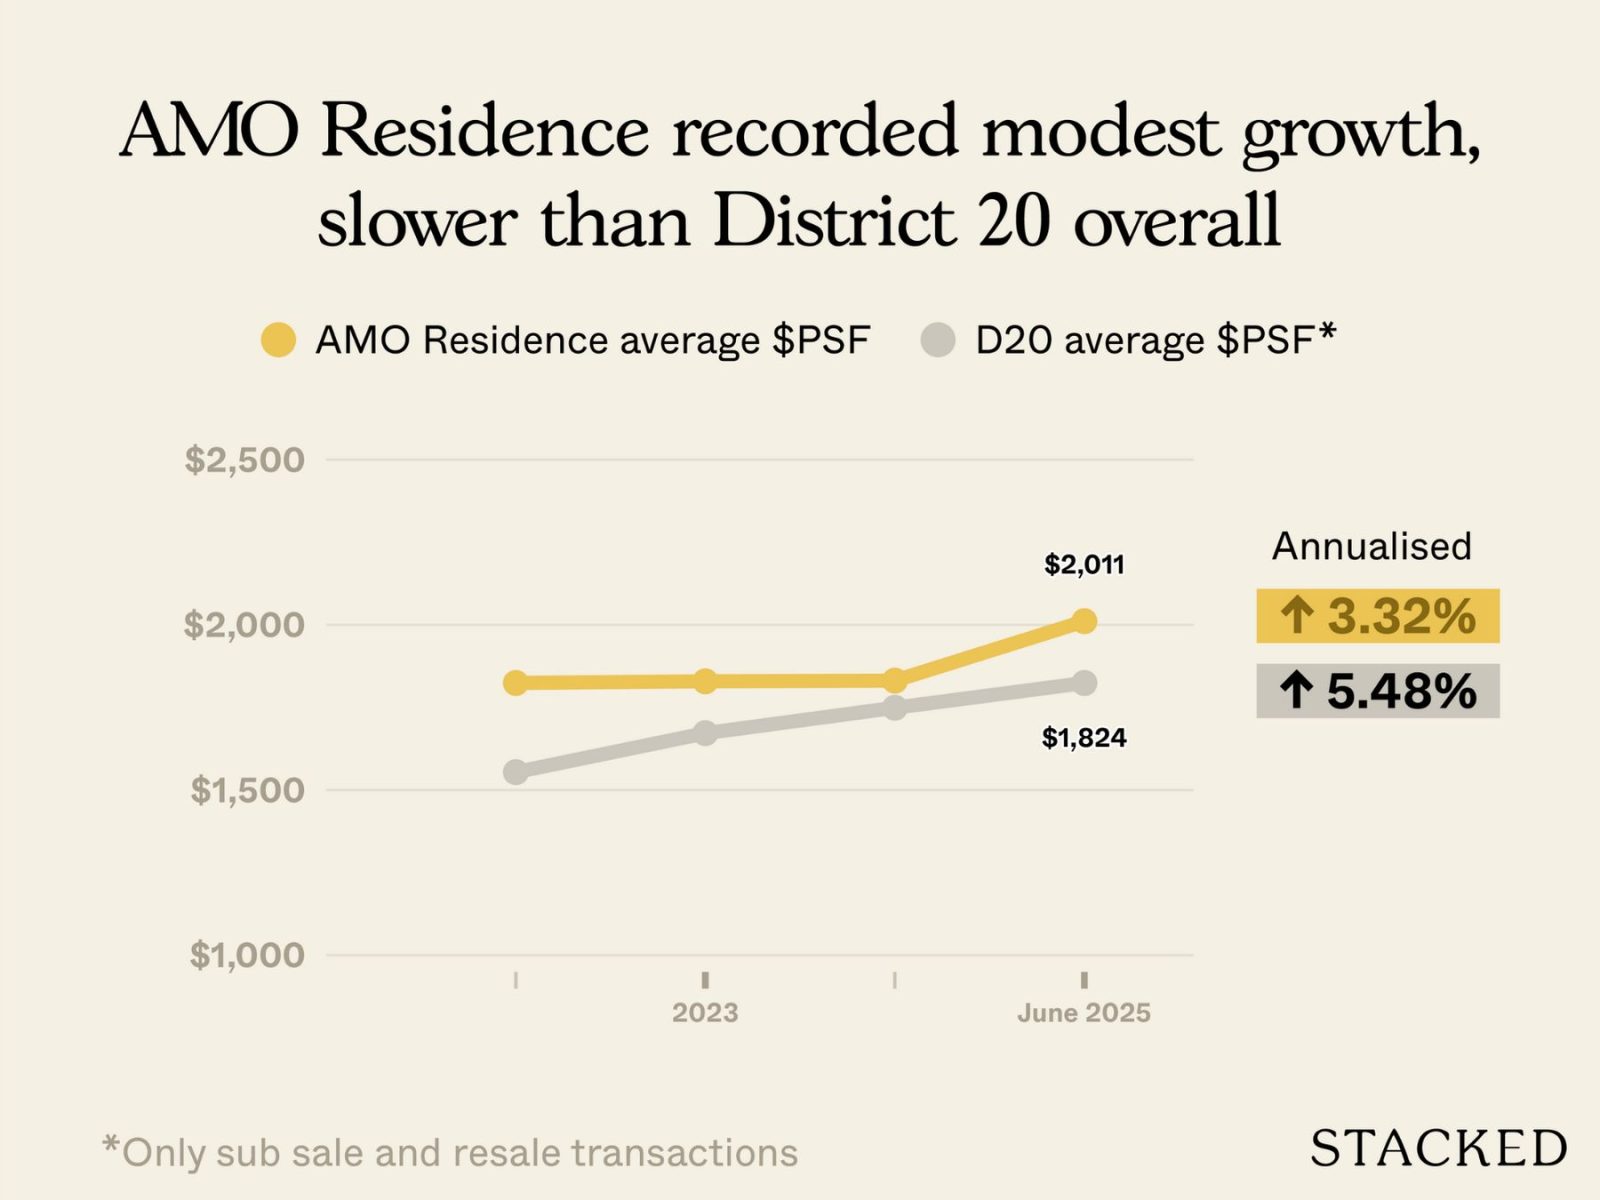
Since its launch in 2022, average prices at AMO have risen from about $1,820 psf to roughly $2,010 psf by mid-2025. That works out to an annualised gain of about 3.3 per cent. We shouldn’t read too much into its trailing the district average, as these are just subsales.
Let’s look at the various unit types and their performance:
| Year | 2-bedroom | 3-bedroom | 4-bedroom | 5-bedroom |
| 2022 | $2,138 | $2,087 | $2,084 | $2,118 |
| 2023 | $2,443 | $2,237 | ||
| 2024 | $2,263 | |||
| 2025 | $2,359 | |||
| Annualised | 3.33% |
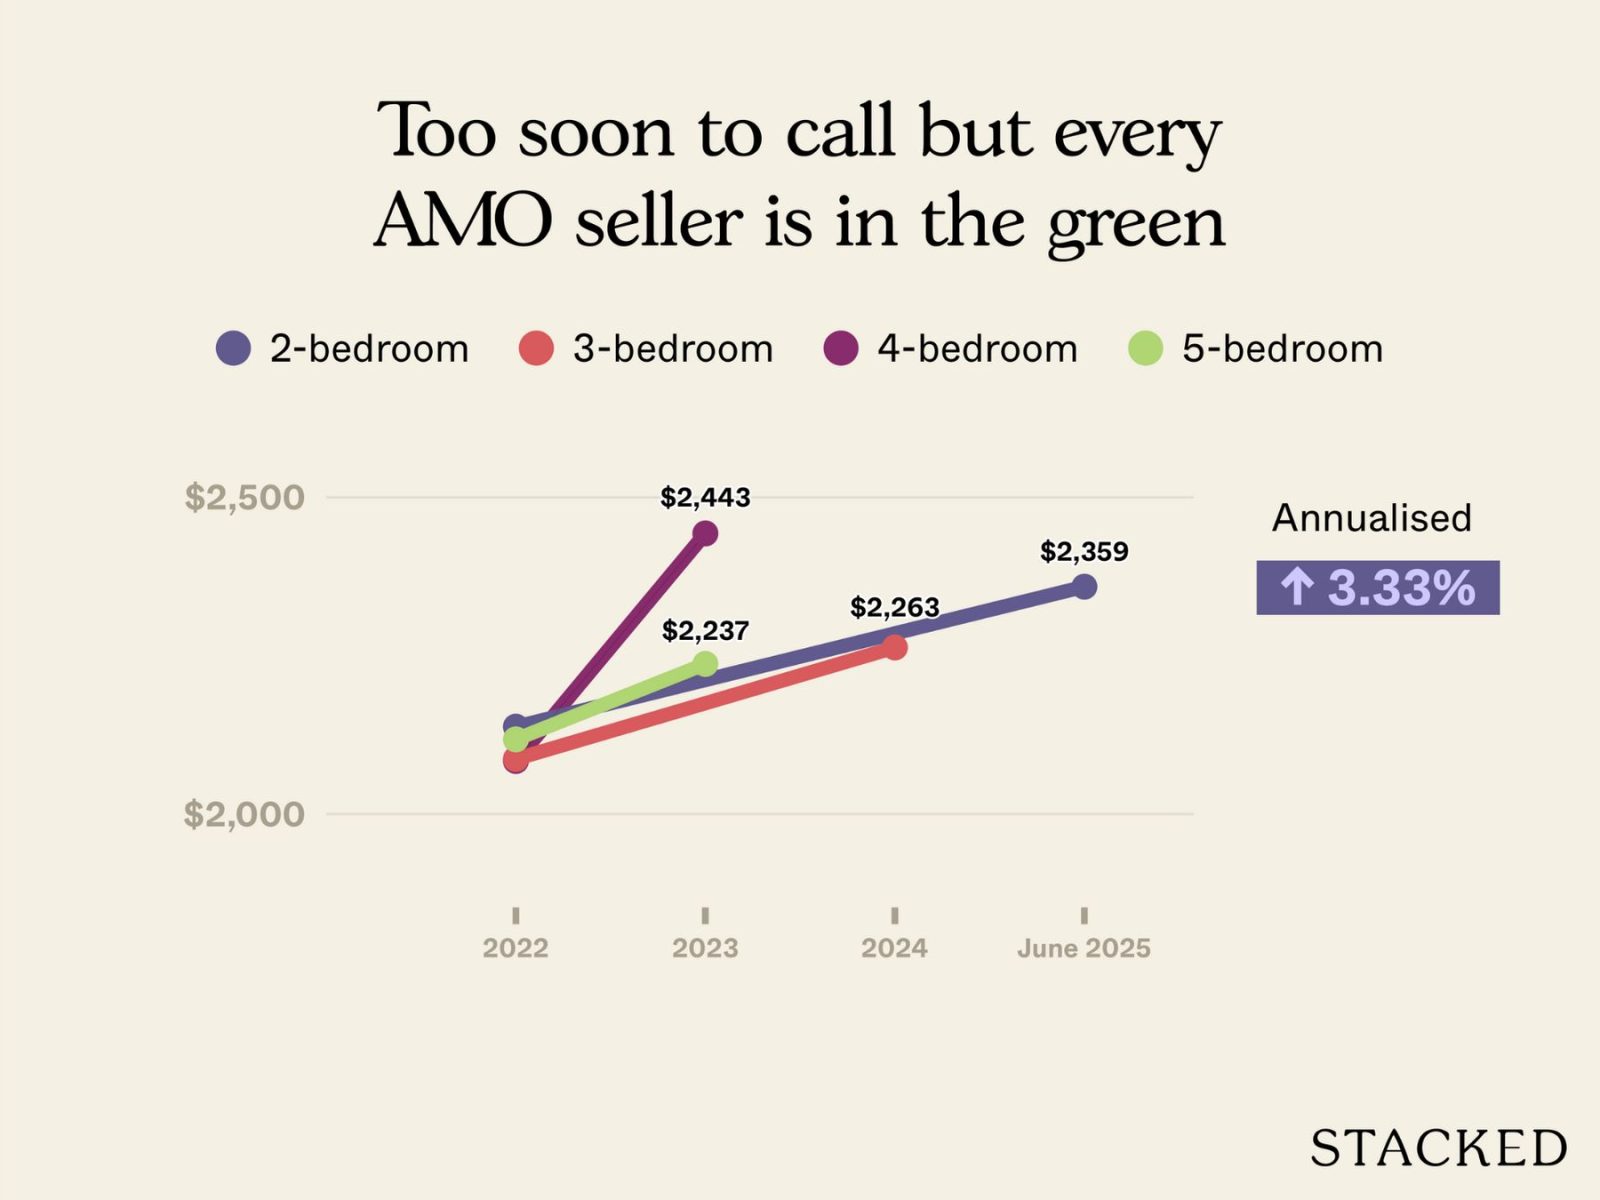
Up to June 2025, there have only been two sub sale transactions recorded; a three-bedder in 2024 and a two-bedder in 2025. This is the profitability from the sub sales:
| Unit types | Average gains | Average purchase price | Average ROI | Units sold | Average holding period (years) |
| 2-bedroom | $101,000 | $1,499,000 | 6.74% | 1 | 2.7 |
| 3-bedroom | $357,000 | $1,811,000 | 19.71% | 1 | 1.6 |
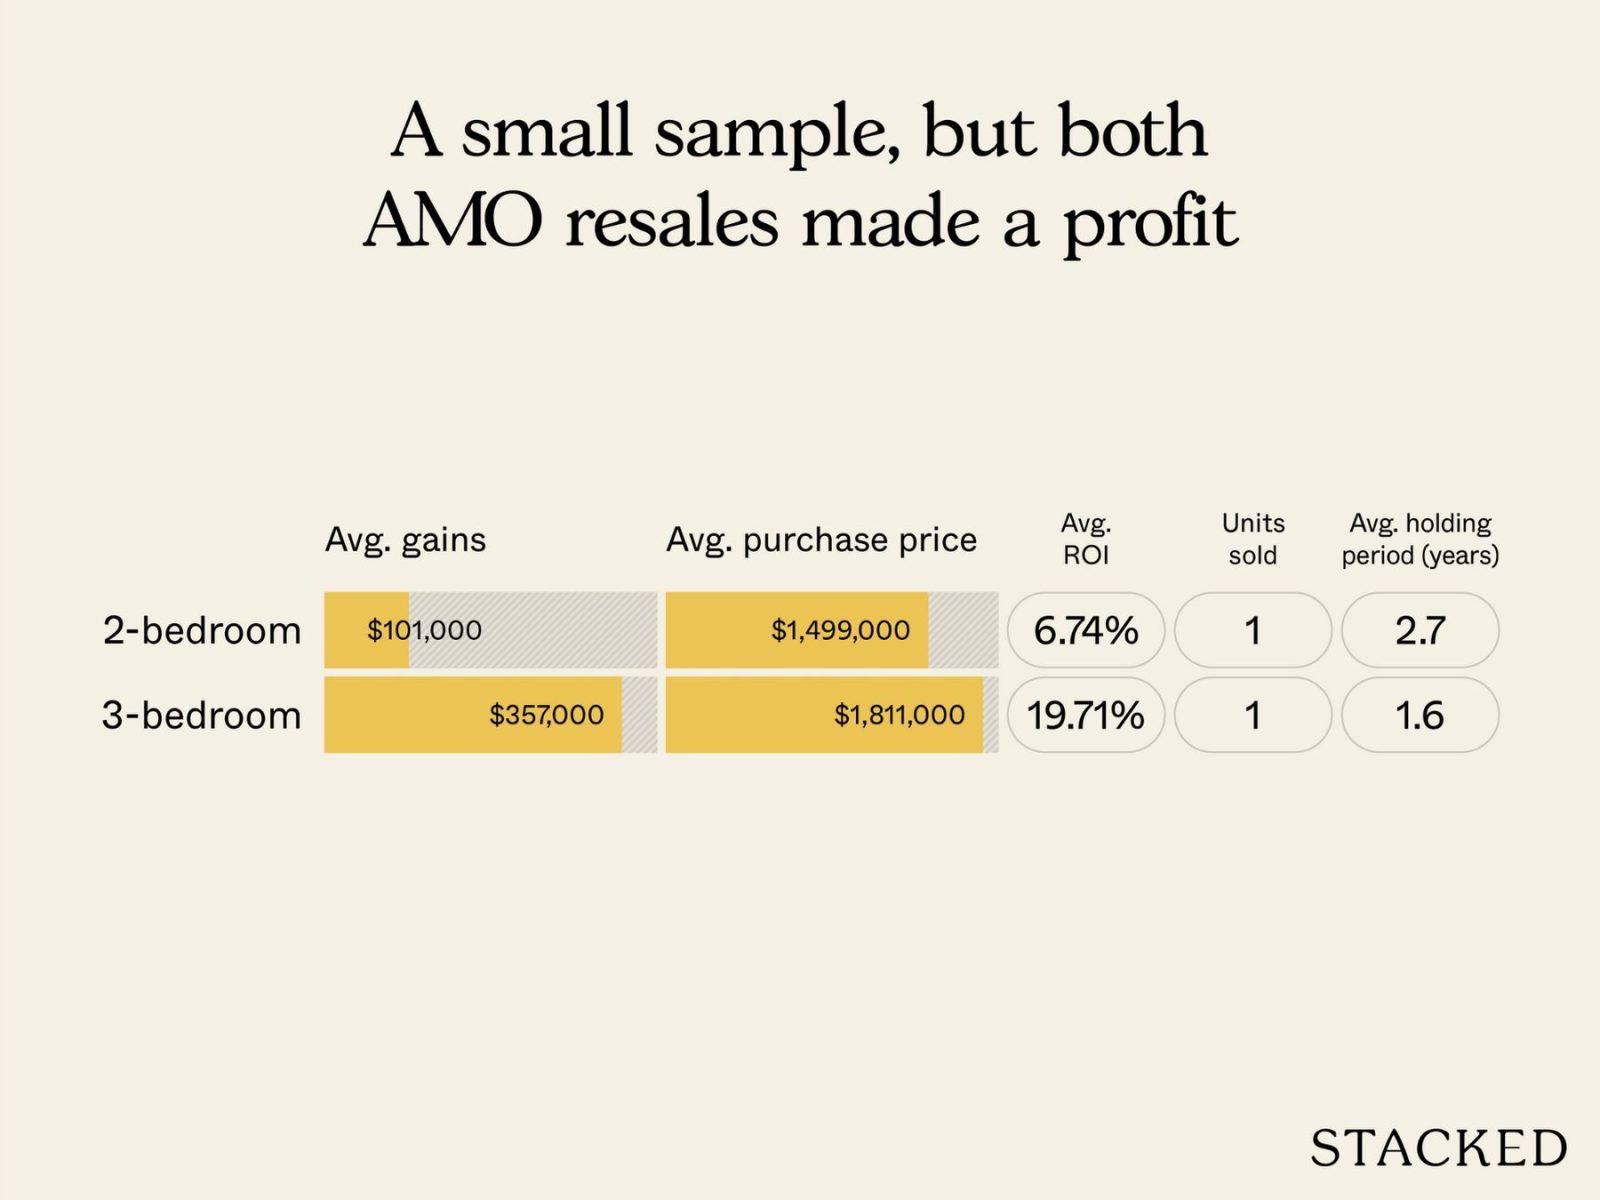
While it’s too early to draw conclusions yet, here’s what some realtors have told us to expect:
The broader D20 market has been lifted in recent years by new launches and resale activity in the Lentor area, as well as by established projects such as Jadescape. These have transacted at higher average $PSF levels, pulling up the district benchmark. So it won’t be too much of a surprise if AMO Residence is trailing or just keeping pace, within a short time of its TOP next year.
Older developments like The Panorama and Grandeur 8 have also seen sharper price increases, likely benefiting from renewed attention toward the Lentor estate; so this also contributes to it.
Conclusion:
A common trend across all five projects is that larger unit types have generally achieved stronger performance. Nonetheless, realtors note that market preferences are also shifting: many new launches now devote 40 per cent or more of their mix to two-bedders, reflecting growing demand from small families and dual-income households.
As this happens, the traditional three-bedder is gradually giving way to the four-bedder as the new family benchmark - a sign of how both buyer expectations and income levels have evolved.
Timing also plays a role here. In the aftermath of COVID, a housing supply crunch drove prices up across the board; as such, all of the condos launched in time to catch this wave have performed well. For that reason, a clearer picture of true performance will only emerge further down the road.
At Stacked, we like to look beyond the headlines and surface-level numbers, and focus on how things play out in the real world.
If you'd like to discuss how this applies to your own circumstances, you can reach out for a one-to-one consultation here.
And if you simply have a question or want to share a thought, feel free to write to us at stories@stackedhomes.com. We read every message.





0 Comments