


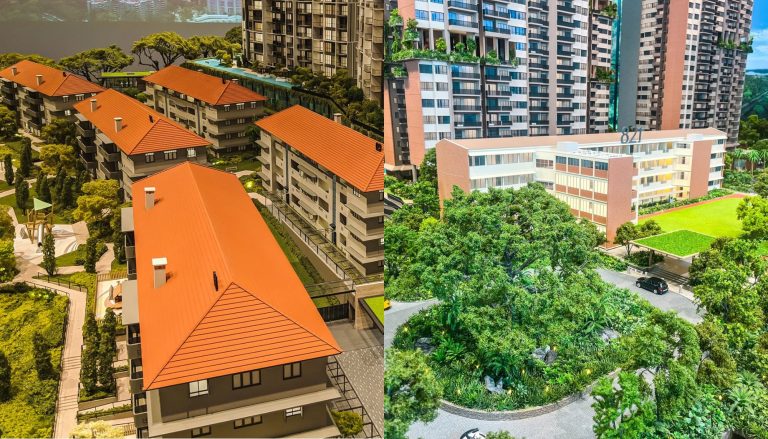


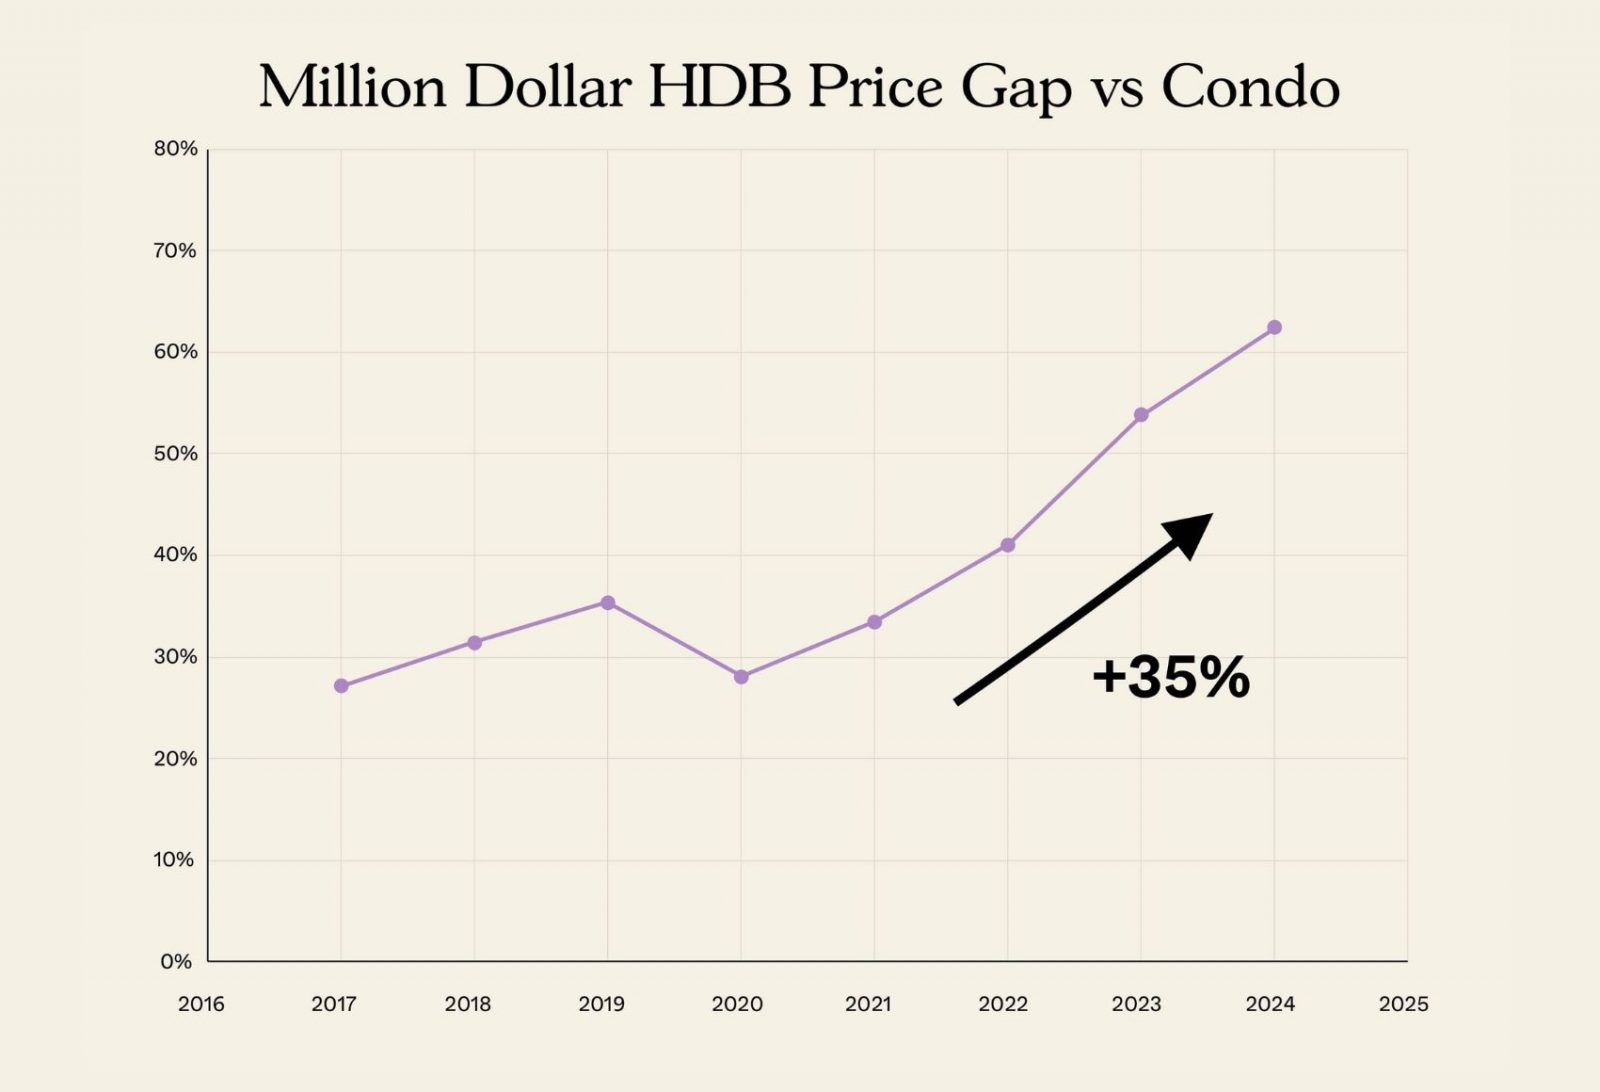
You’ve all heard the disgruntled comments by now: with flats costing a million bucks, you may as well buy a condo. Or that joke about how, 20 years from now, you will end up having to sell a condo to afford a flat. But it is true that, in the current market, some people are now choosing between, say, a smaller mass-market condo and a big central area resale flat. On top of that, looking at the price gap between million-dollar flats and condos can provide an interesting perspective of today’s property market – so that’s just what we did:
Market commentary like this is only useful if you can translate it into what it means for your own purchase: your entry price, holding period and exit options.
That's where many buyers get stuck. General market insights rarely tell you whether a specific unit, at a specific price, is the right decision for your circumstances.
Over time, that's also why we decided to work with agents who shared the same data-driven and advisory-led approach behind our editorial, consultants who could help readers think through decisions more objectively, rather than simply push transactions.
Today, the team has worked with more than 2,000 clients across over $5B in property transactions.
A few points on our comparison
We looked at both freehold and leasehold non-landed private homes, for the purposes of comparison. However, we limited the size to 105 to 122 sqm, as this is roughly comparable to most 5-room flats. It’s also the most practical size to look at, as this is the likely point of comparison for buyers choosing between a flat or condo.
Also note that we’ve equated the downtown core with the Central Area in our comparison, and Kallang with Kallang/Whampoa town; these closely correspond to the appropriate areas designated by HDB.
As the price gaps vary significantly based on location, an island-wide price gap isn’t too useful. Rather, let’s look at the price gap between condos and resale flats, in specific parts of Singapore:
Condo prices in the various planning areas:
| Planning Area | 2017 | 2018 | 2019 | 2020 | 2021 | 2022 | 2023 | 2024 |
| Ang Mo Kio | $1,105,177 | $1,212,472 | $1,263,979 | $1,291,438 | $1,345,388 | $1,591,630 | $1,614,354 | $1,777,192 |
| Bedok | $1,200,531 | $1,302,548 | $1,348,427 | $1,309,620 | $1,426,684 | $1,543,279 | $1,711,868 | $1,834,017 |
| Bishan | $1,387,228 | $1,535,762 | $1,547,156 | $1,527,516 | $1,647,247 | $1,831,505 | $2,036,157 | $2,053,447 |
| Bukit Batok | $1,109,110 | $1,184,060 | $1,238,560 | $1,191,977 | $1,286,490 | $1,428,529 | $1,607,527 | $1,663,696 |
| Bukit Merah | $1,688,408 | $2,035,871 | $1,899,270 | $1,888,441 | $1,903,310 | $2,043,473 | $2,189,667 | $2,175,220 |
| Bukit Panjang | $1,156,833 | $1,258,171 | $1,313,907 | $1,249,181 | $1,375,819 | $1,511,408 | $1,729,123 | $1,751,222 |
| Bukit Timah | $1,482,891 | $1,790,438 | $1,734,932 | $1,761,159 | $1,837,957 | $2,089,534 | $2,132,393 | $2,297,697 |
| Clementi | $1,287,822 | $1,351,153 | $1,405,646 | $1,414,179 | $1,526,956 | $1,679,437 | $1,826,710 | $1,885,085 |
| Downtown Core | $2,096,807 | $2,824,892 | $2,967,518 | $2,756,107 | $2,604,322 | $2,610,048 | $2,361,547 | $2,366,929 |
| Geylang | $1,225,892 | $1,353,941 | $1,386,659 | $1,386,743 | $1,459,703 | $1,575,961 | $1,784,027 | $1,801,212 |
| Hougang | $1,106,317 | $1,184,990 | $1,220,660 | $1,192,692 | $1,231,367 | $1,389,217 | $1,529,692 | $1,622,481 |
| Jurong East | $1,059,243 | $1,063,321 | $1,078,423 | $1,146,310 | $1,164,452 | $1,254,245 | $1,340,468 | $1,430,308 |
| Kallang | $1,463,522 | $1,592,777 | $1,553,138 | $1,520,383 | $1,626,097 | $1,781,432 | $2,016,116 | $2,039,187 |
| Marine Parade | $1,991,455 | $1,808,351 | $1,867,660 | $1,875,274 | $1,949,187 | $2,133,274 | $2,360,631 | $2,433,658 |
| Pasir Ris | $964,002 | $1,040,385 | $1,058,081 | $1,086,084 | $1,142,595 | $1,273,275 | $1,377,973 | $1,506,768 |
| Punggol | $1,114,712 | $1,181,877 | $1,193,368 | $1,188,321 | $1,282,534 | $1,463,804 | $1,606,673 | $1,690,481 |
| Queenstown | $1,355,238 | $1,533,111 | $1,508,151 | $1,482,627 | $1,603,988 | $1,758,458 | $1,924,247 | $2,010,186 |
| Sengkang | $983,433 | $1,083,712 | $1,107,473 | $1,083,389 | $1,195,734 | $1,414,615 | $1,531,348 | $1,604,445 |
| Serangoon | $1,312,272 | $1,429,349 | $1,336,573 | $1,331,998 | $1,493,508 | $1,693,383 | $1,816,878 | $2,049,059 |
| Tampines | $979,830 | $1,070,066 | $1,086,597 | $1,073,578 | $1,167,539 | $1,309,871 | $1,462,188 | $1,561,649 |
| Toa Payoh | $1,456,660 | $1,535,004 | $1,583,056 | $1,587,169 | $1,691,029 | $1,778,669 | $2,000,539 | $2,102,471 |
| Woodlands | $815,790 | $842,230 | $817,198 | $818,915 | $953,585 | $1,116,586 | $1,213,753 | $1,236,432 |
| Yishun | $878,467 | $952,057 | $977,649 | $979,125 | $1,059,583 | $1,211,410 | $1,345,739 | $1,425,399 |
Resale flat prices in various HDB towns
| HDB Estate | 2017 | 2018 | 2019 | 2020 | 2021 | 2022 | 2023 | 2024 |
| Ang Mo Kio | $1,019,444 | $1,050,978 | $1,055,593 | $1,085,082 | $1,109,858 | |||
| Bedok | $1,050,259 | $1,030,543 | $1,064,185 | |||||
| Bishan | $1,036,457 | $1,052,241 | $1,043,818 | $1,097,341 | $1,105,178 | $1,151,658 | $1,143,548 | $1,211,908 |
| Bukit Batok | $1,005,000 | $1,031,722 | $1,020,267 | |||||
| Bukit Merah | $1,056,127 | $1,074,378 | $1,062,607 | $1,086,887 | $1,088,533 | $1,134,730 | $1,125,401 | |
| Bukit Panjang | $1,020,000 | $1,003,894 | ||||||
| Bukit Timah | $1,016,944 | $1,032,000 | $1,019,333 | $1,086,692 | $1,205,658 | $1,187,571 | $1,213,334 | |
| Clementi | $1,030,000 | $1,068,000 | $1,038,000 | $1,012,519 | $1,041,489 | $1,078,318 | $1,110,416 | $1,126,706 |
| Central Area | $1,065,400 | $1,066,315 | $1,065,564 | $1,114,231 | $1,091,769 | $1,180,731 | $1,249,096 | $1,343,227 |
| Geylang | $1,008,888 | $1,032,984 | $1,047,318 | $1,045,185 | ||||
| Hougang | $1,000,000 | $1,052,778 | $1,040,200 | $1,058,035 | ||||
| Jurong East | $1,000,000 | $1,010,667 | $1,033,972 | |||||
| Kallang/Whampoa | $1,002,500 | $1,069,568 | $1,109,000 | $1,120,000 | $1,117,563 | $1,104,949 | $1,088,081 | $1,067,157 |
| Marine Parade | $1,039,629 | $1,011,778 | $1,157,972 | |||||
| Pasir Ris | $1,188,444 | $1,000,000 | $1,020,750 | |||||
| Punggol | $1,198,000 | $1,185,000 | $1,184,256 | |||||
| Queenstown | $1,058,200 | $1,055,681 | $1,070,876 | $1,053,563 | $1,085,927 | $1,136,947 | $1,106,245 | $1,123,915 |
| Sengkang | $1,001,667 | |||||||
| Serangoon | $1,000,000 | $1,024,072 | $1,061,659 | $1,067,059 | $1,108,994 | |||
| Tampines | $1,007,051 | $1,012,500 | $1,036,289 | |||||
| Toa Payoh | $1,043,967 | $1,059,876 | $1,055,361 | $1,060,825 | $1,091,214 | $1,118,003 | $1,126,720 | $1,132,377 |
| Woodlands | $1,029,422 | $1,047,349 | $1,039,400 | |||||
| Yishun | $1,035,878 | $1,062,450 | $1,048,571 |
Overall price gaps between HDB and condos
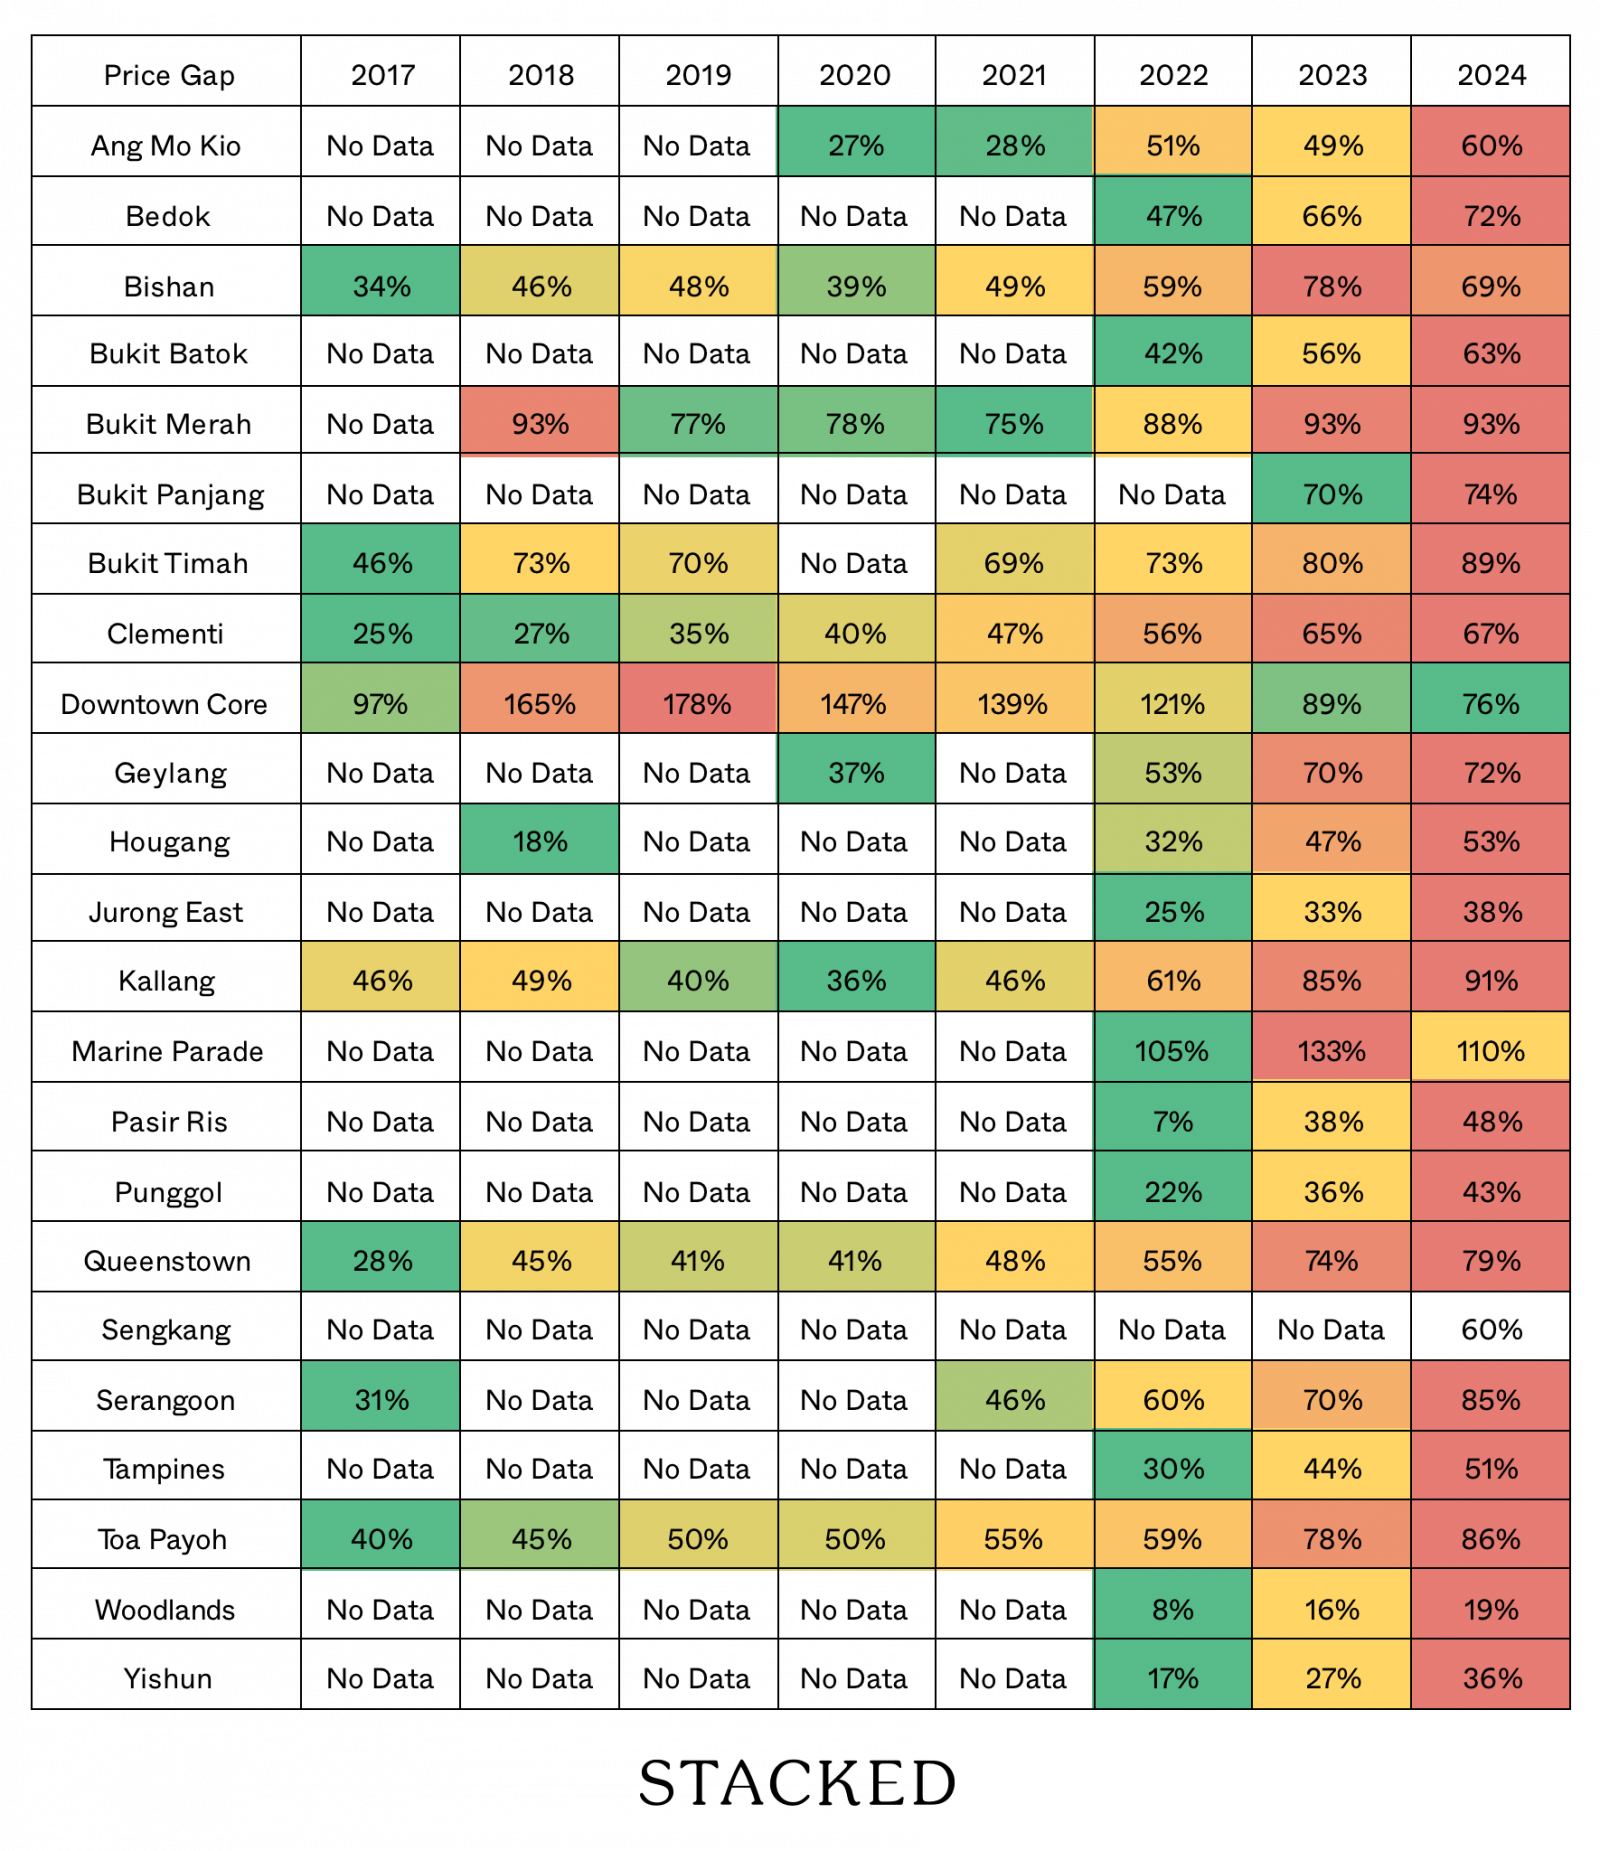
So here’s an interesting but perhaps not very surprising revelation: The price gap has widened in most areas. This means that, despite the number of flats reaching million-dollar prices, private properties have appreciated even faster.
While resale flat prices may have seen strong appreciation during Covid, it was due to a supply crunch that affected both public and private housing. So condo prices rose right alongside their HDB counterparts.
What if we only compared leasehold condos to million-dollar flats?
There’s some legitimacy to the argument that, because flats are 99-year lease homes, they should be compared to leasehold condos. Also, most HDB upgraders are probably considering condos in the OCR, which are overwhelmingly going to be leasehold. So let’s look at that:
Leasehold condo prices by area
| Planning Area | 2017 | 2018 | 2019 | 2020 | 2021 | 2022 | 2023 | 2024 |
| Ang Mo Kio | $1,035,770 | $1,100,661 | $1,154,970 | $1,174,997 | $1,286,831 | $1,531,954 | $1,546,521 | $1,672,214 |
| Bedok | $1,148,463 | $1,250,803 | $1,287,739 | $1,254,329 | $1,336,975 | $1,488,645 | $1,633,841 | $1,798,959 |
| Bishan | $1,389,956 | $1,532,500 | $1,541,443 | $1,508,634 | $1,645,428 | $1,827,812 | $2,038,676 | $2,049,629 |
| Bukit Batok | $943,377 | $981,229 | $996,559 | $991,456 | $1,036,899 | $1,199,318 | $1,319,314 | $1,368,433 |
| Bukit Merah | $1,664,885 | $2,028,103 | $1,897,815 | $1,868,613 | $1,893,194 | $2,021,212 | $2,131,866 | $2,174,616 |
| Bukit Panjang | $1,122,537 | $1,290,288 | $1,285,115 | $1,225,956 | $1,335,684 | $1,484,975 | $1,658,649 | $1,697,240 |
| Bukit Timah | $1,274,358 | $1,677,797 | $1,587,194 | $1,597,192 | $1,705,691 | $1,919,225 | $2,040,807 | $2,260,300 |
| Clementi | $1,186,615 | $1,242,781 | $1,253,092 | $1,297,950 | $1,436,218 | $1,579,595 | $1,761,131 | $1,778,606 |
| Downtown Core | $2,096,807 | $2,865,163 | $2,967,518 | $2,768,022 | $2,604,322 | $2,610,048 | $2,361,547 | $2,366,929 |
| Geylang | $1,284,423 | $1,326,778 | $1,447,559 | $1,361,883 | $1,502,007 | $1,612,841 | $1,922,804 | $1,889,396 |
| Hougang | $1,075,584 | $1,122,130 | $1,195,157 | $1,153,593 | $1,191,817 | $1,347,973 | $1,504,341 | $1,625,283 |
| Jurong East | $1,059,243 | $1,063,321 | $1,078,423 | $1,146,310 | $1,164,452 | $1,254,245 | $1,340,468 | $1,430,308 |
| Kallang | $1,366,800 | $1,613,040 | $1,663,533 | $1,428,732 | $1,505,094 | $1,663,155 | $1,949,323 | $1,992,222 |
| Marine Parade | $1,640,231 | $1,801,333 | $1,607,600 | $1,793,923 | $1,760,533 | $2,059,643 | $2,409,375 | $2,508,333 |
| Pasir Ris | $958,433 | $1,031,474 | $1,048,713 | $1,098,550 | $1,141,226 | $1,274,187 | $1,381,015 | $1,505,301 |
| Punggol | $1,114,712 | $1,181,877 | $1,193,368 | $1,188,321 | $1,282,534 | $1,463,804 | $1,606,673 | $1,690,481 |
| Queenstown | $1,357,335 | $1,486,123 | $1,489,264 | $1,511,438 | $1,623,597 | $1,774,426 | $1,947,486 | $2,005,017 |
| Sengkang | $983,433 | $1,083,712 | $1,107,473 | $1,083,389 | $1,195,734 | $1,414,615 | $1,531,348 | $1,604,445 |
| Serangoon | $1,200,930 | $1,332,762 | $1,284,959 | $1,295,094 | $1,444,284 | $1,627,018 | $1,806,951 | $1,993,613 |
| Tampines | $962,129 | $1,053,295 | $1,069,145 | $1,064,425 | $1,156,464 | $1,303,321 | $1,458,551 | $1,566,037 |
| Toa Payoh | $1,439,856 | $1,551,907 | $1,555,316 | $1,569,696 | $1,698,573 | $1,768,408 | $1,997,751 | $2,095,462 |
| Woodlands | $815,790 | $842,230 | $817,198 | $818,915 | $953,585 | $1,116,586 | $1,213,753 | $1,236,432 |
| Yishun | $878,467 | $941,947 | $977,649 | $975,983 | $1,051,478 | $1,211,515 | $1,345,739 | $1,422,760 |
Price gap by area, comparing only against leasehold condos
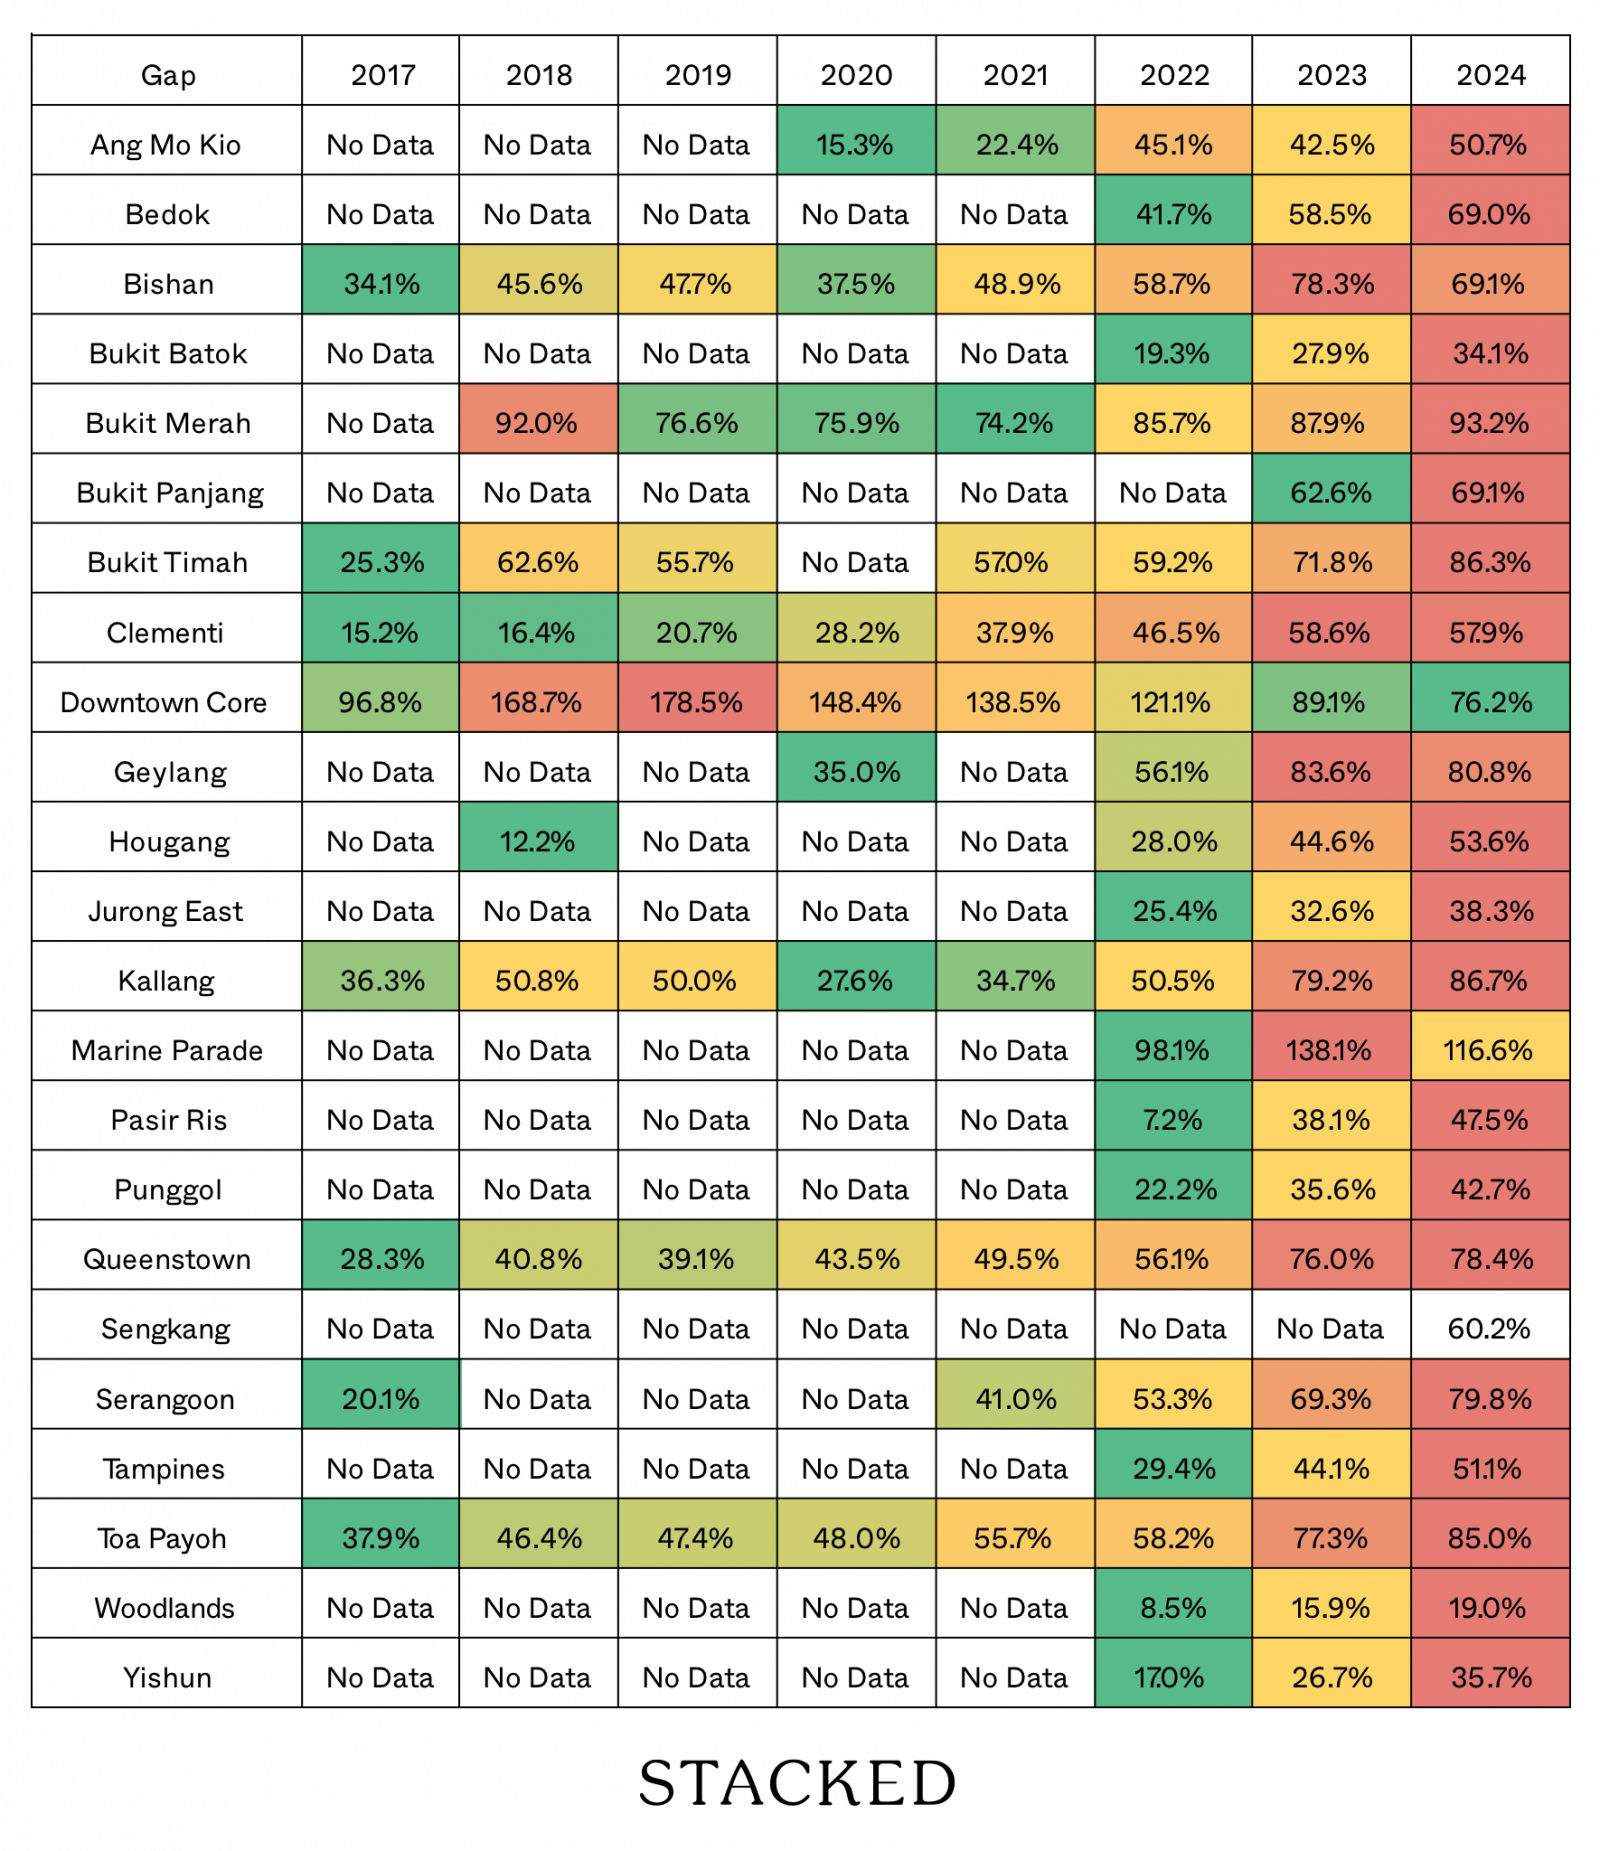
Note that there are much fewer leasehold condos in prime areas like Orchard, Marina, etc., which may distort the overall picture for central area properties.
The result is not different, with the gap between million-dollar flats and condos having widened over the past few years. The gap grew much wider between 2023 and 2024 in particular, within the context of leasehold properties.
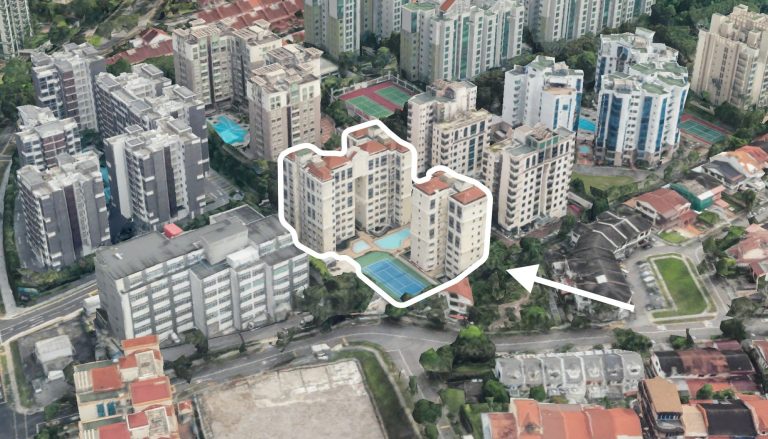
This may explain the recent spate of million-dollar flats
Consider an HDB upgrader who has sold their flat, and seen substantial profits. Due to the wider price gap, they’re still unable to comfortably upgrade to a condo (at least one that’s of the size and quality they desire.)
The next logical step up for these buyers (besides Executive Condos which aren’t always available) might just be to get a more luxurious flat. Rather than take out another big mortgage for a mass-market OCR condo, they might turn their gaze toward maisonettes, jumbo flats, or flats in prime locations like Queenstown, Bishan, Toa Payoh, etc.
Spaciousness and a convenient location can make up for the loss of facilities, while the lower quantum also means a smaller debt obligation.
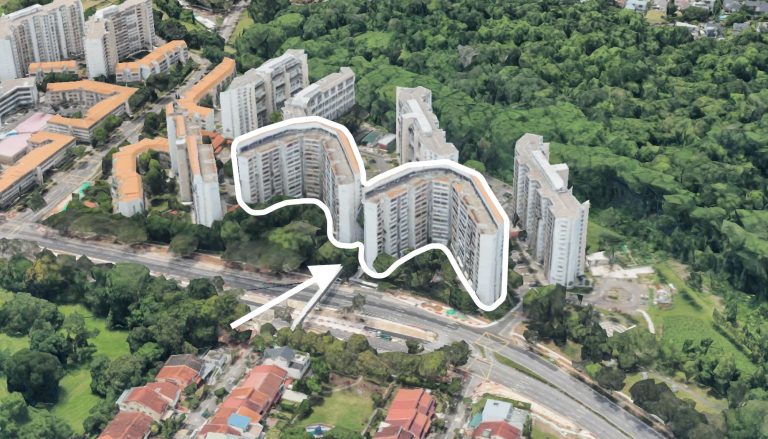
As an interesting aside, note that the lowest price gap appears to be in Woodlands!
It’s hard to be certain why this is, but the reason may be the number of bigger flats in Woodlands. This area has a lot of adjoined flats, executive flats, jumbo units, etc. When compared to condos in the area (which have also tended to be cheaper), it may explain the narrower price gap.
We’ve included some data on the unit sizes here:
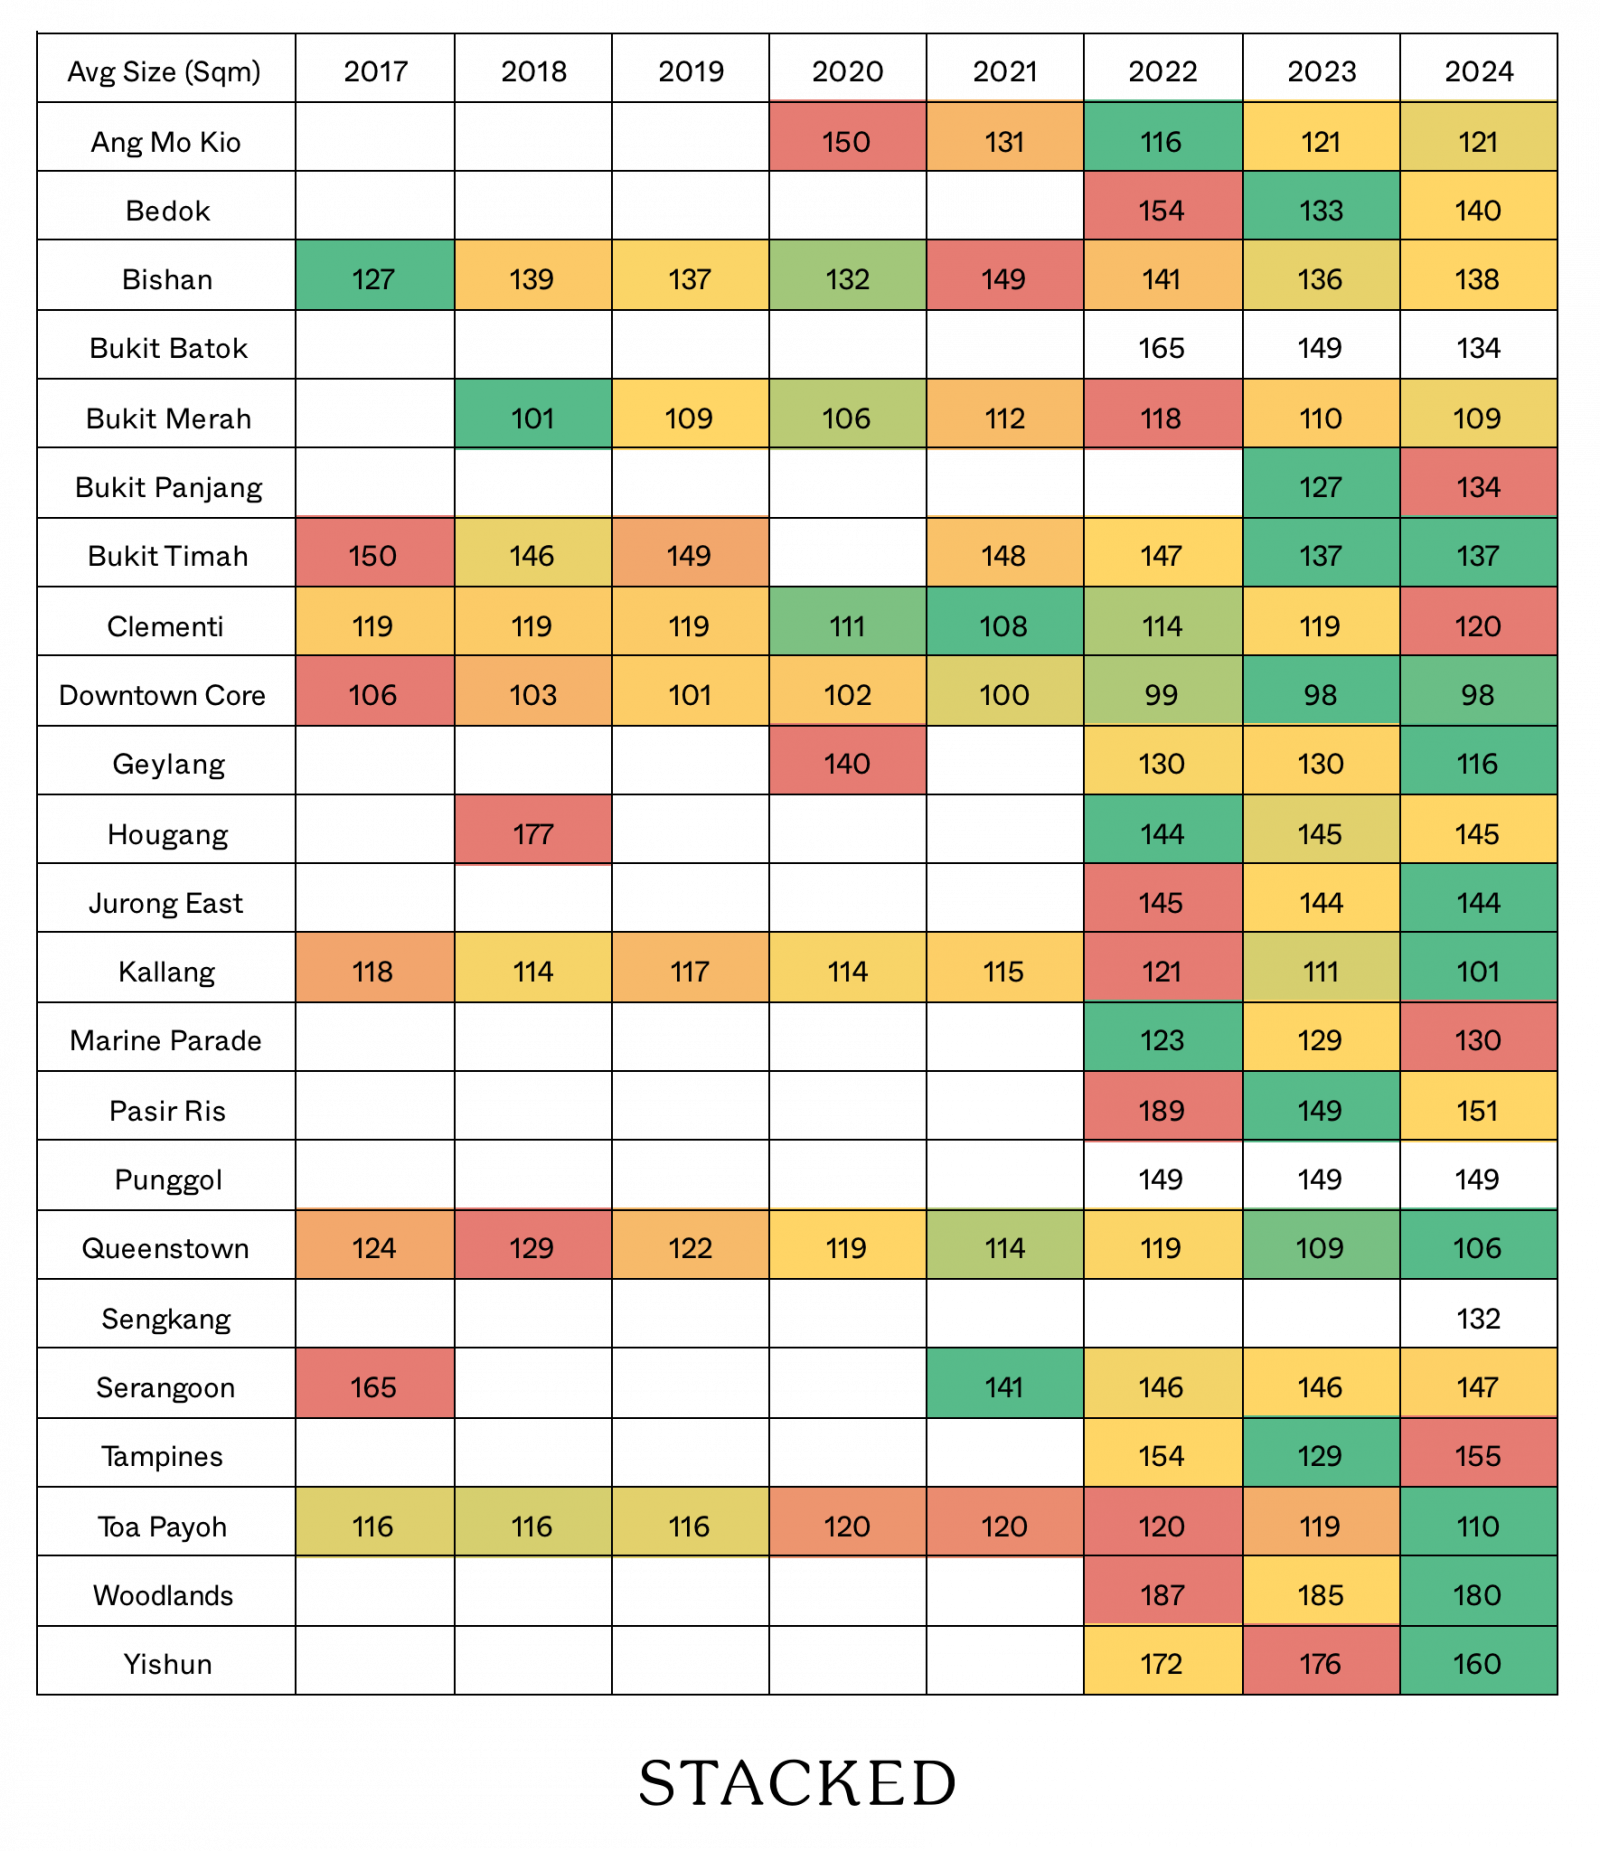
We’ve taken the average flat size transacted for that year, and it seems that in most cases, 2023/24 saw smaller flat sizes on average. This could also be another reason why the price gap is widening. It’s also worth noting that flat sizes included in the transactions in Woodlands did not vary that much, recording a lower average in 2024 than in the preceding years.
From what we’ve seen, we can draw two general conclusions:
First, it’s tougher to upgrade to a condo in 2024, and it’s been tougher since a few years ago. This may drive more upgraders to look at bigger or more central flats, rather than choosing a condo as the next stop on their property journey. This could maintain higher resale flat prices in the near to mid-term, and more million-dollar flats.
Second, this is something that still doesn’t affect most HDB buyers, as seen also by the recent cooling measures. That said, it is also an issue of optics, as these are the headlines most people see each day. As we’ve mentioned previously, such prices will eventually form a sticky price anchor in people’s minds – and it won’t be long before we see every single estate in Singapore that has reached the million-dollar HDB club.
Commentary like this is useful for understanding the broader market. The harder part is applying those ideas to a specific property, budget or decision you’re actually considering.
That’s often where a second opinion becomes valuable.
If you’d like to discuss how this applies to your own circumstances, you can reach out for a one-to-one consultation here.
And if you simply have a question or want to share a thought, feel free to write to us at stories@stackedhomes.com. We read every message.

2 Comments
The 2nd table in the article “Resale HDB prices” is missing; instead the Condo prices by region has been duplicated there.