
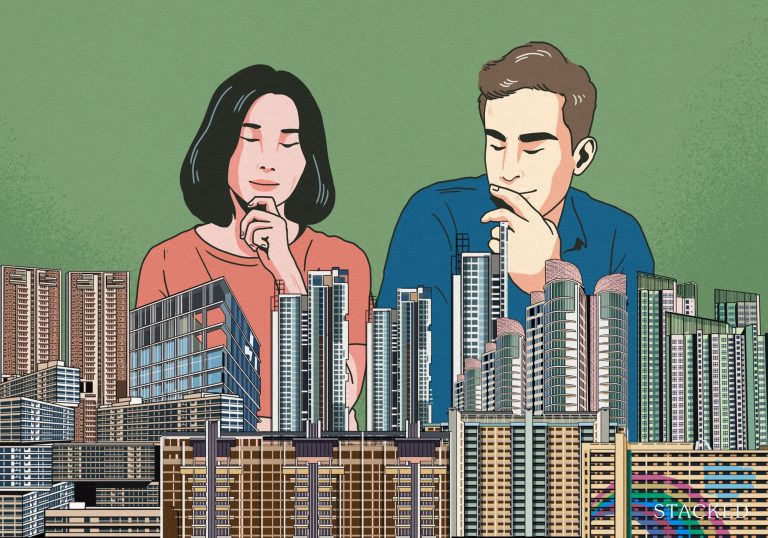


The phrase “I’ll wait and buy later when prices fall” draws a lot of cynicism these days, and there’s a lot of precedent behind it: most of the time, people who wait end up paying more. While a handful do really manage to buy lower, they’re often in the minority. This has led many to wonder: when do property prices in Singapore drop, and what are the odds of timing the market for the dip? This week, we’ll go over the entire timeline to take a closer look:
The challenge for many buyers today isn't access to information.
It's interpreting that information in a way that makes sense for their finances, goals, and stage of life.
Over time, that's also why we decided to work with agents who shared the same data-driven and advisory-led approach behind our editorial, consultants who could help readers think through decisions more objectively, rather than simply push transactions.
Today, the team has worked with more than 2,000 clients across over $5B in property transactions.
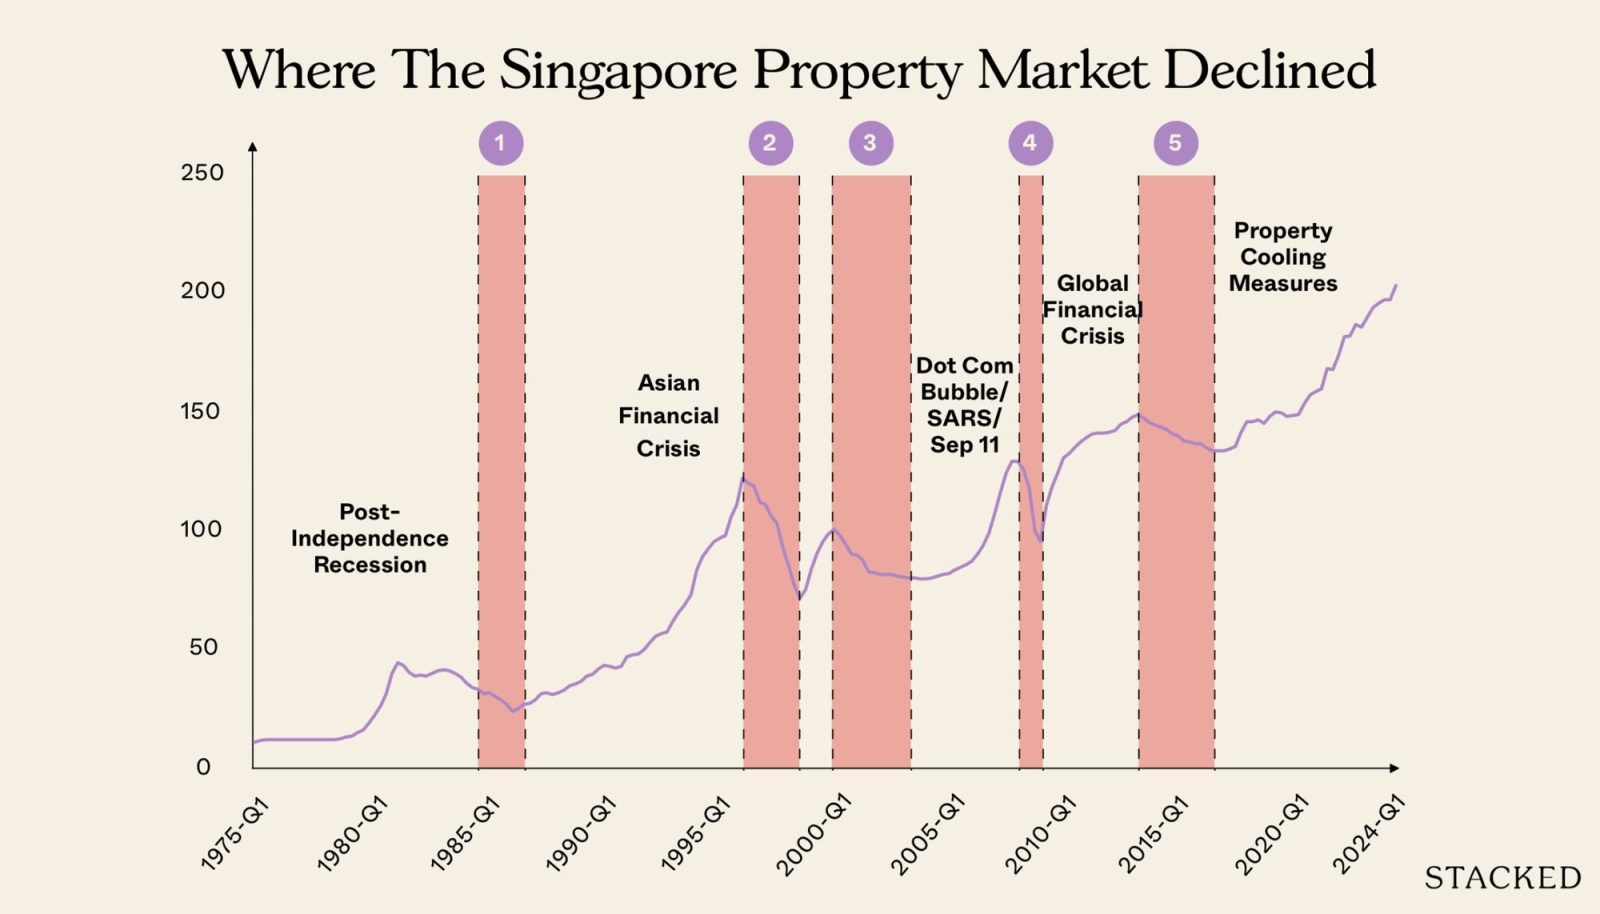
Times when Singapore property prices actually fell

Notable times when Singapore property prices fell
The most notable time periods are the following:
1. (1985 – 1989) Lead up to the first post-independence recession
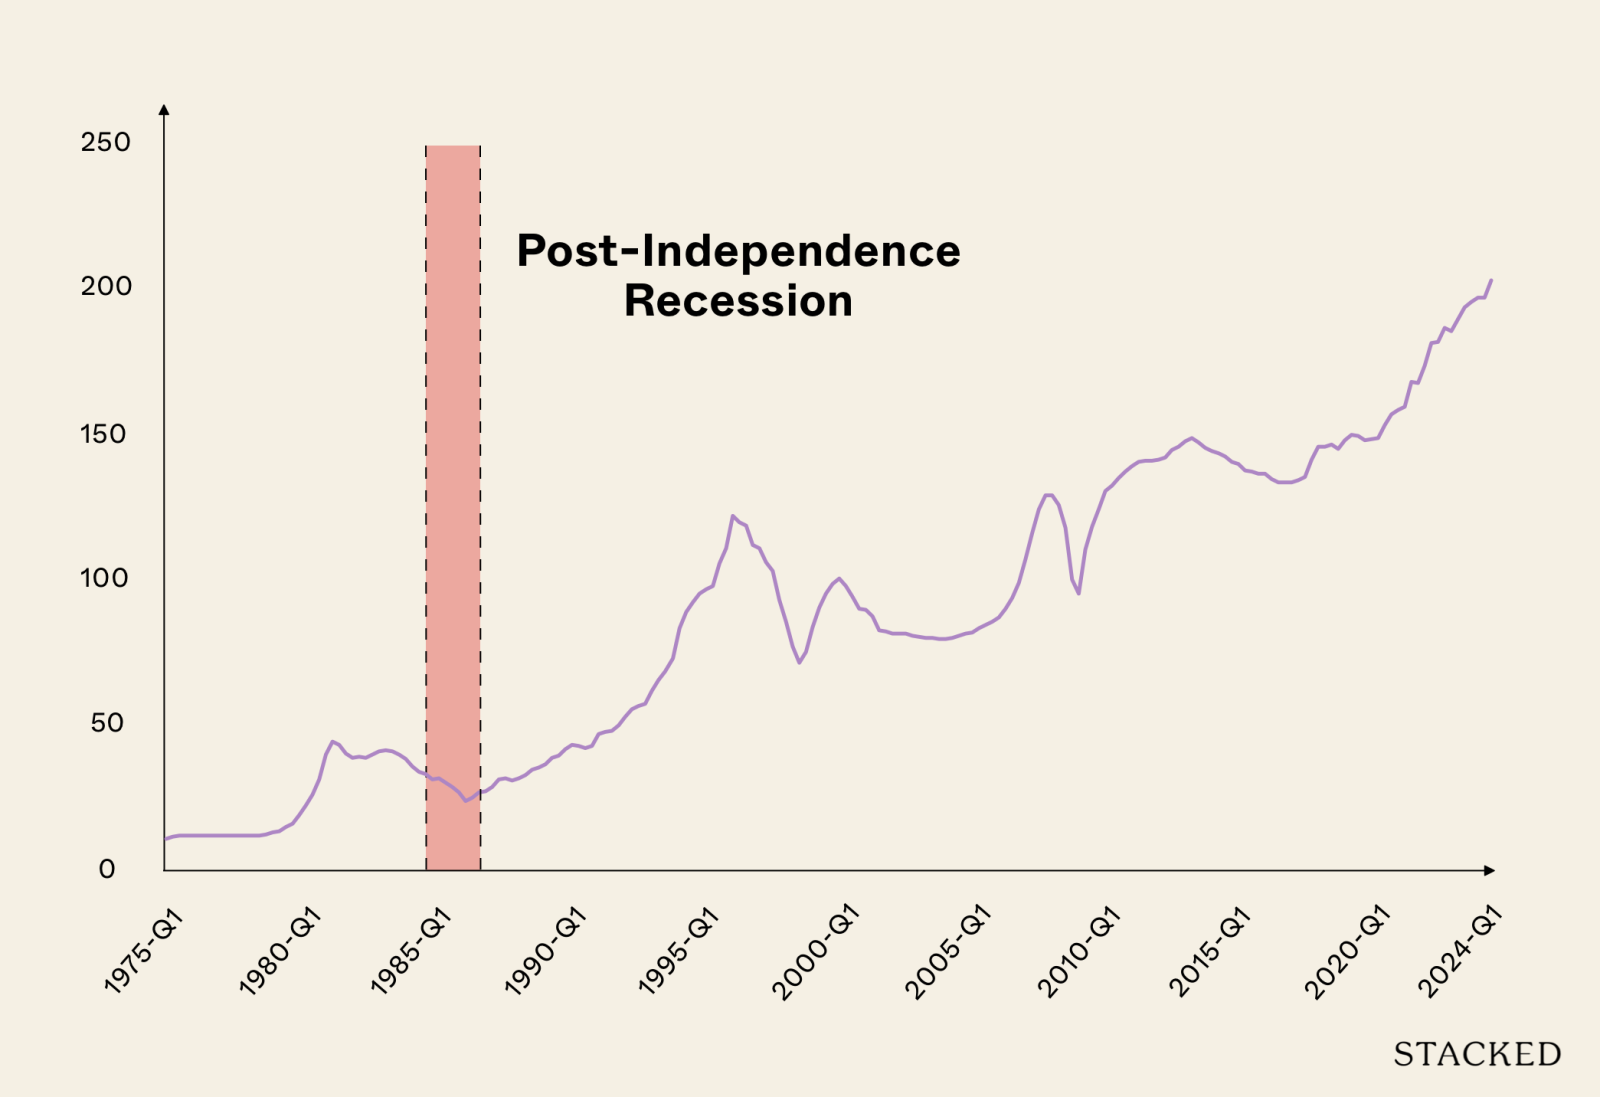
Caveat: Singapore’s property market was much less transparent in the 1980s: this was a pre-Internet industry, where most properties were sold and bought via word-of-mouth marketing. As such, we can’t be absolutely certain of the factors involved.
Until the Approved Residential Properties Scheme (ARPS) in 1981, you couldn’t use your CPF at all for non-HDB properties. Once this rule was changed, it resulted in a sudden surge in home prices. At the time, we didn’t have the experience to quickly intervene and stop a bubble from forming, and this led to a price peak in 1981, followed by a huge market correction that stretched all the way to 1986.
This was compounded by saturation in the construction industry by 1984, which reflects the overabundance of projects leading up to our first post-independence recession.
However, not all the factors were related to property loans and CPF use: Singapore was also affected by wider economic concerns at the time, which also hampered the property market due to retrenchments and falling wages.
A key highlight here is the long period needed for recovery. You’ll notice that in subsequent eras, the recovery period for property prices became much shorter (in this post-independence recession, it took 20 consecutive quarters before we saw a real recovery). This was also likely due to the property market operating at a slower pace in the ‘80s: there were no property portals or instant price checks, and less clarity in property investing.
2. (1996 – 1998) Property cooling measures as experienced for the first time
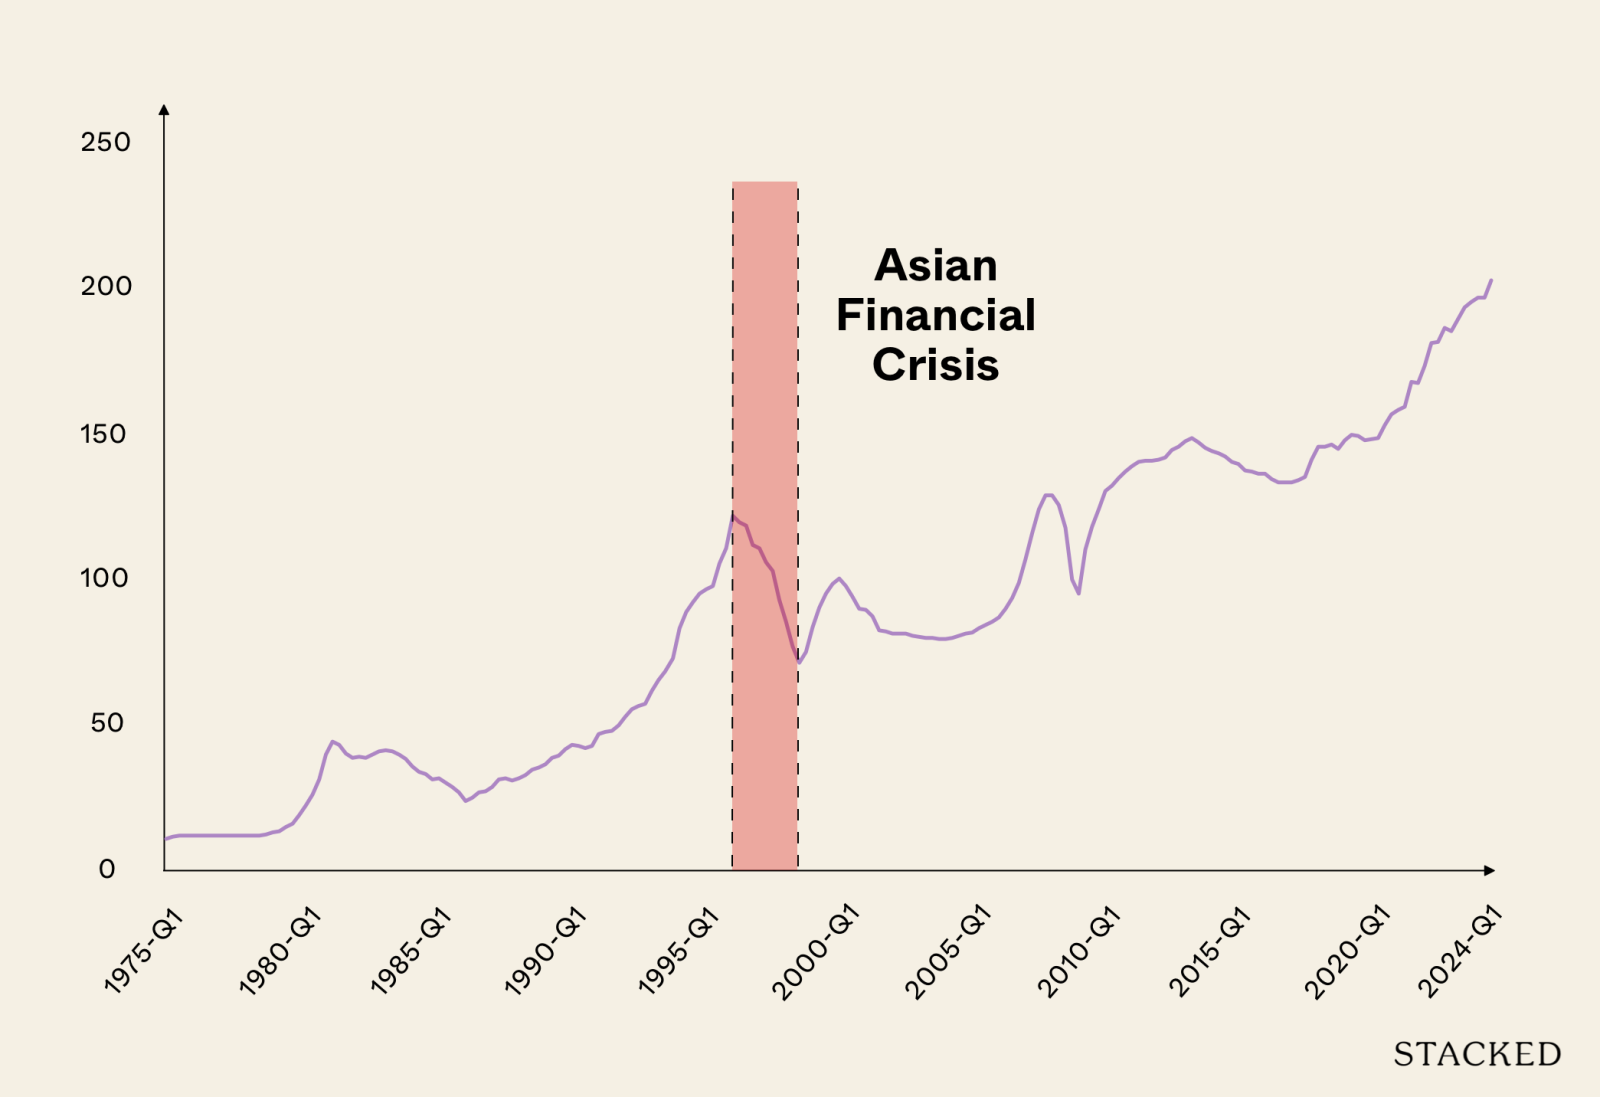
The next property peak was in Q2 1996, when the PPI rose by 98.7 points. This was followed by the first property cooling measures, and while they look tame by today’s standards, they were a big deal at the time.
First, the government introduced an early version of Sellers Stamp Duty (SSD): this was a capital gains tax on the profits of property sales, if the sale occurred within three years of the initial purchase; but it was a short lived measure that was removed in 2001.
This is different from the actual SSD today, which was introduced in 2010 – today SSD takes a percentage of the sale proceeds: 12 per cent if sold within one year, eight per cent on the second year, and four per cent on the third year.
Second, the government capped the Loan To Value (LTV) ratio for property loans at 80 per cent of property value. Third, the government prohibited foreigners from getting home loans denominated in Singapore dollars.
(Today, the LTV is even lower at 75 per cent, and while foreigners can take SGD home loans, they face an even harsher 60 per cent Additional Buyers Stamp Duty or ABSD).
Just as these measures began to bite, the Asian Financial Crisis erupted in mid-1997. A wave of currency devaluations led to a fall in investor confidence, and an extremely tough job market. Combined with the existing cooling measures, it worsened the property downturn in Singapore.
This time though, the down market lasted even shorter: only around 10 quarters, with a 51-point drop in the PPI. This caused a recovery for about six quarters, before reaching another peak in Q2 2000 (albeit a lower peak than 1996).
3. (2000 – 2004) The Dot Com bubble, 9/11, and SARS
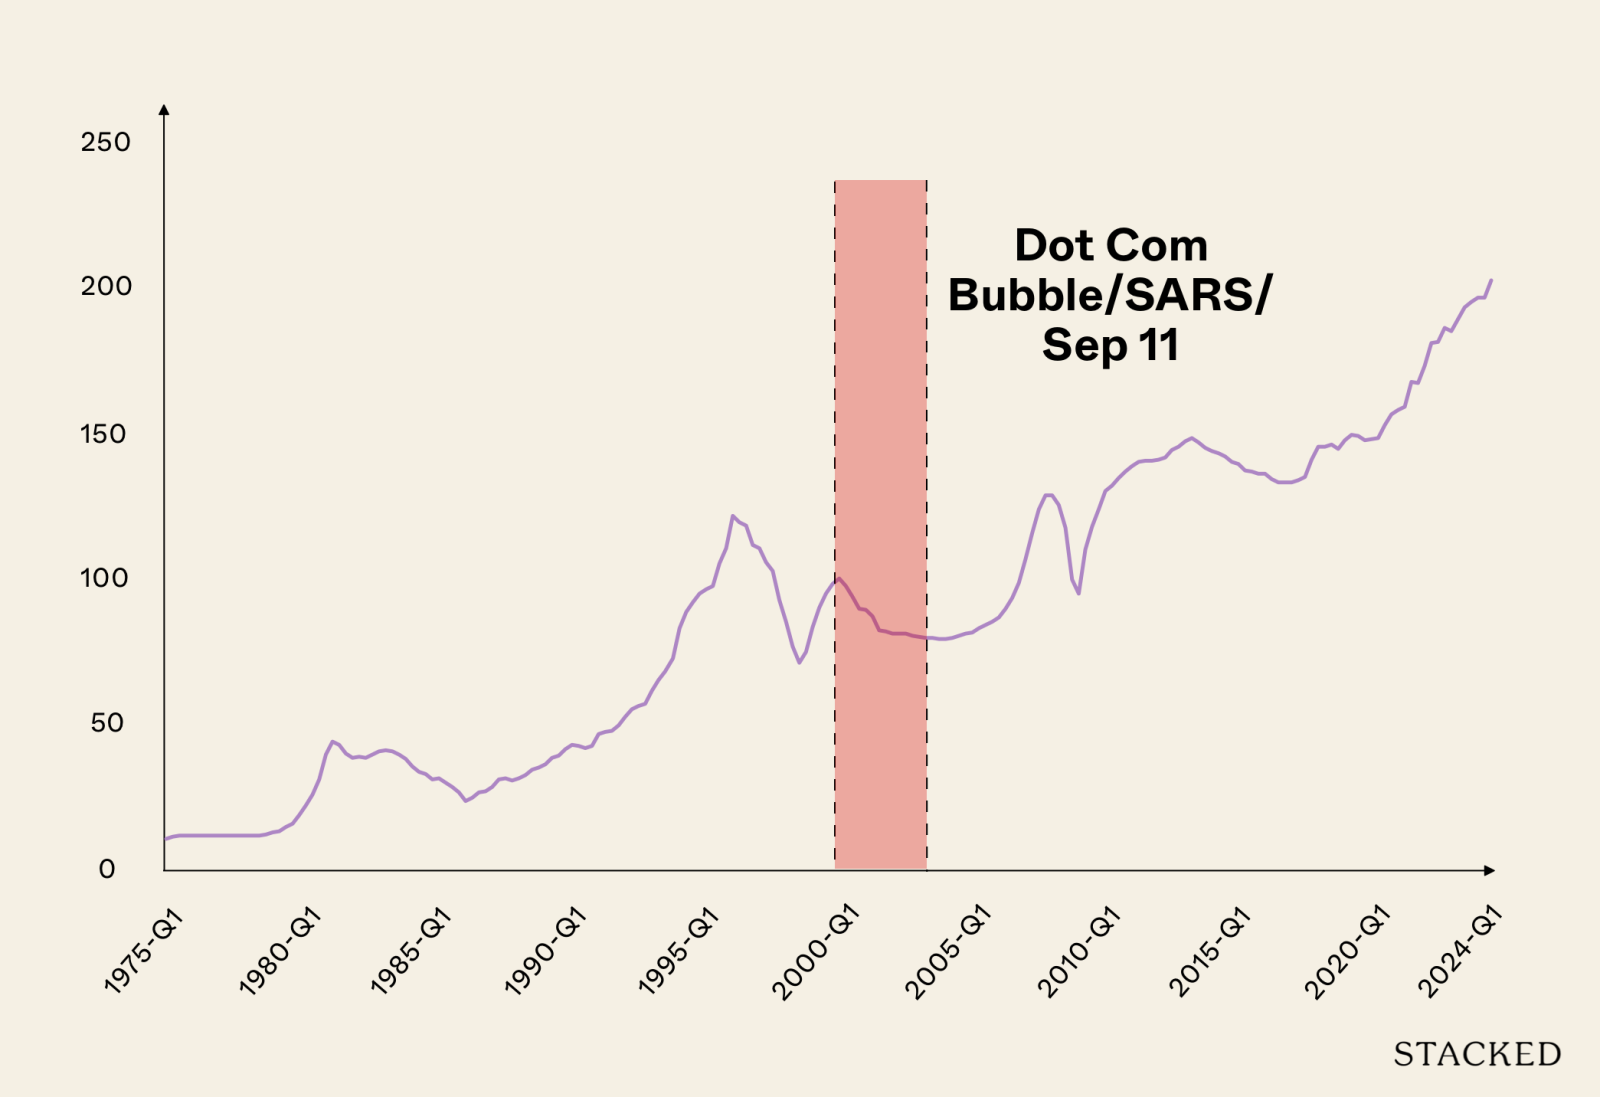
The collapse of the tech bubble around 2000 triggered a global recession. This was aggravated by the September 11th terrorist attacks in 2001. In that year, Singapore’s GDP shrank by 2.4 per cent, and instability in the job market caused many upgraders to back out.
This reversed the previous recovery, and from Q3 2000 to Q2 2004, prices declined again over 16 quarters, with the PPI falling by 20.8 points. This time, the recovery took around 15 quarters before it ran up to a new peak again in Q1 2008.
This period was really two crises rolled into one; but notice that even so, recovery time was quicker than in the ‘80s. In addition, the subsequent rebound was steeper than the decline (see below).
Here’s an important factor to notice though: this “ideal time” to buy was actually one of the most frightening. Buyers at this time would have gone through the Asian Financial Crisis, Dot Com Bubble, 9/11 terrorist attack and SARS – all within a six year stretch.
This is another issue when it comes to trying to time the market: property prices may fall when everyone is fearful, being retrenched, and the economy is doing poorly. So, does it make sense on a personal financial level to buy in such a time, even if some properties become undervalued?
There’s no doubt many of the people who bought in this time may have gotten a good deal; but you can see how dangerous it is in practical terms and how it’s easy to be a pessimist during this time.
4. (2008 to 2013) The Global Financial Crisis and subsequent rebound
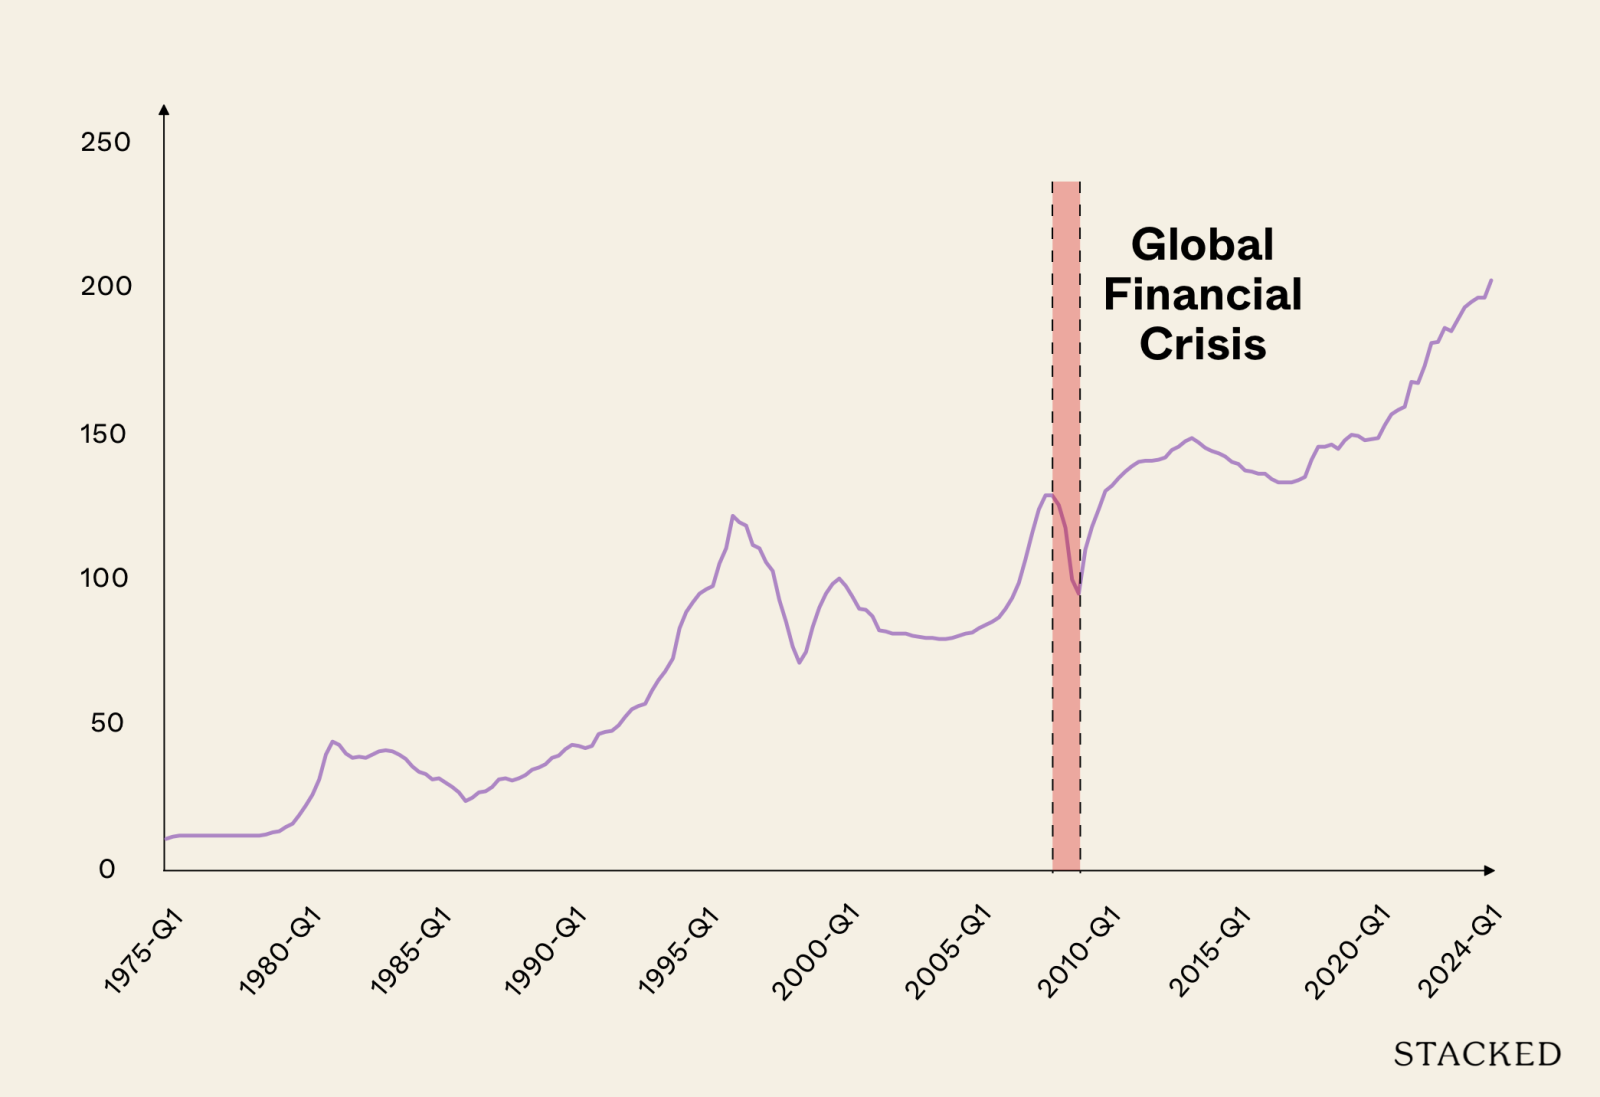
Prices recovered from the Dot Com Bubble and 9/11, peaking once again in Q1 2008. This time, notice that prices ended up even higher than the last peak in ‘96. Then, in late 2008 to 2009, the Global Financial Crisis struck, and prices fell for about five quarters.
The difference is that, by this point, buyers had become aware of how property prices could rebound sharply after a crisis. In addition, distrust in the stock and bond markets drove investors toward perceived safe havens, like Singapore real estate.
The pace of the recovery was unexpected: between 2009 and 2013, prices skyrocketed by another 53.6 points, reaching a new, even higher property peak in Q3 2013. It was this particular period that saw the slew of cooling measures we’re familiar with today, such as Total Debt Servicing Ratio, Additional Buyers Stamp Duty, etc. (although they have been further intensified over time). This resulted in another market trough in around 2016/17, which would be very short-lived.
Subsequently, in 2020 to 2021, COVID appeared and shook up the market.
Most readers today will be familiar with what happened during COVID: construction slowed significantly, and we saw a major shortage of homes, especially with the subsequent rise of Work From Home (WFH) arrangements.
Around the time of COVID and the Circuit Breaker (2020) we saw prices and transactions drop, as agents were unable to conduct viewings, showflats were closed, and market activity was constrained. But subsequent to COVID (roughly 2021 by most standards, when international travel opened up again), home prices shot up again and continued their upward trajectory.
While property prices have fallen in some times of crisis, we can see it’s often tough for buyers to take advantage of them.
Compared to past dips, buyers have a very short time to purchase at the market bottom, before prices surge upward again. It’s different from previous property cycles, where buyers may have had years of lower prices (e.g., the 1980s) to buy at a good value. Consider, for instance, the market right after COVID: prices had already begun to rise by early 2021.
Even if buyers had been willing to jump in at such a risky time, there’s no guarantee they could find a suitable unit (new or resale) in the short period before the prices were driven up.
For those who chose to “wait and see” during the Global Financial Crisis, the move could have been devastating: prices rose every year from 2008/9 to 2013. For those who couldn’t find an ideal home soon after the GFC, their caution ended up costing them a pricier home.
This demonstrates that Singapore home prices don’t “always go up.” But it also shows that dips in price are very rare, and each recovery has been quicker than the last. The key differentiator right now is the accumulated effects of cooling measures, like the 60 per cent ABSD on foreigners, among others.
However this ultimately plays out, one thing becomes increasingly clear: the traditional advice to “wait for the perfect moment” rarely works in Singapore’s property market. The data consistently shows that those narrow windows of opportunity close faster than most buyers can react.
Most people in Singapore will tell you one of two things: either “wait for prices to drop” (which history shows can be a costly strategy) or simply “buy when you’re ready” (which lacks the strategic guidance needed in today’s complex market).
What we offer instead is a data-informed approach that acknowledges these historical patterns while focusing on your specific circumstances and objectives. We analyse your financial readiness, timeline, and needs against the backdrop of market realities – not theoretical “perfect timing” that rarely materialises.
If you’re contemplating a property move in the next 6-12 months, let’s have a conversation about positioning yourself to make decisions with confidence, regardless of short-term market fluctuations. The key isn’t to time the market perfectly—it’s to ensure you’re prepared to act decisively when your personal circumstances and the right property align.
Ready to navigate Singapore’s property market with confidence? Book a no-obligation consultation with our team today here.
At Stacked, we like to look beyond the headlines and surface-level numbers, and focus on how things play out in the real world.
If you’d like to discuss how this applies to your own circumstances, you can reach out for a one-to-one consultation here.
And if you simply have a question or want to share a thought, feel free to write to us at stories@stackedhomes.com — we read every message.
0 Comments