


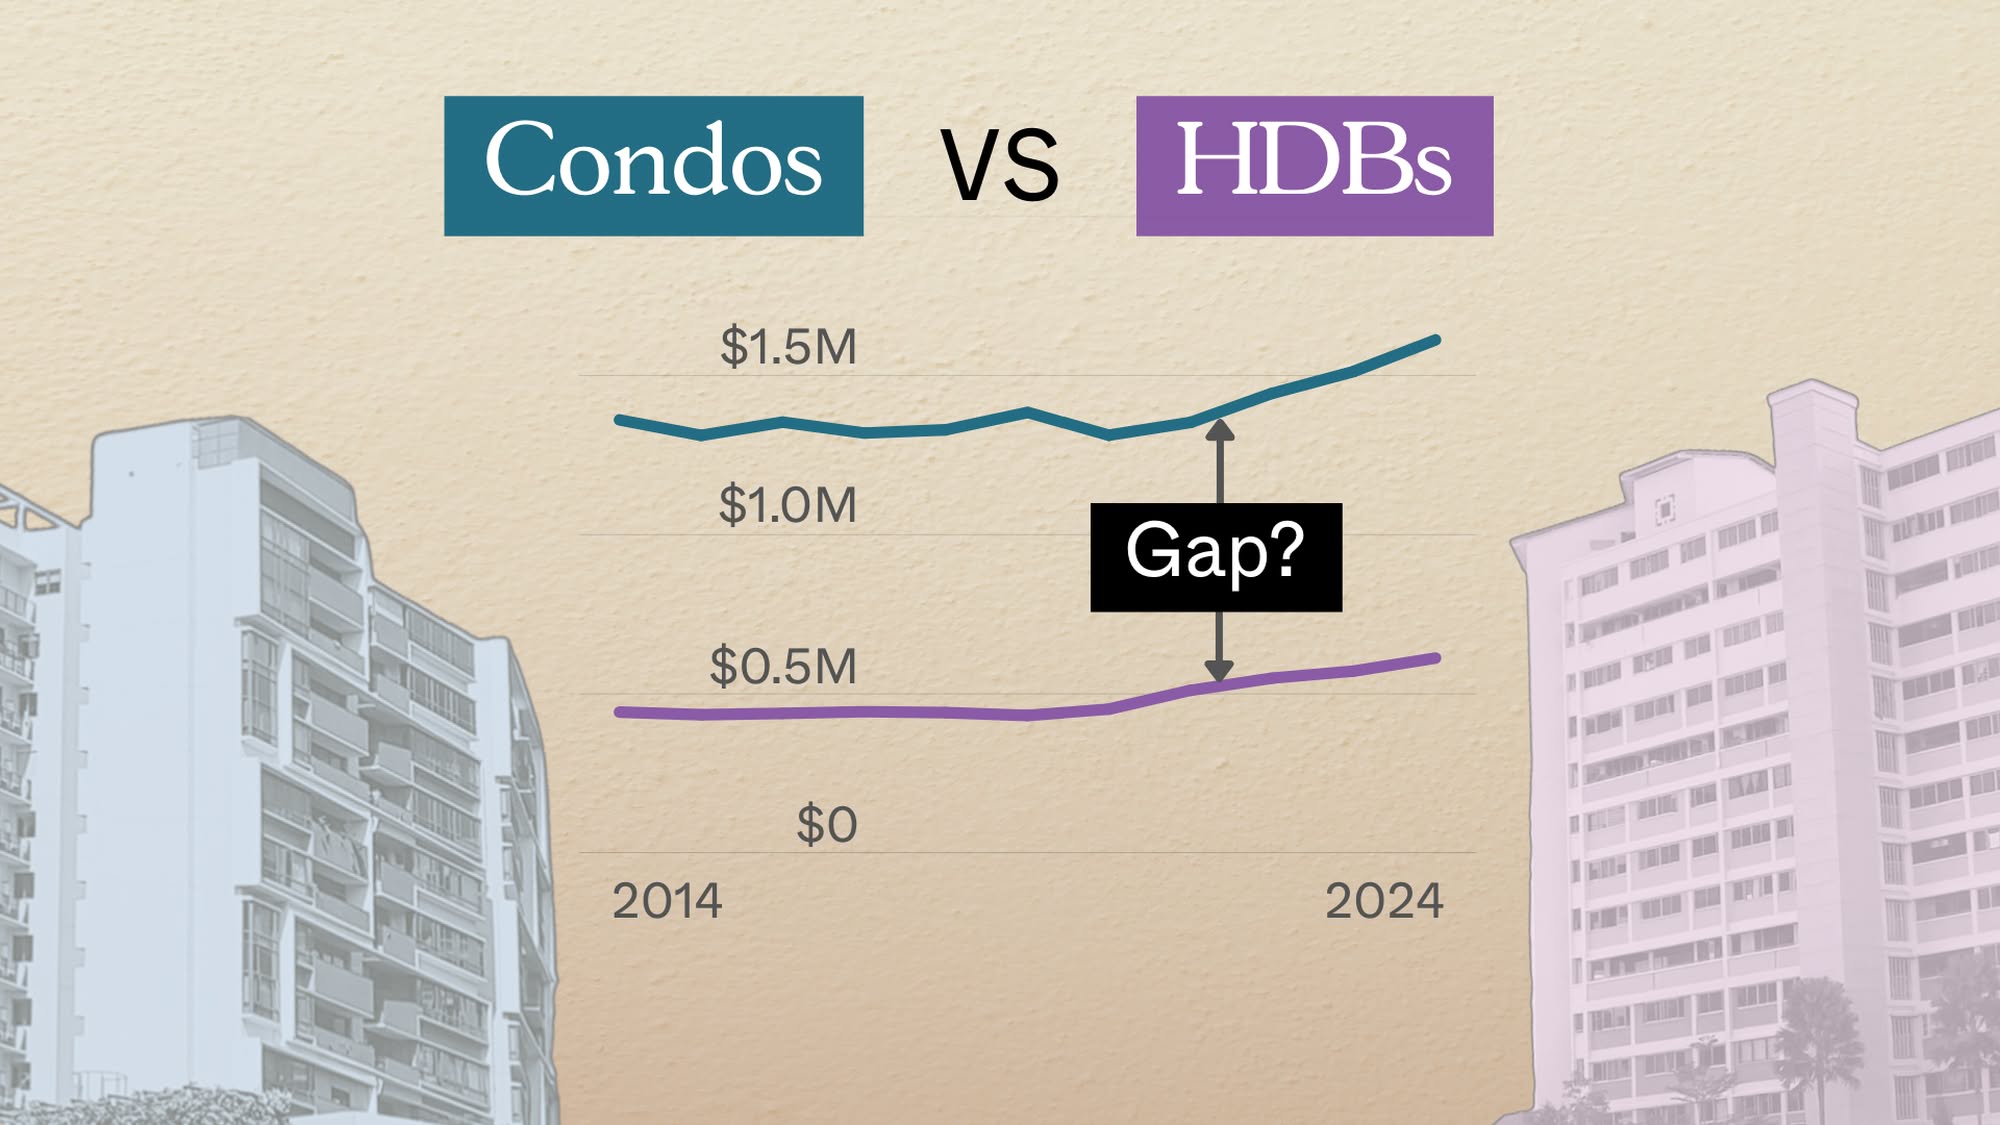
With new launch prices now averaging $2,200+ psf, it’s unsurprising that attention has turned back toward resale condos. This is when a good number of home buyers get shocked at how much resale condo prices rose as well – we shouldn’t forget that, in the wake of Covid, ready-to-move-in units were in high demand amid the housing supply crunch. It’s high time that we take another look, and update our observations on the price gap between new and resale condos for 2024:
Notes: For the following, we analysed 213,117 transactions, focusing only on non-landed private residences classified as apartments or condos. Sub sales were treated as new sales. Executive Condos were excluded due to the effect of subsidies on new sales. We also grouped transactions into size categories to capture a more appropriate $PSF for comparison. This minimises the effect of volume of larger/smaller units on $PSF.
Broad trend pieces like this are useful for setting expectations, but they can't tell you whether those trends apply to your estate, your unit type, or the price range you're actually considering.
That's often the hardest part of a property decision: working out what the broader market means for the specific home you're thinking of buying or selling.
Over time, that's also why we decided to work with agents who shared the same data-driven and advisory-led approach behind our editorial, consultants who could help readers think through decisions more objectively, rather than simply push transactions.
Today, the team has worked with more than 2,000 clients across over $5B in property transactions.
Tracking new launch condo prices from 2013 to the present
| Year | Less Than 500 Sq Ft | Less Than 800 Sq Ft | Less Than 1200 Sq Ft | More Than 1200 Sq Ft | Grand Total |
| 2013 | $1,532 | $1,507 | $1,358 | $1,290 | $1,409 |
| 2014 | $1,482 | $1,449 | $1,424 | $1,366 | $1,425 |
| 2015 | $1,383 | $1,355 | $1,265 | $1,268 | $1,319 |
| 2016 | $1,510 | $1,446 | $1,376 | $1,348 | $1,417 |
| 2017 | $1,632 | $1,554 | $1,413 | $1,445 | $1,503 |
| 2018 | $1,655 | $1,701 | $1,729 | $1,585 | $1,662 |
| 2019 | $1,842 | $1,805 | $2,010 | $1,649 | $1,783 |
| 2020 | $2,007 | $1,821 | $1,787 | $1,690 | $1,799 |
| 2021 | $2,393 | $2,023 | $2,019 | $1,941 | $2,030 |
| 2022 | $2,421 | $2,301 | $2,335 | $2,170 | $2,272 |
| 2023 | $2,463 | $2,394 | $2,551 | $2,355 | $2,413 |
| 2024 | $2,127 | $2,240 | $2,388 | $2,247 | $2,260 |
| Grand Total | $1,761 | $1,782 | $1,761 | $1,637 | $1,730 |
(You might notice that for smaller units, new launch prices seemed to decrease between 2013 to 2016. This was due to 2013 being a peak year, and a slew of cooling measures that followed till today)
Next, we looked at resale condo prices between 2013 to the present
| Year | Less Than 500 Sq Ft | Less Than 800 Sq Ft | Less Than 1200 Sq Ft | More Than 1200 Sq Ft |
| 2013 | $1,708 | $1,652 | $1,269 | $1,217 |
| 2014 | $1,651 | $1,585 | $1,184 | $1,168 |
| 2015 | $1,559 | $1,546 | $1,198 | $1,158 |
| 2016 | $1,559 | $1,744 | $1,230 | $1,187 |
| 2017 | $1,686 | $1,590 | $1,254 | $1,229 |
| 2018 | $1,563 | $1,518 | $1,346 | $1,254 |
| 2019 | $1,555 | $1,568 | $1,388 | $1,314 |
| 2020 | $1,464 | $1,483 | $1,303 | $1,279 |
| 2021 | $1,552 | $1,492 | $1,402 | $1,321 |
| 2022 | $1,652 | $1,574 | $1,536 | $1,419 |
| 2023 | $1,757 | $1,739 | $1,604 | $1,540 |
| 2024 | $1,839 | $1,797 | $1,624 | $1,679 |
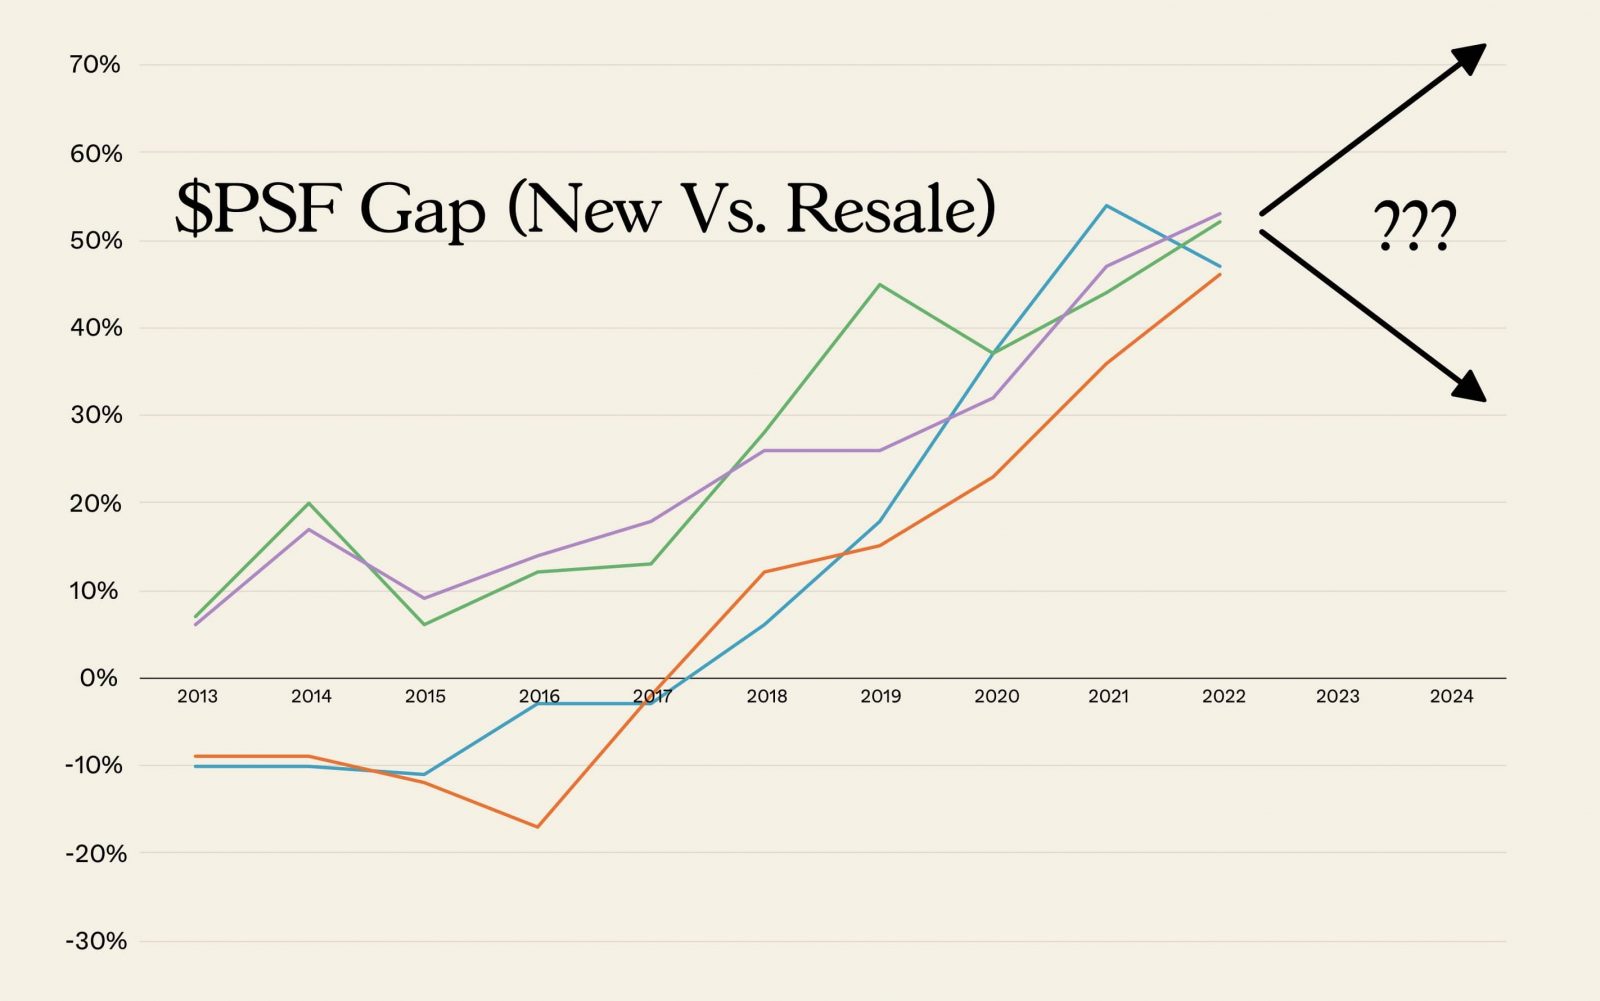
Overall, we can see the pandemic period had a drastic impact on the new and resale condo price gap
| Year | Less Than 500 Sq Ft | Less Than 800 Sq Ft | Less Than 1200 Sq Ft | More Than 1200 Sq Ft |
| 2013 | -10% | -9% | 7% | 6% |
| 2014 | -10% | -9% | 20% | 17% |
| 2015 | -11% | -12% | 6% | 9% |
| 2016 | -3% | -17% | 12% | 14% |
| 2017 | -3% | -2% | 13% | 18% |
| 2018 | 6% | 12% | 28% | 26% |
| 2019 | 18% | 15% | 45% | 26% |
| 2020 | 37% | 23% | 37% | 32% |
| 2021 | 54% | 36% | 44% | 47% |
| 2022 | 47% | 46% | 52% | 53% |
| 2023 | 40% | 38% | 59% | 53% |
| 2024 | 16% | 25% | 47% | 34% |
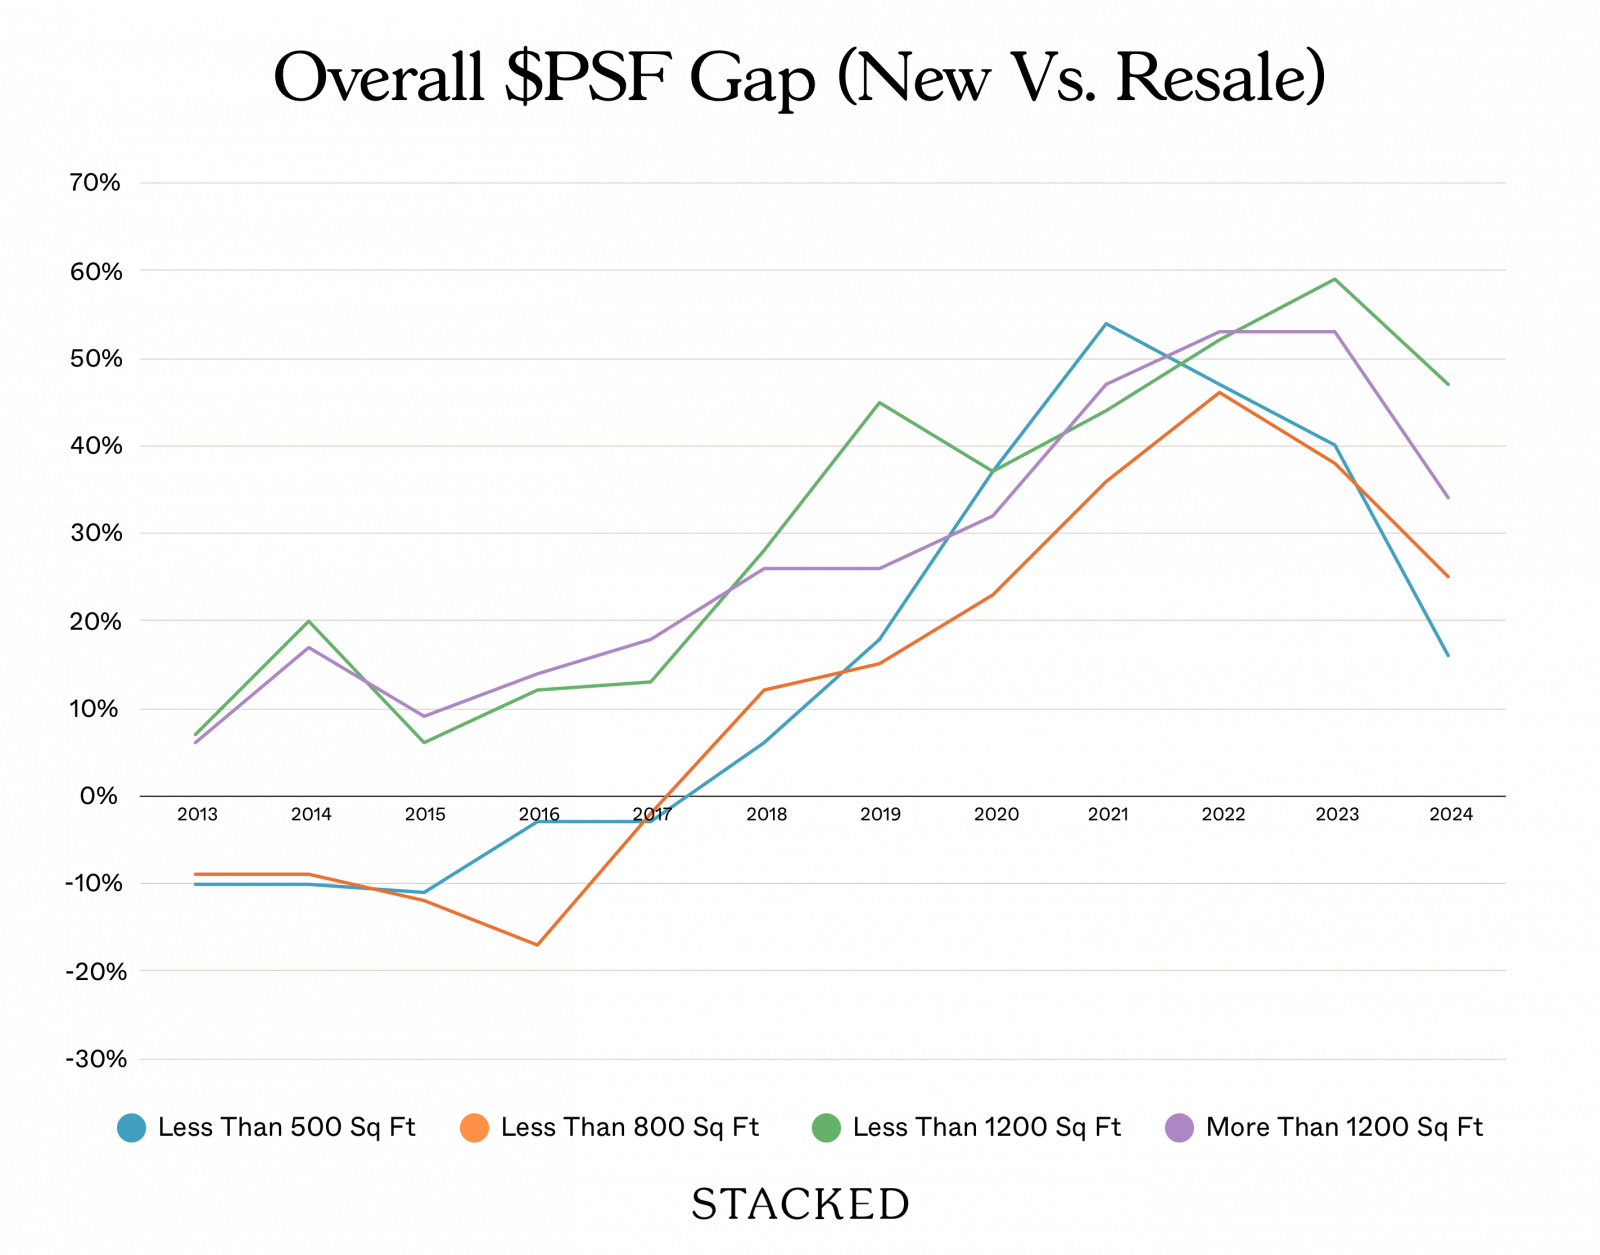
While the price gap had already started to grow in 2018, we can see the most drastic jumps occurring in 2020 (the year of the circuit breaker) and beyond.
Contrary to what this might suggest, it was not a golden time for property developers. It was in fact the opposite: prices soared because materials and manpower costs rose during Covid, and didn’t come back down afterwards (as is true of most things). The effect was so bad that many builders went bankrupt.
On a price per square foot basis though, resale condos have been rising very recently.
Here’s a look at the growth of $PSF for new sales:
| Year | Less Than 500 Sq Ft | Less Than 800 Sq Ft | Less Than 1200 Sq Ft | More Than 1200 Sq Ft |
| 2013-14 | -3.2% | -3.9% | 4.8% | 5.9% |
| 2014-15 | -6.7% | -6.5% | -11.2% | -7.2% |
| 2015-16 | 9.2% | 6.7% | 8.8% | 6.3% |
| 2016-17 | 8.1% | 7.5% | 2.7% | 7.2% |
| 2017-18 | 1.4% | 9.5% | 22.4% | 9.7% |
| 2018-19 | 11.3% | 6.1% | 16.3% | 4.0% |
| 2019-20 | 9.0% | 0.9% | -11.1% | 2.5% |
| 2020-21 | 19.3% | 11.1% | 13.0% | 14.9% |
| 2021-22 | 1.2% | 13.8% | 15.6% | 11.8% |
| 2022-23 | 1.8% | 4.0% | 9.3% | 8.5% |
| 2023-24 | -13.6% | -6.4% | -6.4% | -4.6% |
Here’s what the growth of $PSF looks like for resale condos:
| Year | Less Than 500 Sq Ft | Less Than 800 Sq Ft | Less Than 1200 Sq Ft | More Than 1200 Sq Ft |
| 2013-14 | -3.3% | -4.1% | -6.8% | -4.1% |
| 2014-15 | -5.5% | -2.4% | 1.2% | -0.8% |
| 2015-16 | 0.0% | 12.8% | 2.7% | 2.4% |
| 2016-17 | 8.1% | -8.8% | 1.9% | 3.6% |
| 2017-18 | -7.3% | -4.5% | 7.4% | 2.0% |
| 2018-19 | -0.5% | 3.3% | 3.1% | 4.8% |
| 2019-20 | -5.8% | -5.4% | -6.1% | -2.7% |
| 2020-21 | 6.0% | 0.6% | 7.5% | 3.3% |
| 2021-22 | 6.4% | 5.5% | 9.6% | 7.5% |
| 2022-23 | 6.4% | 10.5% | 4.4% | 8.5% |
| 2023-24 | 4.7% | 3.3% | 1.3% | 9.1% |
On a price psf basis, resale condos actually saw higher growth in 2023 to 2024. This helped to narrow the gap with their new launch counterparts, at least in recent times. However, it’s impossible to say if the price gap will continue to narrow. There are a number of variables still to be considered.
One is that, when comparing between new launch and resale, we need to acknowledge that the vast majority of new launches are leasehold condos. This matters as freehold condos have a price premium.
So to get a fairer look, we compared new launch versus resale leasehold projects, and then the same with freehold projects.
This is what the prices look like for freehold (new launch):
| Year | Less Than 500 Sq Ft | Less Than 800 Sq Ft | Less Than 1200 Sq Ft | More Than 1200 Sq Ft |
| 2013 | $1,671 | $1,735 | $1,564 | $1,637 |
| 2014 | $1,713 | $1,571 | $1,687 | $1,765 |
| 2015 | $1,712 | $1,660 | $1,620 | $1,672 |
| 2016 | $1,807 | $1,723 | $1,627 | $1,888 |
| 2017 | $1,915 | $1,853 | $1,742 | $1,545 |
| 2018 | $2,111 | $2,169 | $1,899 | $2,273 |
| 2019 | $2,492 | $2,309 | $2,152 | $2,909 |
| 2020 | $2,181 | $2,146 | $2,070 | $2,363 |
| 2021 | $2,462 | $2,275 | $2,226 | $2,702 |
| 2022 | $2,646 | $2,553 | $2,366 | $2,775 |
| 2023 | $3,049 | $2,805 | $2,680 | $3,002 |
| 2024 | $2,219 | $2,430 | $2,594 | $2,959 |
Now, we look at the prices for freehold (resale):
| Year | Less Than 500 Sq Ft | Less Than 800 Sq Ft | Less Than 1200 Sq Ft | More Than 1200 Sq Ft |
| 2013 | $1,674 | $1,660 | $1,340 | $1,415 |
| 2014 | $1,665 | $1,610 | $1,318 | $1,327 |
| 2015 | $1,598 | $1,615 | $1,292 | $1,336 |
| 2016 | $1,583 | $1,560 | $1,292 | $1,396 |
| 2017 | $1,706 | $1,683 | $1,385 | $1,416 |
| 2018 | $1,609 | $1,659 | $1,415 | $1,538 |
| 2019 | $1,654 | $1,698 | $1,514 | $1,562 |
| 2020 | $1,502 | $1,584 | $1,438 | $1,488 |
| 2021 | $1,598 | $1,616 | $1,505 | $1,617 |
| 2022 | $1,678 | $1,721 | $1,612 | $1,764 |
| 2023 | $1,754 | $1,850 | $1,690 | $1,832 |
| 2024 | $1,857 | $1,894 | $1,770 | $1,811 |
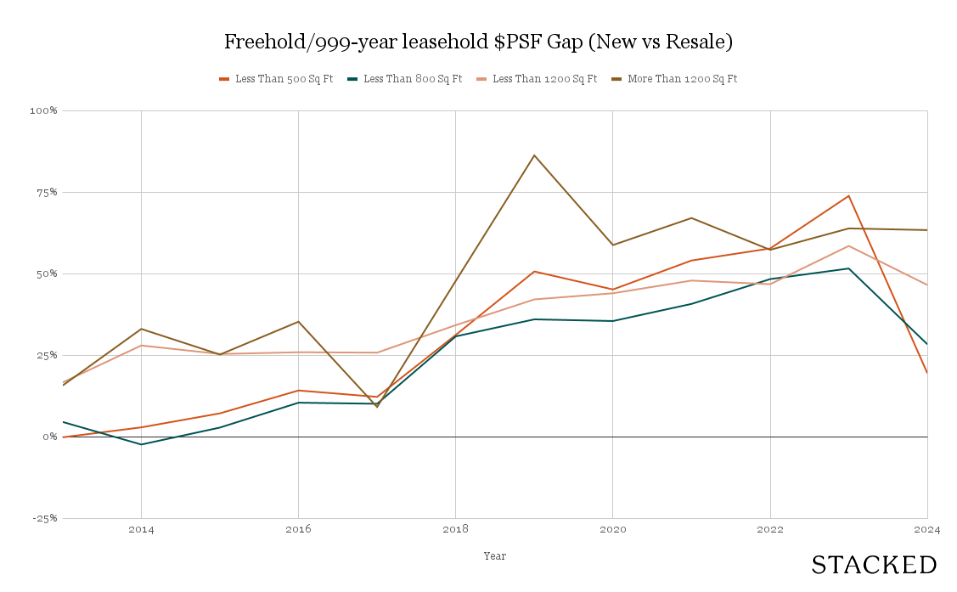
Here’s a look at the $PSF gap if we only focused on freehold/999-year leasehold developments:
| Year | Less Than 500 Sq Ft | Less Than 800 Sq Ft | Less Than 1200 Sq Ft | More Than 1200 Sq Ft |
| 2013 | 0% | 5% | 17% | 16% |
| 2014 | 3% | -2% | 28% | 33% |
| 2015 | 7% | 3% | 25% | 25% |
| 2016 | 14% | 10% | 26% | 35% |
| 2017 | 12% | 10% | 26% | 9% |
| 2018 | 31% | 31% | 34% | 48% |
| 2019 | 51% | 36% | 42% | 86% |
| 2020 | 45% | 35% | 44% | 59% |
| 2021 | 54% | 41% | 48% | 67% |
| 2022 | 58% | 48% | 47% | 57% |
| 2023 | 74% | 52% | 59% | 64% |
| 2024 | 19% | 28% | 47% | 63% |
Next, let’s look at new launch leasehold prices:
| Year | Less Than 500 Sq Ft | Less Than 800 Sq Ft | Less Than 1200 Sq Ft | More Than 1200 Sq Ft |
| 2013 | $1,453 | $1,425 | $1,235 | $1,286 |
| 2014 | $1,383 | $1,412 | $1,275 | $1,257 |
| 2015 | $1,343 | $1,309 | $1,229 | $1,173 |
| 2016 | $1,473 | $1,408 | $1,321 | $1,265 |
| 2017 | $1,596 | $1,523 | $1,422 | $1,396 |
| 2018 | $1,588 | $1,628 | $1,552 | $1,665 |
| 2019 | $1,717 | $1,723 | $1,586 | $1,681 |
| 2020 | $1,961 | $1,771 | $1,612 | $1,586 |
| 2021 | $2,375 | $1,964 | $1,854 | $1,784 |
| 2022 | $2,301 | $2,193 | $2,090 | $2,098 |
| 2023 | $2,355 | $2,288 | $2,253 | $2,332 |
| 2024 | $2,072 | $2,201 | $2,184 | $2,276 |
Now here’s what the prices look like for resale, leasehold condos:
| Year | Less Than 500 Sq Ft | Less Than 800 Sq Ft | Less Than 1200 Sq Ft | More Than 1200 Sq Ft |
| 2013 | $1,982 | $1,633 | $1,099 | $1,072 |
| 2014 | $1,542 | $1,543 | $1,040 | $1,020 |
| 2015 | $1,441 | $1,444 | $1,059 | $1,029 |
| 2016 | $1,492 | $1,856 | $1,108 | $1,050 |
| 2017 | $1,635 | $1,501 | $1,094 | $1,042 |
| 2018 | $1,479 | $1,398 | $1,151 | $1,138 |
| 2019 | $1,419 | $1,464 | $1,188 | $1,203 |
| 2020 | $1,423 | $1,431 | $1,185 | $1,127 |
| 2021 | $1,505 | $1,427 | $1,227 | $1,193 |
| 2022 | $1,631 | $1,511 | $1,333 | $1,345 |
| 2023 | $1,759 | $1,691 | $1,474 | $1,420 |
| 2024 | $1,822 | $1,765 | $1,643 | $1,479 |
This gives us the following price gap:
| Year | Less Than 500 Sq Ft | Less Than 800 Sq Ft | Less Than 1200 Sq Ft | More Than 1200 Sq Ft |
| 2013 | -27% | -13% | 12% | 20% |
| 2014 | -10% | -8% | 23% | 23% |
| 2015 | -7% | -9% | 16% | 14% |
| 2016 | -1% | -24% | 19% | 21% |
| 2017 | -2% | 1% | 30% | 34% |
| 2018 | 7% | 16% | 35% | 46% |
| 2019 | 21% | 18% | 34% | 40% |
| 2020 | 38% | 24% | 36% | 41% |
| 2021 | 58% | 38% | 51% | 50% |
| 2022 | 41% | 45% | 57% | 56% |
| 2023 | 34% | 35% | 53% | 64% |
| 2024 | 14% | 25% | 33% | 54% |
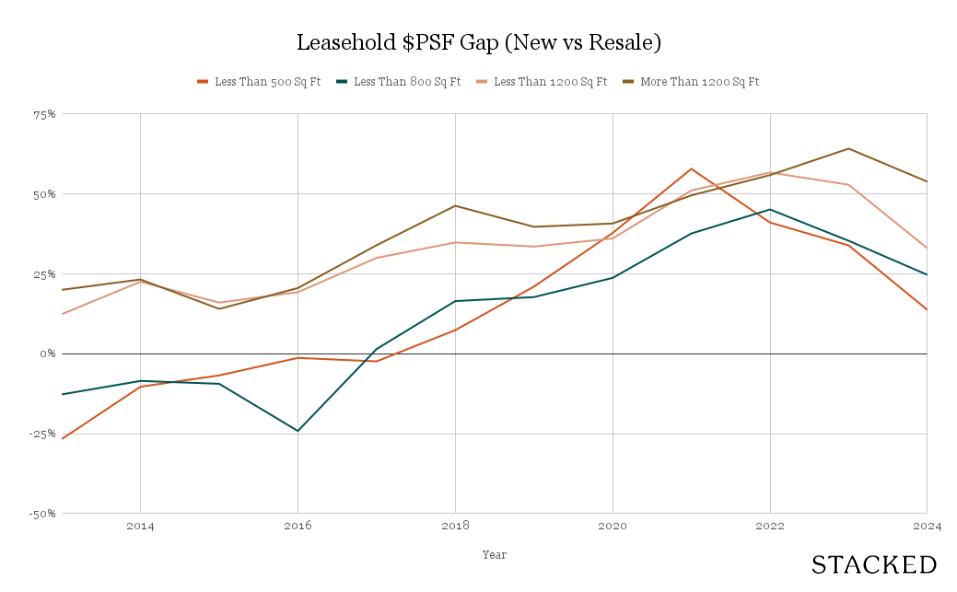
Unfortunately, it doesn’t look like sticking to leasehold projects will help with a smaller price gap. While the absolute prices for leasehold are lower, the price gap between new and resale is close to what you’d find in the freehold market:
For now, it would seem that the only good news (for buyers) is that the price gap in ‘23 and ‘24 is not as bad as the ones we saw between 2017 to 2023.

Given that a substantial number of new condos have been built – particularly recent mega-developments like Normanton Park and Treasure at Tampines – the supply crunch is largely over. This may also help to narrow the price gap, or at least keep it from widening even further.
That said, there’s one more thing to look at: we want to be sure that the narrowing price gap isn’t simply due to higher volume of sales in the CBD, compared to previous years.
We need to start by checking the volume of sales in the various regions. This shows the proportion of condo sales that each region constituted, since 2013:
| Year | CCR | OCR | RCR |
| 2013 | 13.9% | 54.9% | 31.2% |
| 2014 | 12.3% | 54.5% | 33.2% |
| 2015 | 6.4% | 69.1% | 24.5% |
| 2016 | 8.3% | 61.7% | 30.0% |
| 2017 | 8.2% | 57.9% | 34.0% |
| 2018 | 6.8% | 46.1% | 47.0% |
| 2019 | 9.4% | 46.9% | 43.7% |
| 2020 | 12.0% | 45.6% | 42.4% |
| 2021 | 19.0% | 39.3% | 41.7% |
| 2022 | 24.9% | 35.4% | 39.7% |
| 2023 | 19.0% | 34.7% | 46.2% |
| 2024 | 7.6% | 66.0% | 26.4% |
Note that between 2015 to 2019, only a very small number of transactions were in the CCR, hence our need to check for distortions (when you have a very high or low number of new launches appearing in a given area, it will distort the average price psf).
(Some of you may notice that 2024 saw a plunge in OCR transaction volumes
There are varied reasons why the CCR volumes dropped again. One reason is the ABSD on foreigners and entities being doubled to 60 per cent. This hits the CCR harder, as it’s the favoured region for this buyer group.
Another reason is the strong line-up of OCR offerings for 2024, which are simply more palatable price-wise: the Lentor projects (Lentor Mansion, Lentoria, and Lentor Hills Residences), along with Kassia, Hillhaven, Hillock Green, The Botany, and many others.)
Next, let’s look at transaction volume proportion for resale projects:
| Year | CCR | OCR | RCR |
| 2013 | 23.4% | 44.6% | 32.0% |
| 2014 | 21.7% | 46.2% | 32.1% |
| 2015 | 23.5% | 44.4% | 32.1% |
| 2016 | 28.7% | 40.3% | 31.0% |
| 2017 | 27.6% | 41.7% | 30.7% |
| 2018 | 20.6% | 48.5% | 30.9% |
| 2019 | 24.2% | 46.0% | 29.8% |
| 2020 | 21.2% | 50.6% | 28.2% |
| 2021 | 19.4% | 51.3% | 29.3% |
| 2022 | 17.9% | 53.0% | 29.1% |
| 2023 | 18.4% | 50.5% | 31.2% |
| 2024 | 19.2% | 49.6% | 31.1% |
The number of resale transactions tends to be more stable across the various regions.
Now let’s look at the price gap between new launch and resale projects, based on region:
New sales:
| Year | CCR | OCR | RCR |
| 2013 | $2,001 | $1,196 | $1,519 |
| 2014 | $2,173 | $1,208 | $1,506 |
| 2015 | $2,085 | $1,173 | $1,533 |
| 2016 | $2,277 | $1,237 | $1,548 |
| 2017 | $2,202 | $1,314 | $1,657 |
| 2018 | $2,772 | $1,395 | $1,764 |
| 2019 | $2,811 | $1,452 | $1,917 |
| 2020 | $2,559 | $1,529 | $1,873 |
| 2021 | $2,728 | $1,603 | $2,114 |
| 2022 | $2,840 | $1,895 | $2,252 |
| 2023 | $2,997 | $2,030 | $2,460 |
| 2024 | $3,146 | $2,080 | $2,458 |
Resale:
| Year | CCR | OCR | RCR |
| 2013 | $1,827 | $993 | $1,293 |
| 2014 | $1,760 | $953 | $1,223 |
| 2015 | $1,749 | $945 | $1,213 |
| 2016 | $1,860 | $925 | $1,206 |
| 2017 | $1,873 | $964 | $1,283 |
| 2018 | $2,007 | $1,038 | $1,399 |
| 2019 | $2,051 | $1,049 | $1,393 |
| 2020 | $1,946 | $1,058 | $1,365 |
| 2021 | $1,997 | $1,139 | $1,462 |
| 2022 | $2,116 | $1,268 | $1,591 |
| 2023 | $2,144 | $1,382 | $1,715 |
| 2024 | $2,186 | $1,447 | $1,795 |
The price gaps are as follows:
| Year | CCR | OCR | RCR |
| 2013 | 9.5% | 20.5% | 17.4% |
| 2014 | 23.5% | 26.7% | 23.2% |
| 2015 | 19.2% | 24.1% | 26.3% |
| 2016 | 22.4% | 33.7% | 28.3% |
| 2017 | 17.6% | 36.3% | 29.2% |
| 2018 | 38.1% | 34.3% | 26.1% |
| 2019 | 37.0% | 38.4% | 37.6% |
| 2020 | 31.5% | 44.5% | 37.2% |
| 2021 | 36.6% | 40.7% | 44.6% |
| 2022 | 34.2% | 49.4% | 41.6% |
| 2023 | 39.8% | 46.9% | 43.4% |
| 2024 | 43.9% | 43.8% | 37.0% |
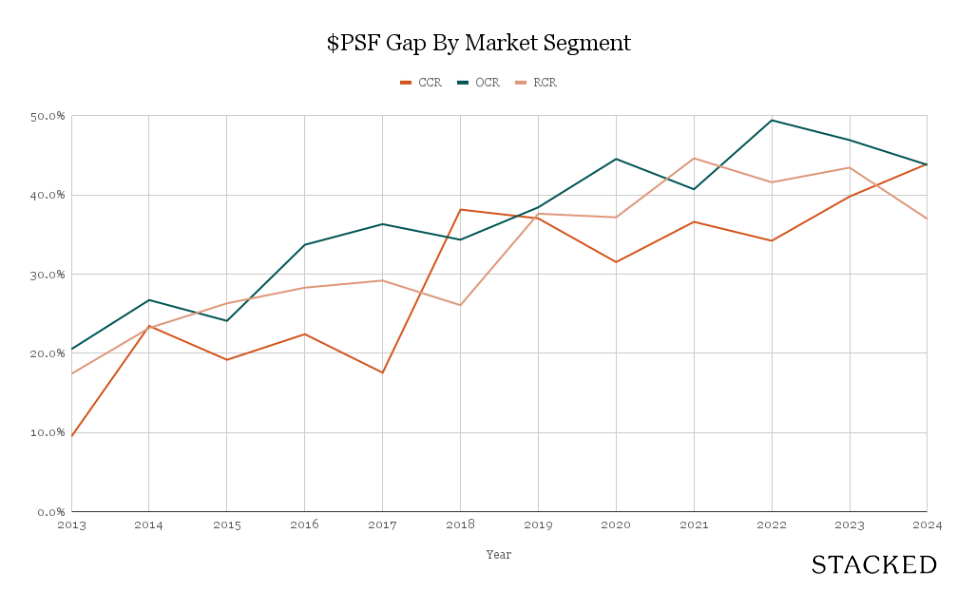
Now you can see why it’s important to compare on a regional basis as well. Once we’ve accounted for location, you can see a very consistent trend where the gap widens over time.
Whilst the CCR has recently taken a pounding from new cooling measures, it was in fact the region with the fastest-rising gap between new and resale projects.
We have a theory by the way, on why in the CCR, old resale projects may see such a big price gap versus newer ones. That’s related to the quality of old luxury projects in the CCR, which by today’s standards are sometimes outmatched even by the newest mass-market condos.
Meanwhile, in the OCR and RCR, we can see that – despite meteoric rises in new launch prices after COVID-19 – the gap has started to narrow. Resale units have started to catch up with their new launch counterparts, although there’s still quite a ways to go.
Overall, signs point to a general levelling off in new launch prices. Even developers probably know they’ve hit a ceiling, with $2 million+ family units being too much of a stretch for the average buyer (and almost certainly out of the question for most first-timers).
We’d also expect resale prices to further catch up for broadly similar reasons: the largest demographic (HDB upgraders) are likely to find some resale projects to be more palatable; enough that they’re more willing to overlook certain issues like age for now.
Broad trends like this are useful for setting expectations, but they rarely tell you whether the pattern applies to your estate, your unit type, or the price band you’re actually shopping in.
If you’d like to discuss how this applies to your own circumstances, you can reach out for a one-to-one consultation here.
And if you simply have a question or want to share a thought, feel free to write to us at stories@stackedhomes.com. We read every message.


0 Comments