


A common attitude toward new launches is that “earlier is better.” We’ve been ingrained in thinking that the sooner we buy, the lower the price, due to developer discounts or early bird pricing. But before you rush to put down a cheque, consider that it’s not always true: there are cases where those who bought later fared better. In this analysis, we’re going to look at the specifics of how much more you might make from buying earlier, and how consistent the performance is. We’ll start off with a look at general market data – but we’re also going to back our conclusions by looking at four case studies: Watertown, The Clement Canopy, Martin Modern, and Treasure at Tampines:
Buying early usually results in higher gains and lower risk of loss, especially in larger developments where price increases are phased over time; however, smaller boutique projects show less difference between early and late buyers.
In today’s market (post-2017), buying later carries less downside risk compared to past cycles, though early buyers still tend to do slightly better overall.
Market conditions matter: during upcycles (2011–2013) and downcycles (2014–2016), early buyers performed more consistently well, with the greatest risks appearing for late buyers during market peaks.
The challenge for many buyers today isn't access to information.
It's interpreting that information in a way that makes sense for their finances, goals, and stage of life.
Over time, that's also why we decided to work with agents who shared the same data-driven and advisory-led approach behind our editorial, consultants who could help readers think through decisions more objectively, rather than simply push transactions.
Today, the team has worked with more than 2,000 clients across over $5B in property transactions.
Looking at 20,161 transactions
We’re looking at a total of 20,161 buy-sell transactions since January 2011. We ignored periods earlier due to the introduction of the Sellers Stamp Duty which curbed speculative transactions.
We’ve ranked these transactions with bands ranging from 0 to 100 per cent. Being in the 0 to 10 per cent band means the transactions were among the first 10 per cent of buyers, whilst being in the 90 to 100 per cent band means they were among the last 10 per cent of buyers.
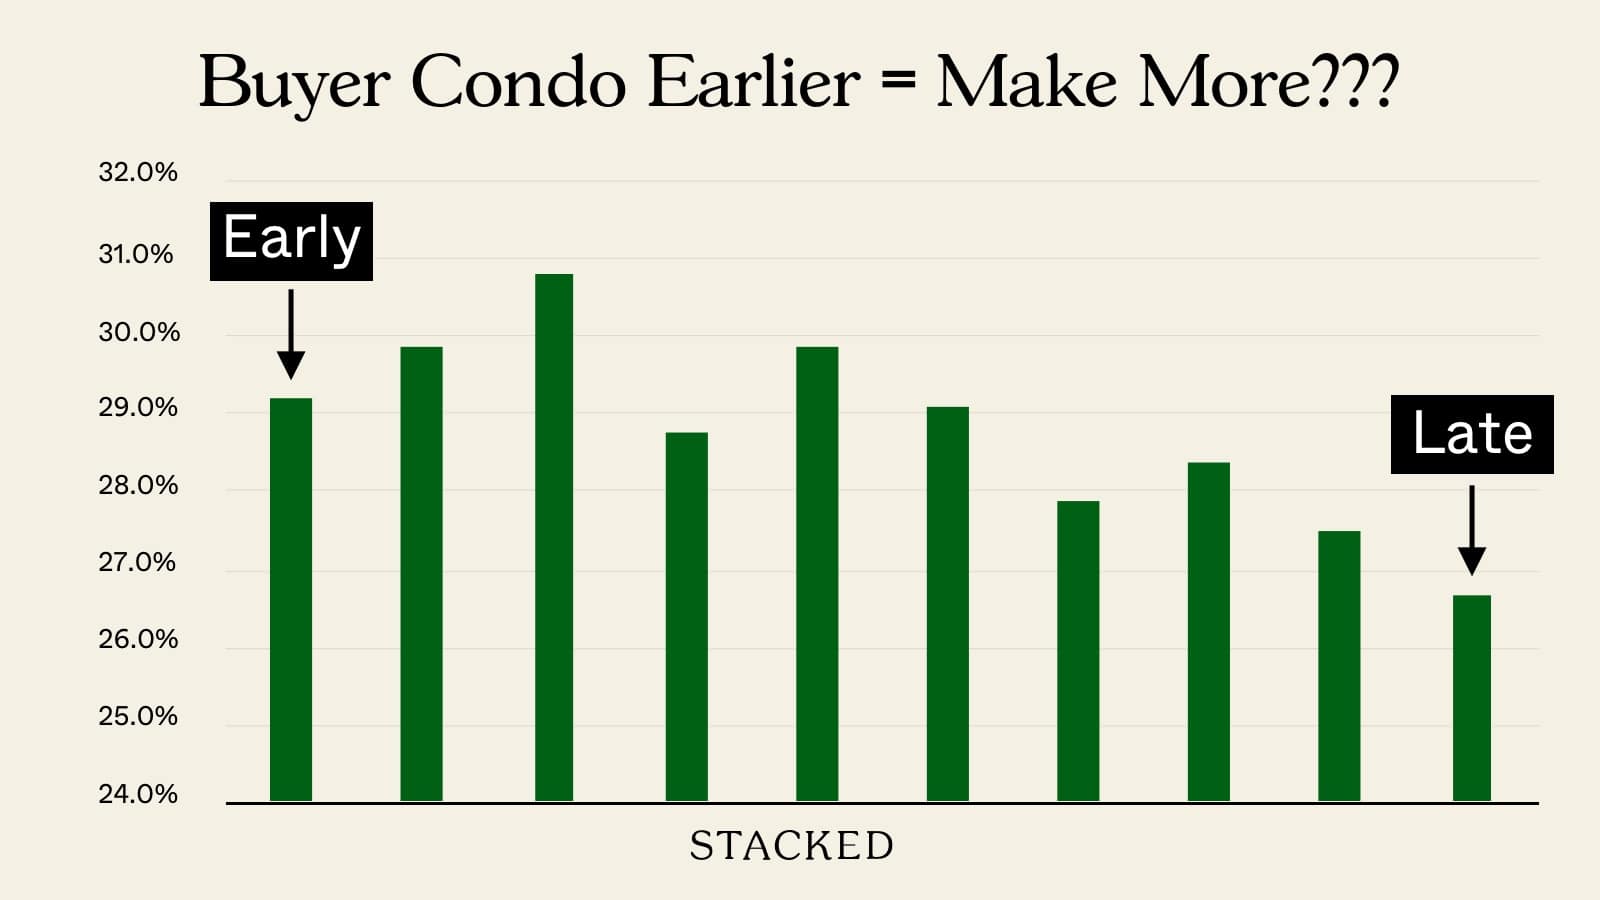
These are the overall results:
| Buying Stage (0% = Early, 100% = Late) | Gain (ROI %) | No. of Gains | Breakeven | No. of Loss | Loss (ROI %) | Total Volume |
| 0% – 10% | 29.2% | 1465 | 0 | 41 | 2.70% | 1506 |
| 10% – 20% | 29.9% | 1717 | 0 | 77 | 4.30% | 1794 |
| 20% – 30% | 30.8% | 1839 | 0 | 62 | 3.30% | 1901 |
| 30% – 40% | 28.8% | 1879 | 1 | 88 | 4.50% | 1968 |
| 40% – 50% | 29.9% | 2129 | 3 | 94 | 4.20% | 2226 |
| 50% – 60% | 29.1% | 1848 | 0 | 62 | 3.20% | 1910 |
| 60% – 70% | 27.9% | 1894 | 2 | 99 | 5.00% | 1995 |
| 70% – 80% | 28.4% | 1991 | 1 | 118 | 5.60% | 2110 |
| 80% – 90% | 27.5% | 1893 | 1 | 116 | 5.80% | 2010 |
| 90% – 100% | 26.7% | 2539 | 3 | 199 | 7.30% | 2741 |
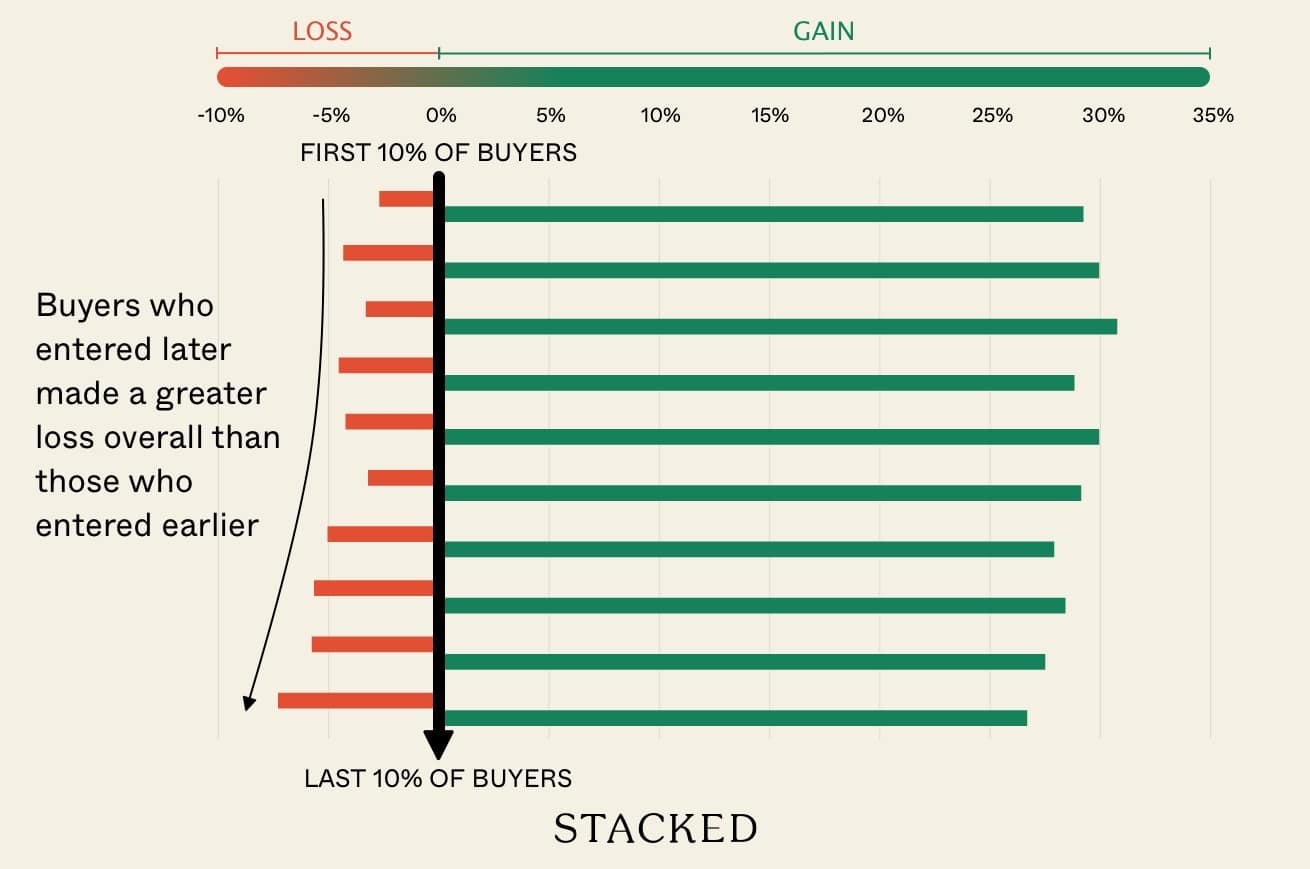
From this general snapshot, we can conclude that buying early tends to pay off. The first 30 per cent of buyers usually see the highest returns, averaging around 29.2 per cent to 30.8 per cent. Returns were generally lower for later buyers, with the last 10 per cent of buyers seeing the lowest returns at 26.7 per cent.
In addition, the risk of losses increases for later buyers.
The absolute number of loss-making transactions increases in later stages.
The 0–10 per cent band has only 41 losing transactions, while the 90–100 per cent band has 199.
Buyers in the 0–30 per cent band also have a loss percentage between 2.7 per cent and 3.3 per cent, while buyers in the 90 to 100 per cent band experience a much higher 7.3 per cent average loss.
Is this affected by wider market conditions?
Factors like interest rates, economic outlook, cooling measures, etc., can have a major effect on new launch sales. So let’s look at whether our theory – that buying earlier is generally better – holds true in different situations.
For this next part, we’ll break the market into three main segments:
- 2011 to 2013: This was a strong upmarket, getting to the point where a slew of cooling measures had to be introduced around 2013 and in subsequent years
- 2014 to 2016: This was a downmarket, as aggressive cooling measures like the TDSR began to bite.
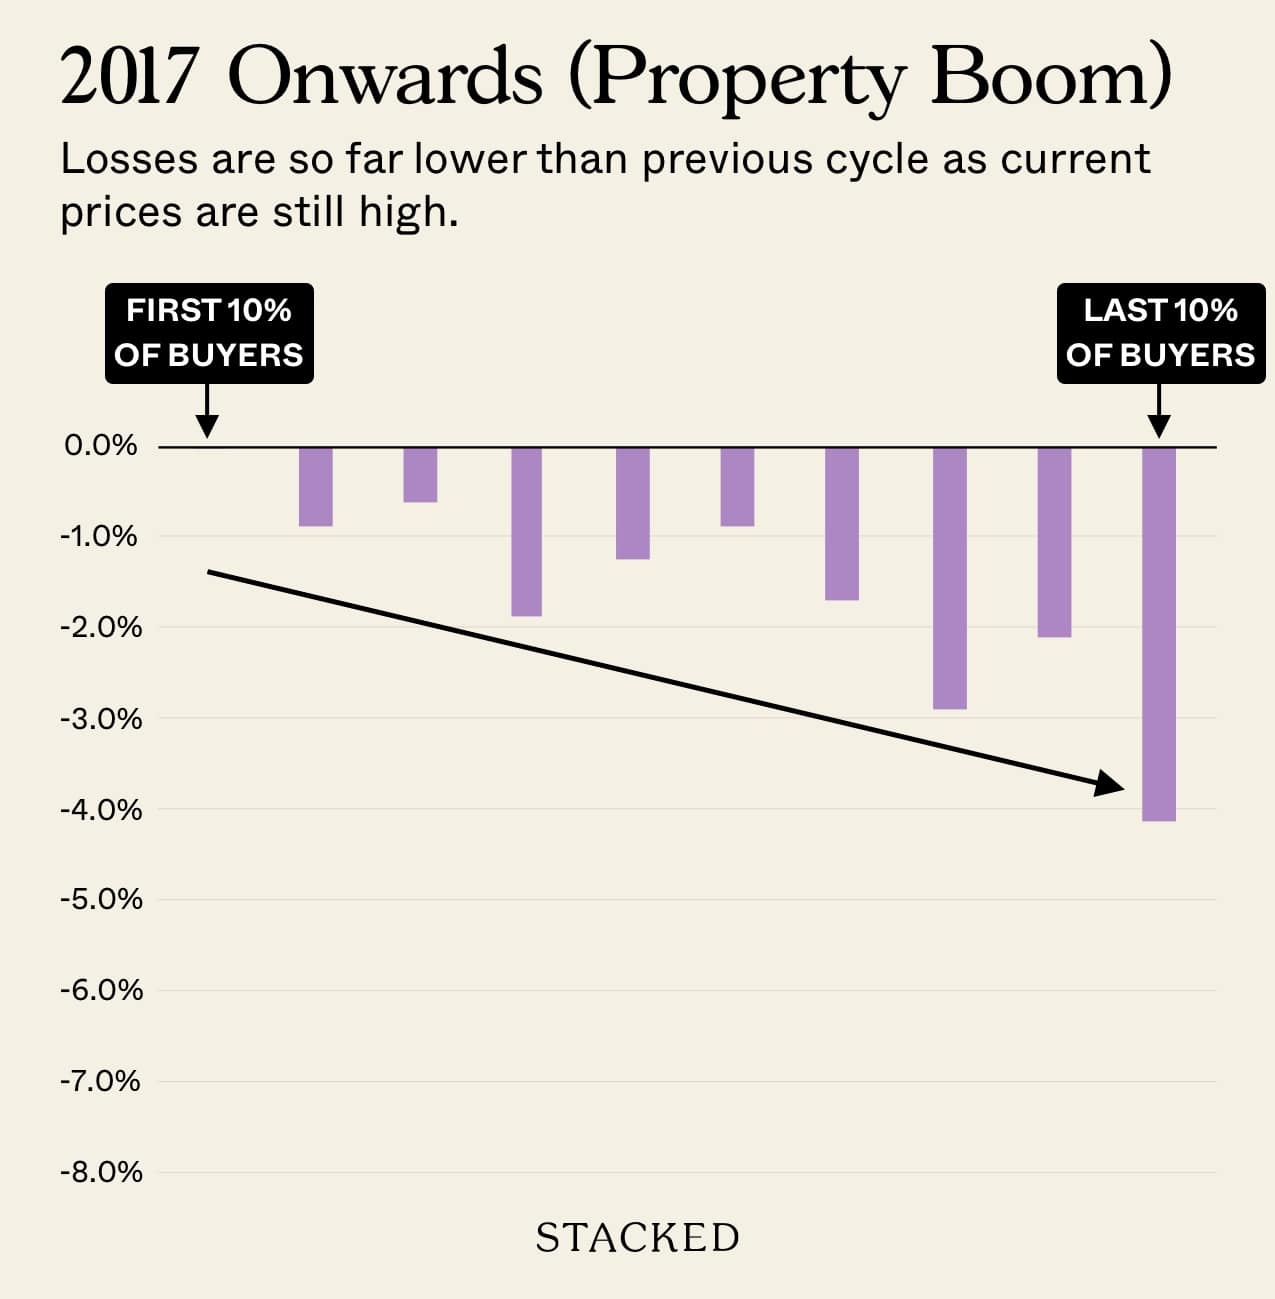
- 2017 onward: We’ve been in an upmarket, especially since a housing supply crunch during Covid caused prices to shoot up.
Early versus late buyers in 2011 to 2013
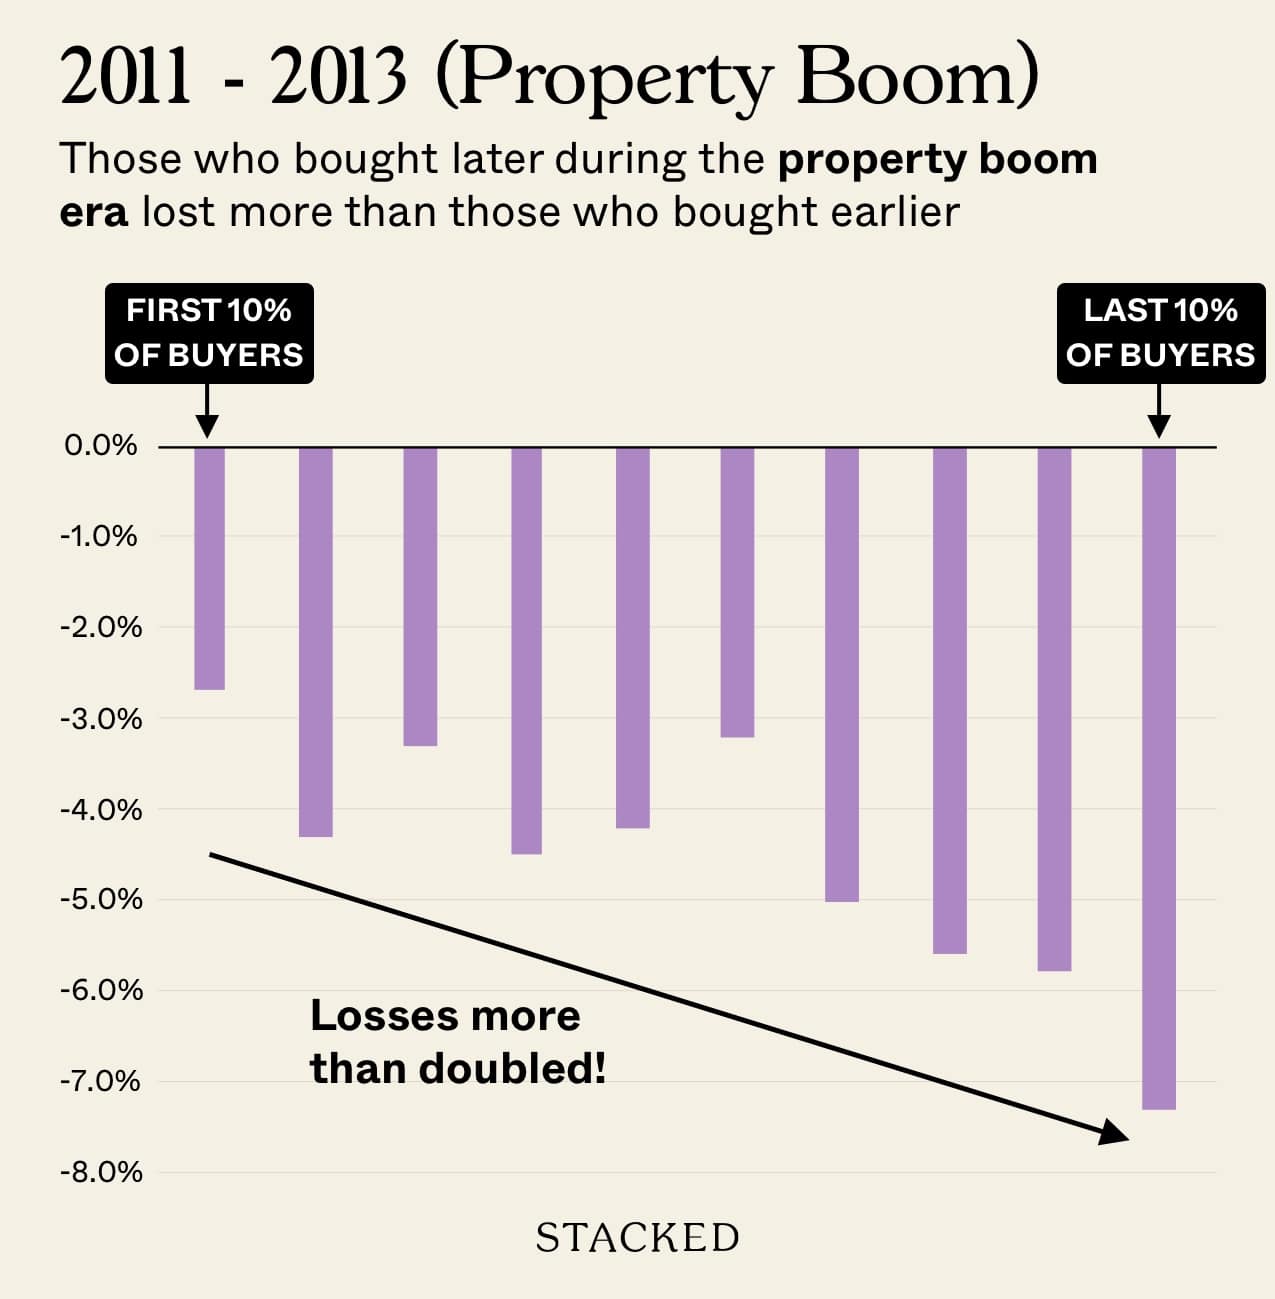
| Buying Stage (0% = Early, 100% = Late) | Gain (ROI %) | No. of Gains | Breakeven | No. of Loss | Loss (ROI %) | Total Volume |
| 0% – 10% | 25.10% | 798 | 0 | 38 | 4.50% | 836 |
| 10% – 20% | 24.70% | 894 | 0 | 70 | 7.30% | 964 |
| 20% – 30% | 26.20% | 885 | 0 | 51 | 5.40% | 936 |
| 30% – 40% | 23.80% | 920 | 0 | 66 | 6.70% | 986 |
| 40% – 50% | 25.30% | 1062 | 3 | 78 | 6.80% | 1143 |
| 50% – 60% | 23.70% | 835 | 0 | 52 | 5.90% | 887 |
| 60% – 70% | 24.10% | 852 | 0 | 75 | 8.10% | 927 |
| 70% – 80% | 23.20% | 837 | 1 | 79 | 8.60% | 917 |
| 80% – 90% | 22.90% | 777 | 0 | 87 | 10.10% | 864 |
| 90% – 100% | 22.80% | 1029 | 3 | 124 | 10.70% | 1156 |
Buying in the earlier phases was still safer in this period. Notice that the losses were steeper in the 2011 to 2013 cycle, for buyers who purchased later: this is because the closer to 2013 they got, the closer they were to buying at peak prices.
Interestingly, buyers in the 20 to 30 per cent band saw slightly better gains than the earliest buyers, although not by a significant margin. Speculatively, this could be due to the smaller units being the first ones to sell out. But small units like two-bedders could see marginally lower returns than family-sized units, due to the later preference for larger homes. After this band though, later buyers generally saw lower returns and higher risks of loss.
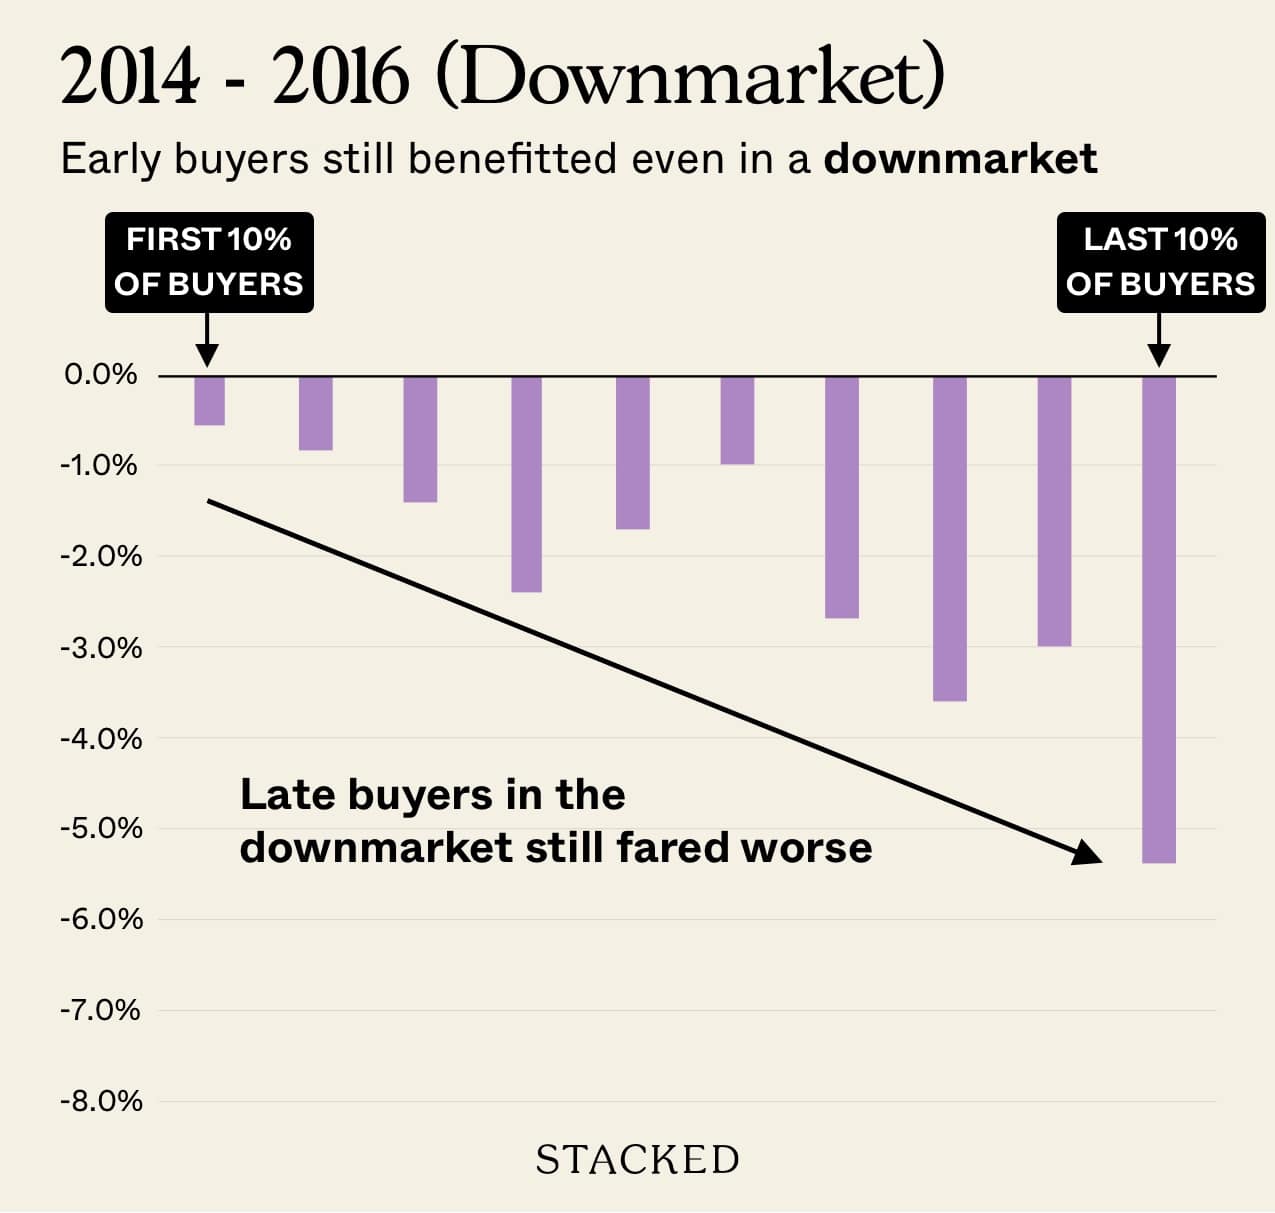
| Buying Stage (0% = Early, 100% = Late) | Gains (ROI %) | No. of Gains | Breakeven | No. of Loss | Loss (ROI %) | Total Volume |
| 0% – 10% | 36.20% | 530 | 0 | 3 | 0.60% | 533 |
| 10% – 20% | 37.60% | 603 | 0 | 5 | 0.80% | 608 |
| 20% – 30% | 37.20% | 634 | 0 | 9 | 1.40% | 643 |
| 30% – 40% | 35.60% | 601 | 1 | 15 | 2.40% | 617 |
| 40% – 50% | 36.30% | 639 | 0 | 11 | 1.70% | 650 |
| 50% – 60% | 35.00% | 584 | 0 | 6 | 1.00% | 590 |
| 60% – 70% | 32.20% | 529 | 2 | 15 | 2.70% | 546 |
| 70% – 80% | 33.80% | 591 | 0 | 22 | 3.60% | 613 |
| 80% – 90% | 32.40% | 548 | 1 | 17 | 3.00% | 566 |
| 90% – 100% | 28.60% | 766 | 0 | 43 | 5.30% | 809 |
During the downmarket, the benefits of buying early are even clearer. This could be an indication that during a downturn, developers don’t reduce their prices much or at all; so when the property market moves ahead later, early buyers are better rewarded.
Unlike the 2011–2013 upmarket, where losses started rising earlier (40 per cent and onwards), losses in the 2014 – 2016 downturn stayed below 3 per cent. This lasted all the way until the last 10 per cent of transactions. This is likely because developers have to moderate prices in a downturn, which benefits all buyers. Even for those in the later stages, it creates a buffer against losses.
| Buying Stage (0% = Early, 100% = Late) | Gain (ROI %) | Gains | Breakeven | Loss | Loss (ROI %) | Total Volume |
| 0% – 10% | 26.90% | 137 | 0 | 0 | 0.00% | 137 |
| 10% – 20% | 30.80% | 220 | 0 | 2 | 0.90% | 222 |
| 20% – 30% | 31.30% | 320 | 0 | 2 | 0.60% | 322 |
| 30% – 40% | 30.10% | 358 | 0 | 7 | 1.90% | 365 |
| 40% – 50% | 31.90% | 428 | 0 | 5 | 1.20% | 433 |
| 50% – 60% | 31.60% | 429 | 0 | 4 | 0.90% | 433 |
| 60% – 70% | 30.10% | 513 | 0 | 9 | 1.70% | 522 |
| 70% – 80% | 30.60% | 563 | 0 | 17 | 2.90% | 580 |
| 80% – 90% | 29.60% | 568 | 0 | 12 | 2.10% | 580 |
| 90% – 100% | 29.40% | 744 | 0 | 32 | 4.10% | 776 |
It appears that the property market today is more stable than in earlier cycles. Notice that returns are more consistent across the entire launch period, ranging between 26.9 to 31.9 per cent.
This is likely because the current market lacks the fervent FOMO-driven nature of the 2011 to 2013 run-up, and the policy-disrupted (cooling measures) downturn of 2014 to 2016.
Loss rates today are also much lower compared to the other two periods. From the 0 to 60 per cent bands, we barely registered any losses (0 to 1.2 per cent). Even in the late stages (80–90 per cent), the loss rate is only 2.1 per cent. These losses are far lower than the 10.7 per cent loss rate during the 2011–2013 upmarket, or the 5.3 per cent in the 2014–2016 downturn.
The highest loss rate is still among the latest-stage buyers (4.1 per cent), but it remains lower than in previous market cycles.
As such, we can conclude it’s still better to buy early today, but with the caveat that the downside risks of buying later have also diminished.
Next, let’s look at the relationship between the condo size and the benefits of buying early.
For this, we’re going to focus only on the first and last 20% of buyers given the sheer volume of transactions we have. We’ve also only included those with at least five transactions in these categories for better accuracy.
Here’s what we’ve uncovered:

The largest noticeable trend is that, for larger condos, early buyers tend to be in a slightly better position. This is less visible among smaller projects. This may be due to the nature of developer pricing strategies: with a big condo, which has many units sold over multiple phases, there may be more discernible price differences at each phase.
Larger condos are also those that are situated in the OCR which have been performing better in the past decade.
For smaller condos, every unit may be sold quickly in a short time, such as over a single launch weekend. This could result in lower price discrepancies, and there may be less difference based on how early or late you buy.
So, to conclude, we can end on three main points:
- Buying earlier does tend to result in better gains and lower risks of losses.
- But in the current market, the downside risks of being a late buyer are less compared to previous cycles, partially due to better holding power but also due to the market being at a high.
- The decision to buy earlier tends to pay off more in larger projects. For small or boutique projects, the benefits may be slimmer.
Next up, check out our case study of Treasure at Tampines, to see whether the earlier or later buyers fared better. Follow us on Stacked for these upcoming case studies.
At Stacked, we like to look beyond the headlines and surface-level numbers, and focus on how things play out in the real world.
If you’d like to discuss how this applies to your own circumstances, you can reach out for a one-to-one consultation here.
And if you simply have a question or want to share a thought, feel free to write to us at stories@stackedhomes.com — we read every message.
0 Comments