Should We Buy An Old But Central HDB, Or A Newer One But Located Further Away?
June 2, 2023
Dear Stacked Homes,
I’m sure I’m not alone in this dilemma, but unfortunately my friends have been lucky enough to get BTOs and SBFs, leaving us with nobody to consult on this topic.
We’re first-time buyers in our very late 20s who are looking for a 4-room resale in the Queenstown and Bukit Merah area, but are being priced out of the newer flats that generally start from $800k.
We cannot fully rule out the possibility of selling to upgrade in the future, so the lease decay that comes with old flats is a troubling consideration. Here comes the dilemma: Do we buy an older 1970s-1980s flat in that central fringe area, or do we buy a newer 1990s-2000s flat further out in areas like Dover (less amenities) or Jurong East?
We prefer to stay on the West to Central end of the East-West line to be closer to my parents, and we do not own a car – so locations like Depot Road may not make the most sense for us, albeit being priced more reasonably.
Which of the two options would make more sense financially, and are there any other factors we should take into consideration?
Also, truly a thank you for your site that has incredibly helpful for a creative and a first-time buyer who knew NOTHING about real estate. And I also love your amazing UX on the site!
Thank you!
Hello,
Thank you for your kind words, it’s great to hear that what we’ve been doing has been helpful (our creative director would certainly be happy regarding the UX!).
Housing for first-time buyers has certainly been a sticky topic, and the escalating prices of newer flats pose a significant challenge for young couples seeking to purchase their first home. This affordability issue extends beyond flats in central areas; even in outskirt locations such as Bukit Batok and Punggol, flats that have recently fulfilled their Minimum Occupation Period (MOP), are priced at over $700,000.
Before we delve into the options you could consider, one important factor to take into account is your intended holding period. The duration for which you plan to own the property can greatly influence your decision-making process.
Suppose you anticipate a relatively short holding period, let’s say around 5 years, and your intention is to sell the unit once it has fulfilled its MOP. In such a scenario, opting for an older flat may not pose a significant concern, as property prices are unlikely to experience drastic declines within the short term and the potential risks associated with buying an older flat might be mitigated. Any potential decline in value over a short period is unlikely to have any major impact on your financial outcome.
However, if you plan to stay for a longer period, ranging from 10 to 15 years, it would make more sense to consider purchasing a recently constructed property. Opting for a newer property offers several advantages for a longer-term stay. The first one is obvious, its remaining lease is longer, which generally attracts more potential buyers compared to properties with shorter remaining leases. Additionally, there may be cost savings on renovations for things like rewiring and piping works if the flat was recently refurbished.
Nevertheless, this is a general guideline, and the performance of properties can vary depending on their location. We will now jump into that!
Performance of 4-room HDBs in the city fringe
Let’s start by looking at the performance of 4-room flats built in the 1970s – 1980s in the city fringe. We will compare it against slightly newer flats that were completed between 1990 – 2000 and also the overall HDB market. And to keep things more relevant, we only included HDBs under Bukit Merah and Queenstown.
| Year | City fringe 4-room (1970 – 1989) | YoY | City fringe 4-room (1990 – 2000) | YoY | All HDB | YoY |
| 2002 | $270 | $336 | $211 | |||
| 2003 | $274 | 1.48% | $334 | -0.60% | $219 | 3.79% |
| 2004 | $275 | 0.36% | $318 | -4.79% | $227 | 3.65% |
| 2005 | $268 | -2.55% | $303 | -4.72% | $223 | -1.76% |
| 2006 | $273 | 1.87% | $312 | 2.97% | $229 | 2.69% |
| 2007 | $328 | 20.15% | $363 | 16.35% | $254 | 10.92% |
| 2008 | $395 | 20.43% | $428 | 17.91% | $303 | 19.29% |
| 2009 | $418 | 5.82% | $441 | 3.04% | $326 | 7.59% |
| 2010 | $466 | 11.48% | $481 | 9.07% | $367 | 12.58% |
| 2011 | $508 | 9.01% | $528 | 9.77% | $417 | 13.62% |
| 2012 | $554 | 9.06% | $567 | 7.39% | $444 | 6.47% |
| 2013 | $583 | 5.23% | $586 | 3.35% | $467 | 5.18% |
| 2014 | $541 | -7.20% | $585 | -0.17% | $435 | -6.85% |
| 2015 | $538 | -0.55% | $581 | -0.68% | $422 | -2.99% |
| 2016 | $541 | 0.56% | $566 | -2.58% | $423 | 0.24% |
| 2017 | $540 | -0.19% | $595 | 5.12% | $426 | 0.71% |
| 2018 | $499 | -7.59% | $596 | 0.17% | $422 | -0.94% |
| 2019 | $479 | -4.01% | $600 | 0.67% | $423 | 0.24% |
| 2020 | $486 | 1.46% | $573 | -4.50% | $443 | 4.73% |
| 2021 | $507 | 4.32% | $614 | 7.16% | $499 | 12.64% |
| 2022 | $536 | 5.72% | $640 | 4.23% | $540 | 8.22% |
| Annualised | 3.49% | 3.27% | 4.81% |
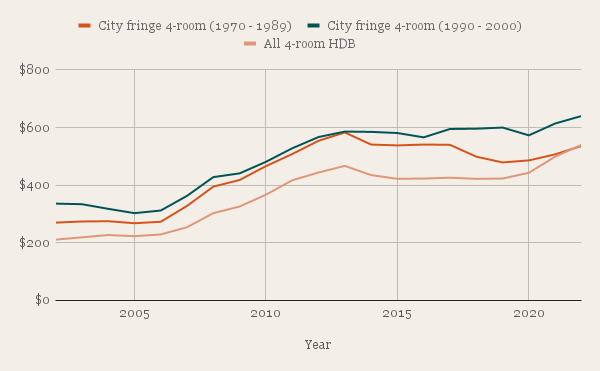
Based on the graph, it is evident that HDB prices experienced a decline in 2014. This dip can be attributed to the cooling measures implemented the previous year, along with a change in the HDB resale procedure where the flat’s valuation was conducted after the issuance of the Option to Purchase (OTP) instead of before. These factors resulted in a period of stagnation in HDB prices, which persisted until the onset of the pandemic.
The chart clearly illustrates that, during this stagnant period, the prices of flats completed between 1970 and 1989 declined further compared to their newer counterparts and the overall HDB market. We can also see that there is a noticeable discrepancy in prices between the older and newer flats.
Let’s take a look at some recent transactions in Bukit Merah and Queenstown to have a clearer picture of this price disparity.
4-room flats in Bukit Merah completed between 1979 – 1989:
In the last 3 months, there were 22 transactions with an average price of $547,686. These are some of the latest ones.
| Block | Street | Level | Size and unit type (sqm) | Lease start date | Remaining lease | Sale price | Date |
| 129 | Kim Tian Rd | 10 to 12 | 88 Improved | 1976 | 51 years 8 months | $548,000 | May 2023 |
| 27 | Telok Blangah Way | 04 to 06 | 82 Improved | 1976 | 52 years | $455,000 | May 2023 |
| 109 | Bt Purmei Rd | 10 to 12 | 104 Model A | 1984 | 60 years 4 months | $650,000 | May 2023 |
| 48 | Lengkok Bahru | 04 to 06 | 103 Model A | 1986 | 62 years 3 months | $588,000 | May 2023 |
| 62 | Telok Blangah Hts | 10 to 12 | 98 New Generation | 1976 | 52 years 6 months | $584,000 | Apr 2023 |
| 27 | Telok Blangah Way | 13 to 15 | 82 Improved | 1976 | 52 years 1 month | $487,000 | Apr 2023 |
| 34 | Telok Blangah Way | 10 to 12 | 82 Improved | 1976 | 52 years 1 month | $520,000 | Apr 2023 |
| 101 | Bt Purmei Rd | 04 to 06 | 93 New Generation | 1983 | 59 years 5 months | $545,000 | Apr 2023 |
4-room flats in Bukit Merah completed between 1990 – 2000:
In the last 3 months, there were just 3 transactions with an average price of $757,333.
| Block | Street | Level | Size and unit type (sqm) | Lease start date | Remaining lease | Sale price | Date |
| 13 | Jln Bt Merah | 10 to 12 | 100 Model A | 1996 | 72 years 7 months | $722,000 | May 2023 |
| 13 | Jln Bt Merah | 07 to 09 | 106 Model A | 1996 | 72 years 7 months | $750,000 | May 2023 |
| 40 | Jln Rumah Tinggi | 16 to 18 | 99 Model A | 1997 | 73 years 2 months | $800,000 | May 2023 |
On average, there was a price disparity of $209,647 between the older and newer flats in Bukit Merah.
4-room flats in Queenstown completed between 1979 – 1989:
In the last 3 months, there were 7 transactions with an average price of $587,686.
| Block | Street | Level | Unit size and type (sqm) | Lease start date | Remaining lease | Sale price | Date |
| 6 | Holland Cl | 22 to 24 | 86 Improved | 1974 | 50 years | $596,000 | May 2023 |
| 10 | Holland Ave | 07 to 09 | 88 Improved | 1975 | 50 years 9 months | $550,000 | May 2023 |
| 9 | Holland Ave | 19 to 21 | 86 Improved | 1974 | 50 years 2 months | $650,000 | Apr 2023 |
| 13 | Holland Dr | 10 to 12 | 88 Improved | 1975 | 50 years 10 months | $616,800 | Apr 2023 |
| 8 | Holland Ave | 07 to 09 | 82 Improved | 1974 | 50 years 3 months | $551,000 | Mar 2023 |
| 10 | Holland Ave | 07 to 09 | 88 Improved | 1975 | 50 years 10 months | $580,000 | Mar 2023 |
| 15 | Ghim Moh Rd | 07 to 09 | 82 Improved | 1977 | 52 years 11 months | $570,000 | Mar 2023 |
4-room flats in Queenstown completed between 1990 – 2000:
In the last 3 months, there were just 3 transactions with an average price of $818,333.
| Block | Street | Level | Size and unit type (sqm) | Lease start date | Remaining lease | Sale price | Date |
| 58 | Strathmore Ave | 07 to 09 | 96 Model A | 2000 | 76 years 5 months | $775,000 | May 2023 |
| 129 | Clarence Lane | 16 to 18 | 104 Model A | 1996 | 72 years 6 months | $890,000 | Mar 2023 |
| 59 | Strathmore Ave | 16 to 18 | 96 Model A | 2000 | 76 years 7 months | $790,000 | Mar 2023 |
On average, there was a price disparity of $230,647 between the older and newer flats in Queenstown.
Naturally, the extent of the price difference will differ depending on the specific blocks being compared but in general, the gap is relatively significant.
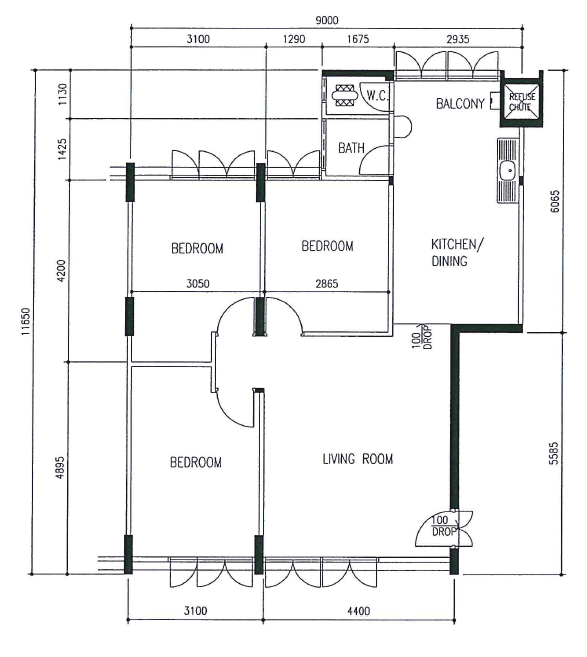
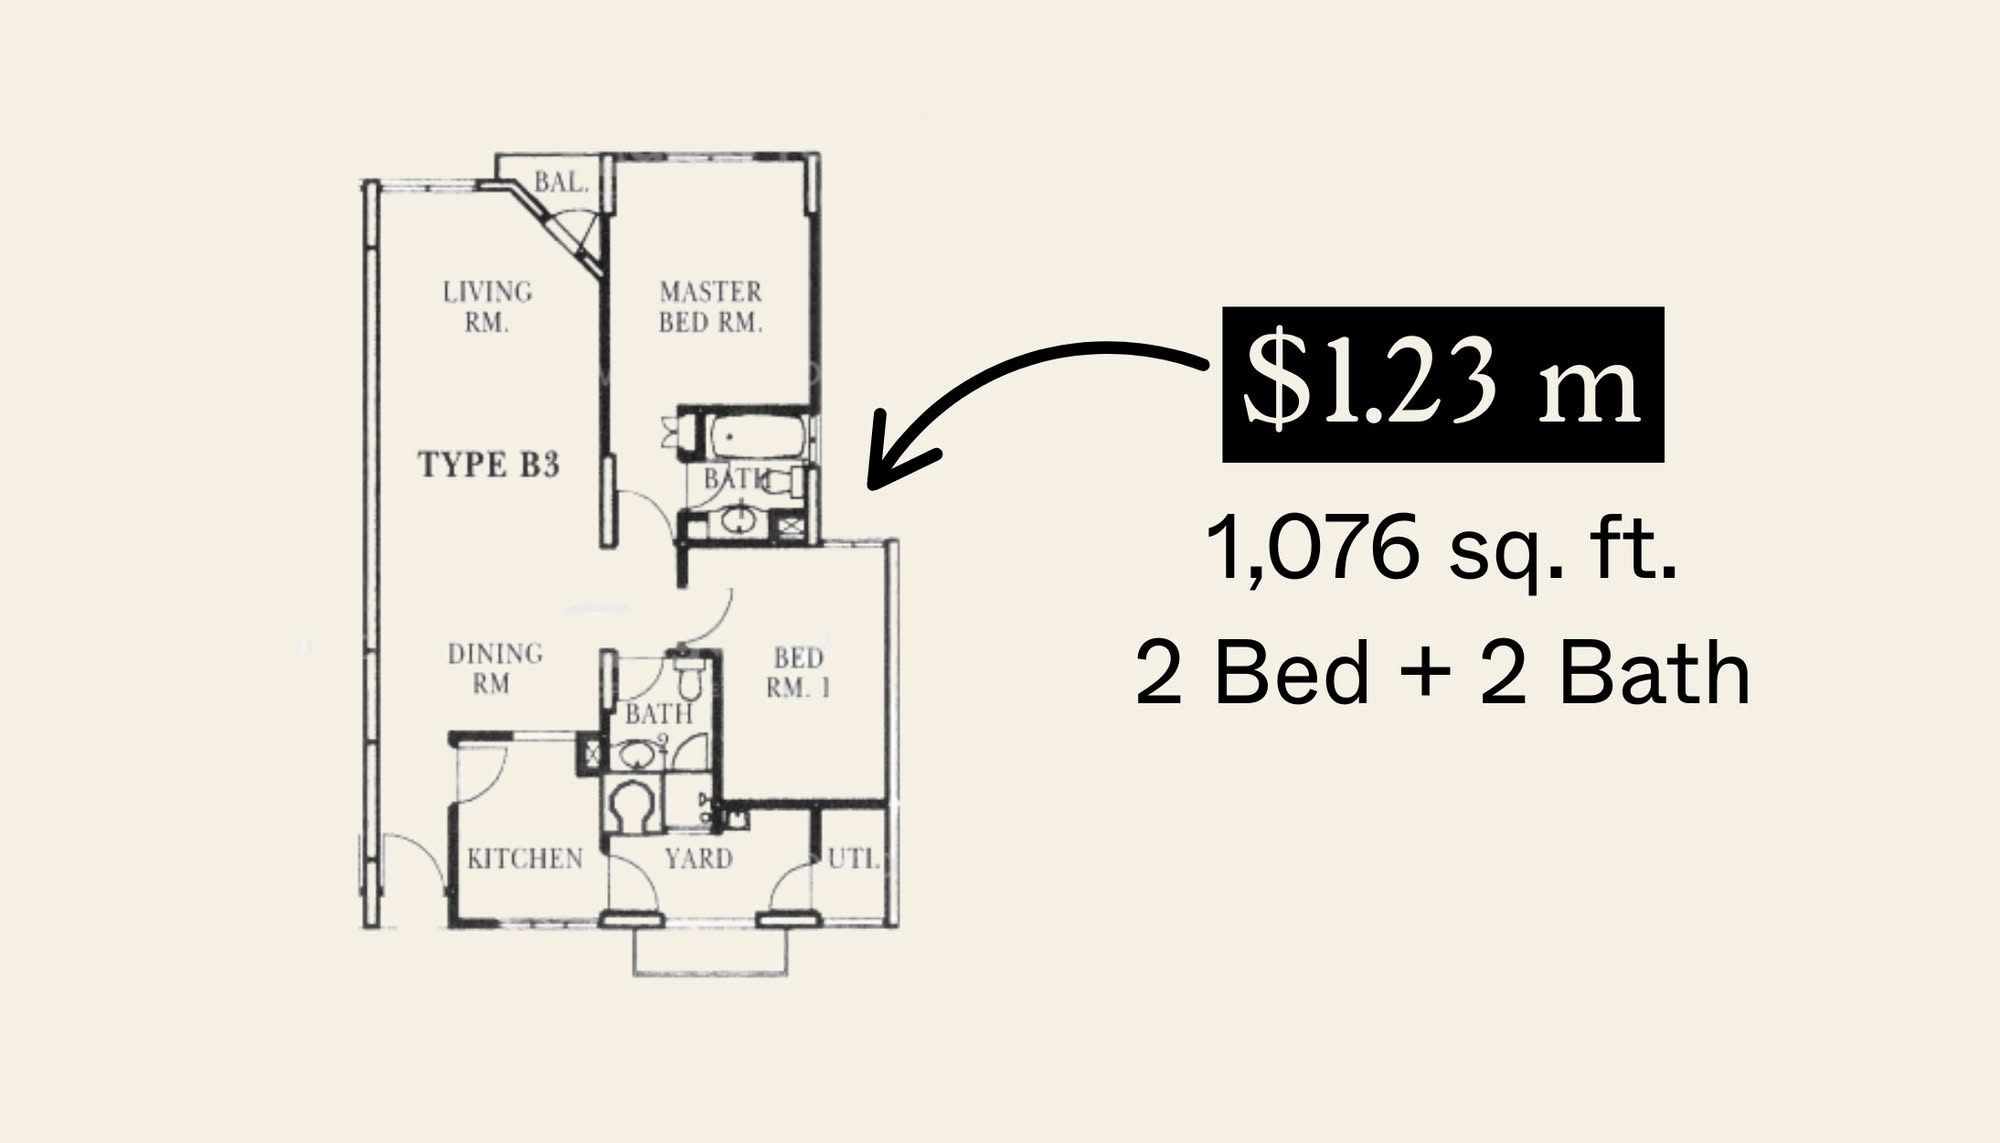
Another thing we can notice from the above tables is that the older flats in Bukit Merah and Queenstown that were built in the 1970s are mostly smaller. A “4-Improved” or “4-Standard” model comes with one bathroom, a separate WC and no store room. Here is an example of what that may look like.
Performance of 4-room HDBs in the West – city fringe region
Let’s now take a look at the performance of 4-room flats built in the same time periods in the West to city fringe region. We only included HDBs under Clementi and Jurong East.
| Year | West – city fringe 4-room (1970 – 1989) | YoY | West – city fringe 4-room (1990 – 2000) | YoY | All 4-room HDB | YoY |
| 2002 | $215 | $235 | $211 | |||
| 2003 | $223 | 3.72% | $244 | 3.83% | $219 | 3.79% |
| 2004 | 233 | 4.48% | 246 | 0.82% | $227 | 3.65% |
| 2005 | $227 | -2.58% | $240 | -2.44% | $223 | -1.76% |
| 2006 | $231 | 1.76% | $250 | 4.17% | $229 | 2.69% |
| 2007 | $260 | 12.55% | $264 | 5.60% | $254 | 10.92% |
| 2008 | $322 | 23.85% | $320 | 21.21% | $303 | 19.29% |
| 2009 | $340 | 5.59% | $353 | 10.31% | $326 | 7.59% |
| 2010 | $380 | 11.76% | $389 | 10.20% | $367 | 12.58% |
| 2011 | $429 | 12.89% | $426 | 9.51% | $417 | 13.62% |
| 2012 | $459 | 6.99% | $445 | 4.46% | $444 | 6.47% |
| 2013 | $470 | 2.40% | $481 | 8.09% | $467 | 5.18% |
| 2014 | $460 | -2.13% | $450 | -6.44% | $435 | -6.85% |
| 2015 | $448 | -2.61% | $454 | 0.89% | $422 | -2.99% |
| 2016 | $444 | -0.89% | $430 | -5.29% | $423 | 0.24% |
| 2017 | $435 | -2.03% | $447 | 3.95% | $426 | 0.71% |
| 2018 | $418 | -3.91% | $432 | -3.36% | $422 | -0.94% |
| 2019 | $399 | -4.55% | $421 | -2.55% | $423 | 0.24% |
| 2020 | $399 | 0.00% | $426 | 1.19% | $443 | 4.73% |
| 2021 | $432 | 8.27% | $453 | 6.34% | $499 | 12.64% |
| 2022 | $471 | 9.03% | $479 | 5.74% | $540 | 8.22% |
| Annualised | 4.00% | 3.62% | 4.81% |
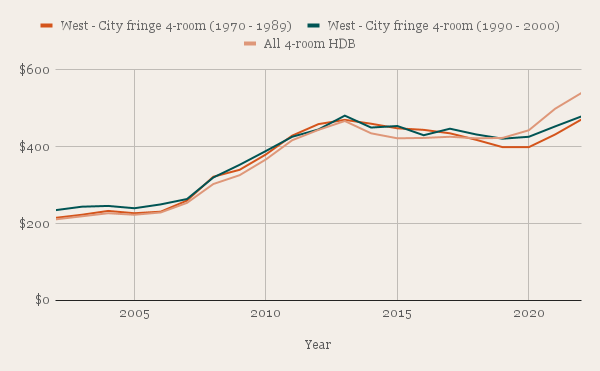
Looking at the graph, it is evident that the price trends of both older and newer 4-room flats in Clementi and Jurong East closely align with the overall HDB market. Also, the difference in prices is not as notable compared to those in the city fringe.
Similarly, we will take a look at some recent transactions in Clementi and Jurong East to have a clearer picture of this price disparity.
4-room flats in Clementi completed between 1979 – 1989:
In the last 3 months, there were 26 transactions with an average price of $542,880. These are some of the latest ones.
| Block | Street | Level | Size and unit type (sqm) | Lease start date | Remaining lease | Sale price | Date |
| 358 | Clementi Ave 2 | 04 to 06 | 92 New Generation | 1978 | 53 years 10 months | $525,000 | May 2023 |
| 512 | West Coast Dr | 10 to 12 | 91 New Generation | 1978 | 53 years 9 months | $488,000 | May 2023 |
| 305 | Clementi Ave 4 | 10 to 12 | 92 New Generation | 1979 | 54 years 11 months | $595,000 | May 2023 |
| 347 | Clementi Ave 5 | 07 to 09 | 92 New Generation | 1979 | 54 years 9 months | $525,000 | May 2023 |
| 347 | Clementi Ave 5 | 07 to 09 | 92 New Generation | 1979 | 54 years 8 months | $538,000 | May 2023 |
| 376 | Clementi Ave 4 | 10 to 12 | 91 New Generation | 1980 | 56 years 6 months | $588,888 | May 2023 |
| 373 | Clementi Ave 4 | 04 to 06 | 91 New Generation | 1981 | 57 years 4 months | $545,000 | May 2023 |
| 374 | Clementi Ave 4 | 07 to 09 | 93 New Generation | 1981 | 57 years 5 months | $550,000 | May 2023 |
| 610 | Clementi West St 1 | 04 to 06 | 104 Model A | 1983 | 59 years 4 months | $520,000 | May 2023 |
| 611 | Clementi West St 1 | 01 to 03 | 111 Model A | 1983 | 59 years 5 months | $553,000 | May 2023 |
As there were no flats in Clementi completed between 1990 – 2000, we took those that were completed in 2002:
In the last 3 months, there were 4 transactions with an average price of $713,750.
| Block | Street | Level | Size and unit type (sqm) | Lease start date | Remaining lease | Sale price | Date |
| 460 | Clementi Ave 3 | 04 to 06 | 86 Model A | 2002 | 78 years 8 months | $658,000 | Apr 2023 |
| 455 | Clementi Ave 3 | 07 to 09 | 86 Model A | 2002 | 78 years 9 months | $725,000 | Mar 2023 |
| 457 | Clementi Ave 3 | 22 to 24 | 91 Model A | 2002 | 78 years 10 months | $730,000 | Mar 2023 |
| 460 | Clementi Ave 3 | 16 to 18 | 90 Model A | 2002 | 78 years 9 months | $742,000 | Mar 2023 |
On average, there was a price disparity of $170,870 between the older and newer flats in Clementi.
4-room flats in Jurong East completed between 1979 – 1989:
In the last 3 months, there were 30 transactions with an average price of $467,338. These are some of the latest ones.
| Block | Street | Level | Size and unit type (sqm) | Lease start date | Remaining lease | Sale price | Date |
| 113 | Jurong East St 13 | 07 to 09 | 90 New Generation | 1981 | 57 years 1 month | $470,000 | May 2023 |
| 257 | Jurong East St 24 | 10 to 12 | 96 New Generation | 1983 | 58 years 8 months | $453,000 | May 2023 |
| 263 | Jurong East St 24 | 10 to 12 | 98 New Generation | 1983 | 58 years 9 months | $450,000 | May 2023 |
| 224 | Jurong East St 21 | 07 to 09 | 91 New Generation | 1984 | 60 years 6 months | $493,000 | May 2023 |
| 317 | Jurong East St 31 | 07 to 09 | 105 Model A | 1984 | 60 years 1 month | $494,000 | May 2023 |
| 316 | Jurong East St 32 | 07 to 09 | 104 Model A | 1984 | 60 years 4 months | $465,000 | May 2023 |
| 316 | Jurong East St 32 | 10 to 12 | 105 Model A | 1984 | 60 years 3 months | $528,000 | May 2023 |
| 316 | Jurong East St 32 | 07 to 09 | 112 Model A | 1984 | 60 years 4 months | $566,000 | May 2023 |
| 52 | Teban Gdns Rd | 07 to 09 | 83 Simplified | 1987 | 62 years 11 months | $410,000 | May 2023 |
4-room flats in Jurong East completed between 1990 – 2000:
In the last 3 months, there were just 2 transactions with an average price of $529,000.
| Block | Street | Level | Size and unit type (sqm) | Lease start date | Remaining lease | Sale price | Date |
| 268 | Toh Guan Rd | 01 to 03 | 101 Model A | 1999 | 74 years 10 months | $508,000 | May 2023 |
| 265 | Toh Guan Rd | 04 to 06 | 101 Model A | 1998 | 74 years 7 months | $550,000 | Mar 2023 |
On average, there was a price disparity of $61,662 between the older and newer flats in Jurong East.
In the case of Clementi, where no flats were constructed between 1990 and 2000, there is a significant price disparity when comparing older flats built between 1970 and 1989 with those constructed in 2002. However, when examining Jurong East, the difference in prices between the older and newer flats is not as substantial.
You’ll also notice that on average, the older flats in Clementi cost approximately $75,000 more than those in Jurong East which is quite a jump considering the two estates are side by side. Its pricing is actually comparable to the older flats in Bukit Merah and Queenstown. This suggests a potentially higher demand for flats in Clementi, which could be due to its status as a mature estate and its close proximity to several prominent educational institutions.
Additionally, it is worth mentioning that the older flats in Clementi and Jurong East predominantly consist of larger unit types such as “4 New Generation” and “4 Model A”, both of which come with 2 bathrooms and a store.
What does this mean?
The data suggests that the rate of depreciation for flats located in the outskirts is comparatively slower than those situated in the city fringe. It’s important to note that this observation is based on the analysis of these specific locations and two construction periods: 1970-1989 and 1990-2000 – it may not be the case moving forward. However, what can explain this pricing behaviour?
It’s likely that flats in the outskirts experienced a slower depreciation rate as they are more affordable. As prices of homes in Singapore go up, these older flats in the outskirts will seem increasingly attractive. It’s the same with the private market where flats in the Outside of Central Region saw the sharpest growth over the past years. In other words, having lower prices results in more room to grow.
Another reason why lower-priced flats could see better support is due to the availability of CPF housing grants. These grants are of a fixed amount, so for a lower-priced HDB, the proportion of the grant to the housing price is greater than if the HDB was priced higher.
As previously mentioned, determining the most suitable option depends on the intended holding period. If you anticipate a relatively short duration of stay, you can consider an older unit in the city fringe. The potential depreciation over a short timeframe is unlikely to have a significant impact, and especially if the location offers added convenience to your lifestyle, it could be worth the tradeoff.
However, if your plan is for a long-term stay, it is advisable to explore newer flats in the outskirts. These properties tend to experience less significant price depreciation over time. Additionally, the outskirts often offer larger unit types, providing a more spacious and comfortable living environment.
More pointers to take note of
More cash/ CPF outlay and reduced buyer pool for older flats
HDB has implemented a rule requiring the combined age of the youngest buyer and the remaining lease of the flat to reach 95 for buyers to qualify for the full loan amount, CPF housing grants, and the ability to fully utilise their CPF funds up to 120% of the Valuation Limit (VL).
In situations where the sum falls below 95, the loan quantum, CPF housing grants, and CPF withdrawal limit will be proportionally adjusted. This requirement may discourage younger buyers from purchasing such flats, as they would need to contribute more cash or CPF funds if they do not meet the eligibility criteria. This consideration also applies to your situation as a buyer in your late 20s.
To illustrate, let’s consider a flat with a remaining lease of 50 years. In order to be eligible for the full loan and CPF housing grants, the youngest buyer must be at least 45 years old.
Assuming you’re 28 and were to purchase this flat. We used the CPF housing usage calculator to estimate the figures based on a flat with 50 years of remaining lease, buyers aged 28, and a unit valued at $600,000. The maximum CPF withdrawal amount is capped at $384,000, which corresponds to approximately 64% of the valuation. This means that once you have utilised $384,000 of CPF funds for the downpayment and/or monthly loan repayments, the remaining monthly loan repayments will need to be paid in cash.
It is important to note that the withdrawal limit will vary depending on the age of the buyer and the remaining lease of the flat.
Check on whether the flat has undergone the Home Improvement Programme (HIP)
There are two reasons for this. Firstly, if the flat has undergone the HIP, there may be reduced maintenance work required, leading to potential savings on renovation costs. Secondly, HDB does not immediately bill homeowners after the completion of the HIP. Instead, the billing process occurs when the works for the entire precinct are finalized, which can take some time. If you purchase the property before the HIP is billed, you will be responsible for paying the bill once it arrives.
For Singaporeans, this may not be a significant concern as the HIP is subsidised, and they typically only need to pay a portion of the cost, ranging from 5% to 12.5%. This amount is usually less than $1,500 and can be paid through CPF funds. However, for Permanent Residents (PRs), the HIP is not subsidised, and they are required to pay the full amount, which can reach up to $10,000. We just wanted to put this out there for the sake of completeness.
Older flats may have higher renovation costs
Following on the previous point, older flats tend to have more wear and tear issues (naturally) that you may need to fix. Cracked tiles, sagging doors choked pipes – you may find yourself in a situation of having to do a complete makeover. It may even be the case that certain problems, such as leakages in the home, may be coming from the neighbour’s unit and not yours which could be harder to co-ordinate.
To conclude
The initial consideration is to determine the duration of your intended stay in the property. Since you are purchasing an older flat, it is unlikely that you will experience significant price appreciation, unless there are market conditions that lead to a surge in demand, such as the housing supply shortage observed during and after the pandemic when older flats were quickly snapped up. Nevertheless, most homeowners aim to avoid substantial losses when selling their homes. To mitigate this risk, it is advisable to explore properties with a slower depreciation rate, particularly if you plan to reside there for an extended period.
Perhaps to put things in a different context, how much do you really value your time? As they say, time is the most valuable asset that anyone has.
Let’s say buying an older flat in a much better, convenient location might lose $100k in value over the next 10 years.
Whereas a newer flat in a less convenient location might appreciate by $100k over the next 10 years. The difference to you? $200k.
But consider this. If you both have to travel an hour extra to work each day because of the location (260 work days), that’s 520 hours saved a year. In 10 years, that’s 5,200 hours that is time you could have saved. Essentially, that costs you $38 per hour – so in the worst-case scenario, how much is that additional time worth to you?
Also, since this property will be your first home, don’t overlook the little factors beyond price that can impact your lifestyle. For instance, evaluate whether residing in a smaller flat with only one bathroom would be comfortable for you. Assess whether living in the city fringe would offer greater convenience in certain aspects of your life. Contemplate how residing in the outskirts could affect your commute time to work.
Walking further to the MRT station on a breezy day may not seem so bad, but do it daily and the inconvenience may start to set in.
Have a question to ask? Shoot us an email at stories@stackedhomes.com – and don’t worry, we will keep your details anonymous.
For more news and information on the Singapore private property market or an in-depth look at new and resale properties, follow us on Stacked.
At Stacked, we like to look beyond the headlines and surface-level numbers, and focus on how things play out in the real world.
If you’d like to discuss how this applies to your own circumstances, you can reach out for a one-to-one consultation here.
And if you simply have a question or want to share a thought, feel free to write to us at stories@stackedhomes.com — we read every message.
Need help with a property decision?
Speak to our team →Read next from Property Advice

Property Advice We Can Buy Two HDBs Today — Is Waiting For An EC A Mistake?

Property Advice I’m 55, Have No Income, And Own A Fully Paid HDB Flat—Can I Still Buy Another One Before Selling?

Property Advice We’re Upgrading From A 5-Room HDB On A Single Income At 43 — Which Condo Is Safer?

Property Advice We’re In Our 50s And Own An Ageing Leasehold Condo And HDB Flat: Is Keeping Both A Mistake?
Latest Posts
Pro River Modern Starts From $1.548M For A Two-Bedder — How Its Pricing Compares In River Valley
New Launch Condo Reviews River Modern Condo Review: A River-facing New Launch with Direct Access to Great World MRT Station
On The Market Here Are The Cheapest 5-Room HDB Flats Near An MRT You Can Still Buy From $550K






0 Comments