I’ve $500k In Cash Savings Looking For An Investment Condo In West Coast: Which Is Best For Rental And Capital Appreciation?
Get The Property Insights Serious Buyers Read First: Join 50,000+ readers who rely on our weekly breakdowns of Singapore’s property market.
Hello Stacked Homes,
I am a loyal reader of your articles as they are so informative to read, especially those pertaining to advice to readers. I would like to seek your advice regarding my situation and would like to hear your thoughts!
I am 38 years old now, single and currently staying with parents in the West Coast area. I’m looking to buy my first investment property near them but cannot decide on which condo to go for.
Plan: Rent out the condo for the foreseeable future but may own-stay in future. Planning to hold for ~10 years but open to longer if en-bloc prospects are good
Background: I currently have no loan, $200k in CPF OA, $500k in cash (planning to max out bank loan though), monthly income of ~$10.7k with 3 months bonus every year. I have a separate stock portfolio that generates sufficient dividends for my expenses.
Questions:
- Is a $1.5M budget condo feasible?
- I’m looking at 2 or 3 BR in the West Coast area with good rental yield and capital appreciation, and possible en-bloc prospects (secondary). I’ve narrowed my choices to condos in the same area, namely Blue Horizon, The Vision, Seahill (avoid the loft types), Varisty Park and Clementiwoods. Which one do you recommend?
- Are the condos in west coast area good in general? Or do you recommend any other alternatives nearby this area?
Thank you for reading through this and I look forward to your insights and suggestions as always!
Hi there,
We appreciate your support and thanks for the kind words!
Given your primary focus on purchasing the property for investment purposes, the key considerations should revolve around the project’s potential for appreciation and rental yield.
To be candid, it’s always difficult to mix own-stay and investment. What may constitute as a good investment property may not be what you like personally, and vice versa. As such, if you aren’t strict on your timeline, an alternative approach could involve initially investing in a property and, when deciding to move in, selling the investment property and purchasing one for personal residence.
This may be more flexible if your own stay needs should change in the future, or also if your parents ever decide to move for whatever reasons.
Nevertheless, let’s start by assessing your affordability before looking into the various projects you’ve picked out.
Affordability
| Description | Amount |
| Maximum loan based on age 38 with a monthly income of $10,700 at 4.6% interest | $1,090,783 (27-year tenure) |
| CPF funds | $200,000 |
| Cash | $500,000 |
| Total loan + CPF + cash | $1,790,783 |
| BSD based on $1,790,783 | $59,139 |
| Estimated affordability | $1,731,644 |
With a $1.7M budget, a 2 or 3-bedder is feasible depending on which projects you’re considering.
Shortlisted projects

Given that all the developments are situated in the same area, they share similar amenities.
Each of the five projects is conveniently located within walking distance of West Coast Plaza and West Coast Market Square, providing a diverse range of dining options and shops for everyday needs. Additionally, a brief stroll will take you to West Coast Park. Some units may enjoy unobstructed sea views.
The proximity to the National University of Singapore and National University Hospital can be advantageous for potential renters. However, it’s important to note that there are no MRT stations within walking distance. For those without private transportation, taking a bus is necessary. Depending on traffic conditions, the journey to Clementi MRT station could take anywhere from 15 to 30 minutes.
1. Blue Horizon
Blue Horizon falls within the upper range of mid-sized projects and has a total of 616 units consisting of 2 and 3-bedroom configurations. With a 99-year tenure that commenced in 2000, the development is currently 24 years old and was completed in 2005. Now, let’s assess the performance of this project in comparison to other 99-year leasehold developments in District 5 and throughout Singapore.
Project performance

| Year | All non-landed 99y private property (resale) | YoY | D05 non-landed 99y private property (resale) | YoY | Blue Horizon | YoY |
| 2013 | $1,057 | – | $1,151 | – | $1,137 | – |
| 2014 | $1,029 | -2.65% | $1,074 | -6.69% | $1,097 | -3.52% |
| 2015 | $1,033 | 0.39% | $1,077 | 0.28% | $1,046 | -4.65% |
| 2016 | $1,129 | 9.29% | $1,011 | -6.13% | $990 | -5.35% |
| 2017 | $1,115 | -1.24% | $1,043 | 3.17% | $991 | 0.10% |
| 2018 | $1,153 | 3.41% | $1,140 | 9.30% | $1,044 | 5.35% |
| 2019 | $1,178 | 2.17% | $1,148 | 0.70% | $1,054 | 0.96% |
| 2020 | $1,173 | -0.42% | $1,154 | 0.52% | $1,047 | -0.66% |
| 2021 | $1,207 | 2.90% | $1,308 | 13.34% | $1,124 | 7.35% |
| 2022 | $1,337 | 10.77% | $1,442 | 10.24% | $1,233 | 9.70% |
| 2023 | $1,464 | 9.50% | $1,542 | 6.93% | $1,333 | 8.11% |
| Average | – | 3.41% | – | 3.17% | – | 1.74% |
Despite the seemingly aligned price trend of Blue Horizon with the overall market in the graph, the table reveals a significantly slower average growth rate for the past decade. Examining its year-on-year performance, it becomes apparent that, unlike the broader market’s recovery post-2014, Blue Horizon experienced a continued decline in prices, remaining relatively stagnant until the onset of the pandemic.
Recent transactions
2-bedroom units
| Date | Size (sqft) | PSF | Price | Blk & level |
| Jan 2024 | 969 | $1,391 | $1,348,000 | 29 West Coast Crescent #20 |
| Oct 2023 | 958 | $1,305 | $1,250,000 | 29 West Coast Crescent #04 |
3-bedroom units
| Date | Size (sqft) | PSF | Price | Blk & level |
| Dec 2023 | 1,163 | $1,445 | $1,680,000 | 27 West Coast Crescent #08 |
| Nov 2023 | 1,163 | $1,385 | $1,610,000 | 23 West Coast Crescent #07 |
| Oct 2023 | 1,163 | $1,437 | $1,670,000 | 23 West Coast Crescent #11 |
| Oct 2023 | 1,227 | $1,491 | $1,830,000 | 29 West Coast Crescent #21 |
With a budget of $1.7M, you will be able to afford either a 2 or 3-bedroom unit.
Rental yield
| Unit type | Average transacted price in 2023 | Average rent from Sep – Nov 2023 | Rental yield |
| 2-bedroom | $1,294,600 | $4,222 | 3.91% |
| 3-bedroom | $1,559,827 | $5,638 | 4.34% |
Based on the rental transactions done between September to November last year, the rental yields are pretty good. Note though, that this isn’t likely to continue.
Unit layout
2-bedroom (926 sq ft)

The 2-bedroom units range in size from 904 to 1,130 sq ft, featuring 2 bedrooms and 2 bathrooms. Larger units include either a study corner or a study room, and certain units boast a Private Enclosed Space (PES). Except for units with a PES, the others do not include a balcony. A 900 sqft size for a 2-bedroom unit is notably spacious, especially considering the absence of a balcony. The layout efficiently utilises the living space, minimising any unnecessary wastage. The design prioritises privacy, as the main door does not open directly into the living area, and the living and dining rooms are thoughtfully separated. The kitchen is equipped with a service yard and a household shelter, which is a practical addition for any storage needs. Placing the household shelter within the kitchen discreetly addresses concerns some may have about its appearance.
3-bedroom (1,152 sq ft)

The 3-bedroom units vary in size from 1,152 to 1,475 sq ft. Similar to the 2-bedroom units, the larger 3-bedroom units are equipped with either a study corner, a study room, or a Private Enclosed Space (PES). All 3-bedroom units feature 2 bathrooms and a WC located in the kitchen. The layout is regularly shaped, simplifying furniture placement and planning. The bedrooms are spacious and can easily accommodate a double bed, with the master bedroom being particularly roomy. The kitchen is complemented by a generously sized yard, providing utility for storing bulkier items such as bicycles, and it also comes with a home shelter.
2. The Vision
The Vision falls within the lower range of mid-sized developments, featuring 281 condominium units ranging from 2 to 4 bedrooms, along with 14 strata landed houses. Although it was completed in 2014, its 99-year lease commenced in 2008, making the development 16 years old.
Project performance

| Year | All non-landed 99y private property (resale) | YoY | D05 non-landed 99y private property (resale) | YoY | The Vision | YoY |
| 2015 | $1,033 | – | $1,077 | – | $1,225 | – |
| 2016 | $1,129 | 9.29% | $1,011 | -6.13% | $1,206 | -1.55% |
| 2017 | $1,115 | -1.24% | $1,043 | 3.17% | $1,197 | -0.75% |
| 2018 | $1,153 | 3.41% | $1,140 | 9.30% | $1,283 | 7.18% |
| 2019 | $1,178 | 2.17% | $1,148 | 0.70% | $1,184 | -7.72% |
| 2020 | $1,173 | -0.42% | $1,154 | 0.52% | $1,267 | 7.01% |
| 2021 | $1,207 | 2.90% | $1,308 | 13.34% | $1,332 | 5.13% |
| 2022 | $1,337 | 10.77% | $1,442 | 10.24% | $1,477 | 10.89% |
| 2023 | $1,464 | 9.50% | $1,542 | 6.93% | $1,574 | 6.57% |
| Average | – | 4.55% | – | 4.76% | – | 3.35% |
Since The Vision was completed in 2014, resale transactions commenced in 2015, providing us with only 8 years of data. While its growth rate is slightly slower compared to the overall market, an examination of the year-on-year data reveals a consistent and steady increase in the last couple of years, aligning well with the average price PSF in District 05.
Recent transactions:
2-bedroom units
| Date | Size (sqft) | PSF | Price | Blk & level |
| Jan 2023 | 904 | $1,526 | $1,380,000 | 79 West Coast Crescent #19 |
3-bedroom units
| Date | Size (sqft) | PSF | Price | Blk & level |
| Oct 2023 | 1,302 | $1,555 | $2,025,000 | 81 West Coast Crescent #07 |
| Oct 2023 | 1,302 | $1,689 | $2,200,000 | 81 West Coast Crescent #30 |
| Oct 2023 | 1,313 | $1,588 | $2,085,000 | 81 West Coast Crescent #27 |
| Sep 2023 | 1,313 | $1,508 | $1,980,000 | 81 West Coast Crescent #05 |
Looking at the transactions, it appears a 3-bedder is likely out of your budget so we will focus on the 2-bedders instead.
Rental yield
| Unit type | Average transacted price in 2023 | Average rent from Sep – Nov 2023 | Rental yield |
| 2-bedroom | $1,380,000 | $4,400 | 3.83% |
Unit layout
2-bedroom (904 sq ft)

The 2-bedroom units vary in size from 818 to 904 sq ft, and the smaller units feature a single bathroom instead of two. All units include a balcony and bay windows in the bedrooms. The appreciation for bay windows is subjective; some consider them a waste of space, while others find creative ways to incorporate them into their living areas.
Despite the presence of bay windows, the bedrooms are adequately spacious and can easily accommodate a double bed. The kitchen, though compact, is designed for functionality and includes a home shelter.
3. Seahill
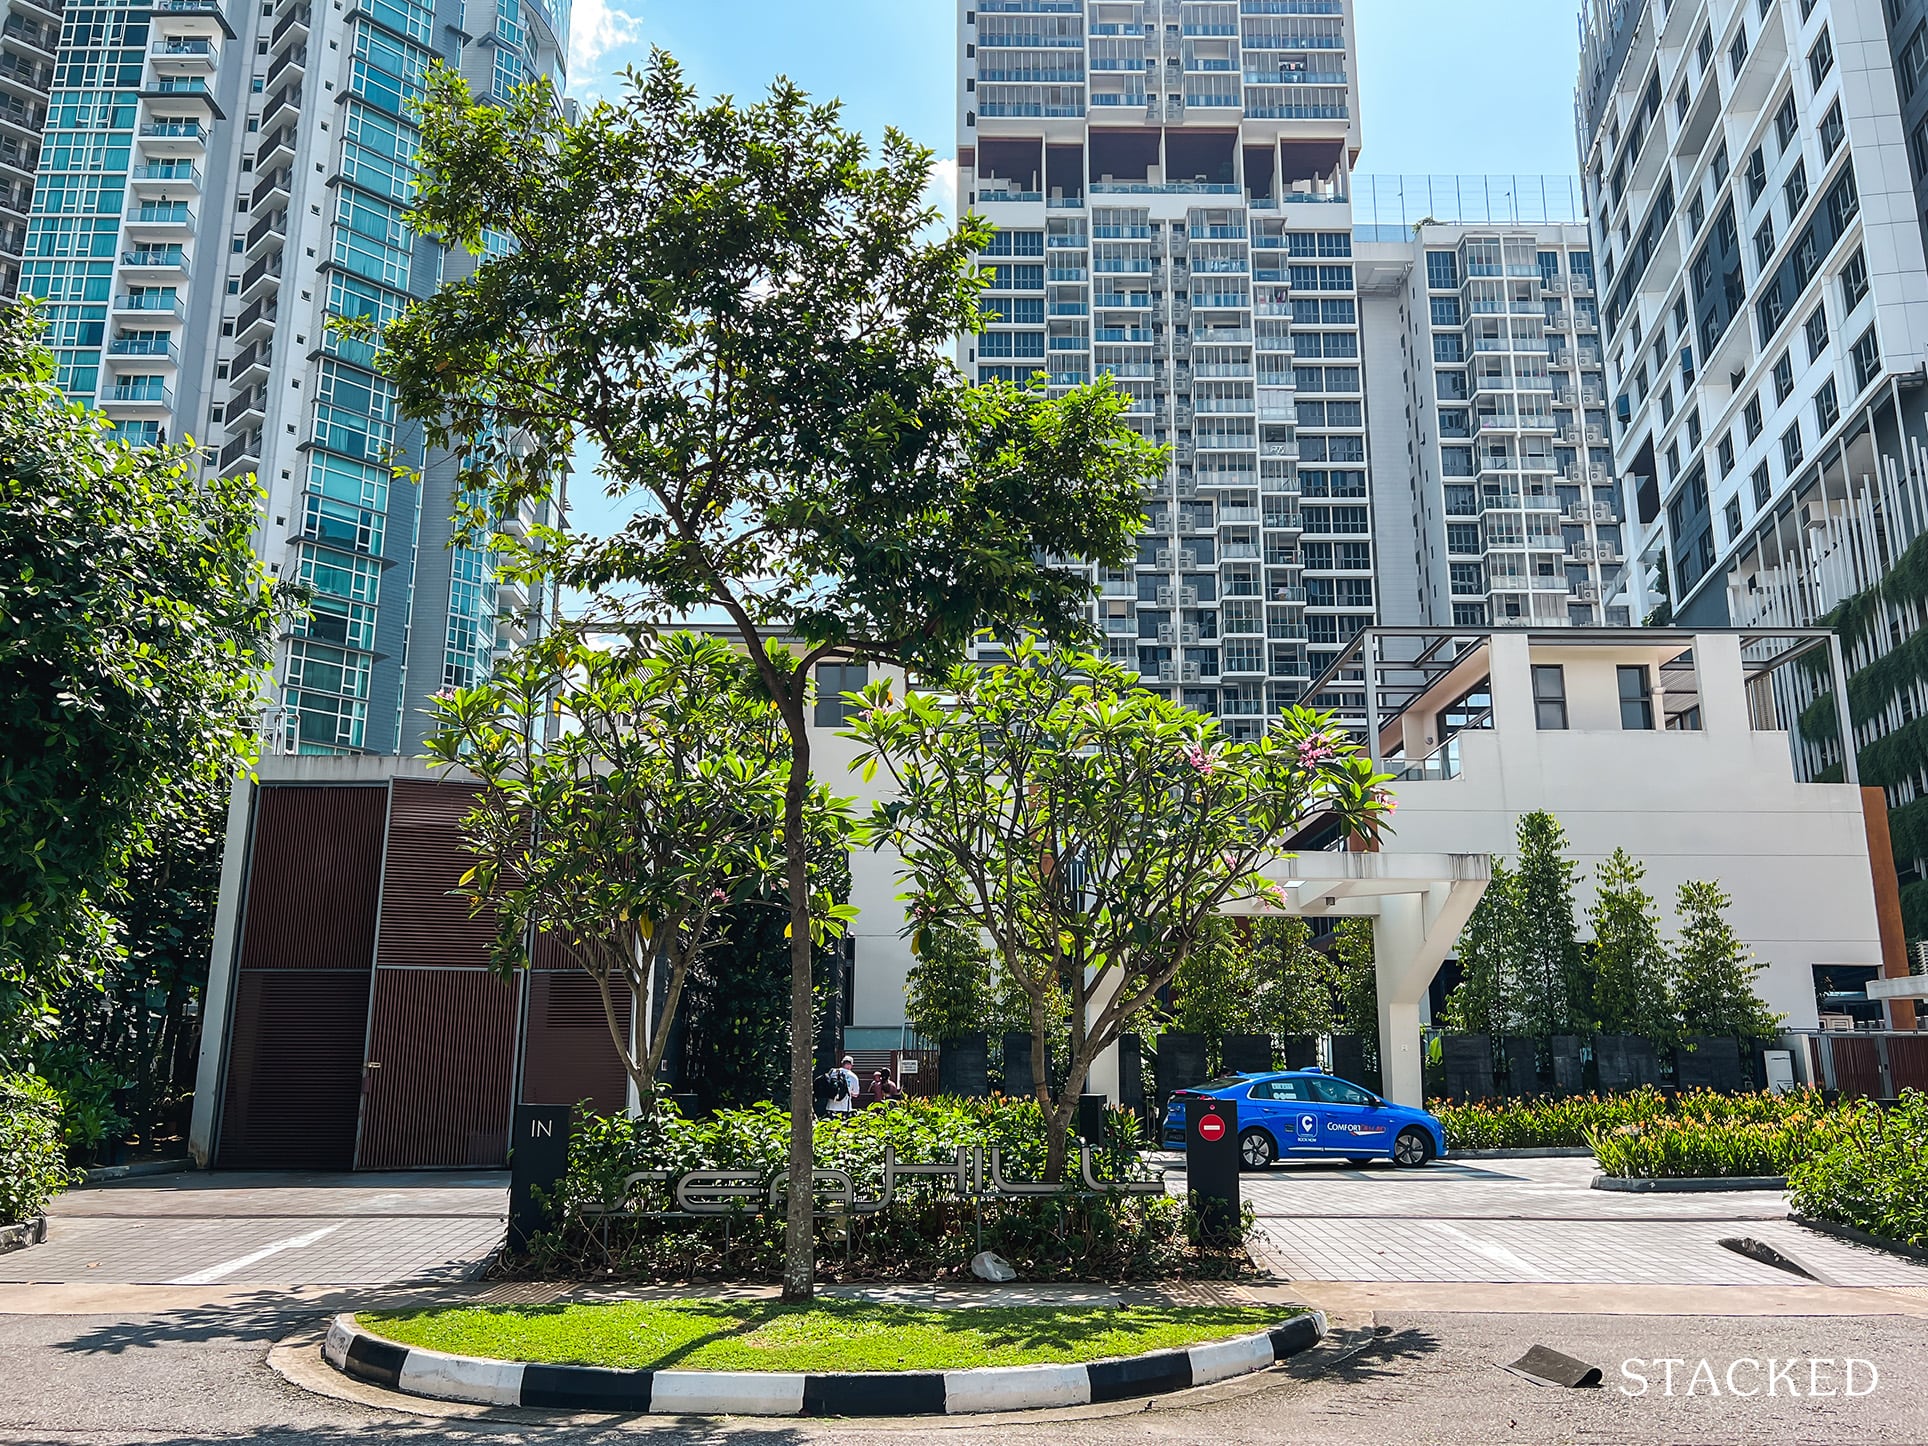
Seahill is a mid-sized development comprising 460 condominium units, ranging from 1 to 3 bedrooms, along with 18 strata landed houses. Completed in 2016, the development holds a 99-year lease that commenced in 2011, making it 13 years old.
Project performance

| Year | All non-landed 99y private property (resale) | YoY | D05 non-landed 99y private property (resale) | YoY | Seahill | YoY |
| 2017 | $1,115 | – | $1,043 | – | $1,401 | – |
| 2018 | $1,153 | 3.41% | $1,140 | 9.30% | $1,392 | -0.64% |
| 2019 | $1,178 | 2.17% | $1,148 | 0.70% | $1,395 | 0.22% |
| 2020 | $1,173 | -0.42% | $1,154 | 0.52% | $1,346 | -3.51% |
| 2021 | $1,207 | 2.90% | $1,308 | 13.34% | $1,408 | 4.61% |
| 2022 | $1,337 | 10.77% | $1,442 | 10.24% | $1,473 | 4.62% |
| 2023 | $1,464 | 9.50% | $1,542 | 6.93% | $1,543 | 4.75% |
| Average | – | 4.72% | – | 6.84% | – | 1.67% |
Since Seahill is a relatively new development, we have only six years of resale data to look at. In comparison to other non-landed properties in District 5 and throughout the island, its performance exhibits a notably slower pace. It’s important to consider that the project was launched in 2012 during a flourishing property market, leading many owners to acquire units at higher prices PSF. Given this context, owners may be hesitant to sell at a loss, potentially contributing to lower transaction volumes and a slower appreciation rate. We have previously written an article discussing this which you can read here.
Recent transactions:
2-bedroom units
| Date | Size (sqft) | PSF | Price | Blk & level |
| Dec 2023 | 861 | $1,649 | $1,420,000 | 119 West Coast Crescent #08 |
| Nov 2023 | 1,130 | $1,619 | $1,830,000 | 119 West Coast Crescent #17 |
| Apr 2023 | 861 | $1,649 | $1,420,000 | 121 West Coast Crescent #15 |
3-bedroom units
| Date | Size (sqft) | PSF | Price | Blk & level |
| Dec 2023 | 1,044 | $1,705 | $1,780,000 | 119 West Coast Crescent #15 |
| Sep 2023 | 1,044 | $1,628 | $1,700,000 | 119 West Coast Crescent #12 |
| Aug 2023 | 1,044 | $1,609 | $1,680,000 | 119 West Coast Crescent #11 |
Based on the recent transactions, you will be able to afford both a 2 and 3-bedroom unit at Seahill.
Rental yield
| Unit type | Average transacted price in 2023 | Average rent from Sep – Nov 2023 | Rental yield |
| 2-bedroom | $1,420,000 | $4,800 | 4.06% |
| 3-bedroom | $1,720,000 | $5,800 | 4.05% |
* For the 2-bedders, we omitted the 1,130 sq ft transaction which is a unit with a huge balcony
Unit layout
2-bedroom (861 sq ft)

The 2-bedroom units range from 861 to 1,130 sq ft, offering various layouts. Some include a study, a common bedroom with a loft, or a sizable balcony/PES. Considering your preference against having a loft, this particular layout may be what you are interested in.
The dry kitchen can function as a small dining area, but for those desiring a larger dining space, the balcony seems spacious enough to accommodate a 4-6 seater dining set. Opting for this arrangement allows the living space to remain expansive. With the kitchen’s strategic placement, there is an option to enclose it if desired. Additionally, the kitchen features a ventilated utility room suitable for storage or even as a helper’s room. The bedrooms are generously sized and have regular shapes, facilitating easy furniture placement and planning.
3-bedroom (1,044 sq ft)

The 3-bedroom units vary in size from 1,044 to 1,302 sq ft and offer different layouts. Larger units feature a spacious balcony/ PES, a yard, and a WC in the kitchen. Some units have the unique characteristic of two separate balconies. The 1,044 sq ft layout is quite similar to the aforementioned 2-bedroom layout, with the addition of an extra bedroom.
4. Varsity Park Condominium
Varsity Park is another mid-sized development comprising 530 units ranging from 2 to 4 bedrooms. It achieved its Temporary Occupation Permit (TOP) in 2008, and its 99-year lease commenced in 2004, making the development 20 years old.
Project performance

| Year | All non-landed 99y private property (resale) | YoY | D05 non-landed 99y private property (resale) | YoY | Varsity Park Condominium | YoY |
| 2013 | $1,057 | – | $1,151 | – | $1,084 | – |
| 2014 | $1,029 | -2.65% | $1,074 | -6.69% | $1,021 | -5.81% |
| 2015 | $1,033 | 0.39% | $1,077 | 0.28% | $1,082 | 5.97% |
| 2016 | $1,129 | 9.29% | $1,011 | -6.13% | $1,059 | -2.13% |
| 2017 | $1,115 | -1.24% | $1,043 | 3.17% | $1,083 | 2.27% |
| 2018 | $1,153 | 3.41% | $1,140 | 9.30% | $1,083 | 0.00% |
| 2019 | $1,178 | 2.17% | $1,148 | 0.70% | $1,117 | 3.14% |
| 2020 | $1,173 | -0.42% | $1,154 | 0.52% | $1,106 | -0.98% |
| 2021 | $1,207 | 2.90% | $1,308 | 13.34% | $1,131 | 2.26% |
| 2022 | $1,337 | 10.77% | $1,442 | 10.24% | $1,250 | 10.52% |
| 2023 | $1,464 | 9.50% | $1,542 | 6.93% | $1,390 | 11.20% |
| Average | – | 3.41% | – | 3.17% | – | 2.64% |
Upon examination, it becomes apparent that while Varsity Park’s growth rate is marginally slower than that of the broader market, the difference is not very significant. Moreover, a closer look at the year-on-year movements reveals that it aligns with the overall market trends.
Recent transactions:
2-bedroom units
| Date | Size (sqft) | PSF | Price | Blk & level |
| Nov 2023 | 1,033 | $1,529 | $1,580,000 | 74 West Coast Road #04 |
| Jul 2023 | 1,012 | $1,463 | $1,480,000 | 38 West Coast Road #02 |
| Jul 2023 | 1,313 | $1,355 | $1,780,000 | 40 West Coast Road #01 |
3-bedrooms units
| Date | Size (sqft) | PSF | Price | Blk & level |
| Nov 2023 | 1,399 | $1,454 | $2,035,000 | 54 West Coast Road #03 |
| Oct 2023 | 1,281 | $1,483 | $1,900,000 | 50 West Coast Road #04 |
| Oct 2023 | 1,292 | $1,440 | $1,860,000 | 36 West Coast Road #02 |
| Jul 2023 | 1,991 | $1,220 | $2,430,000 | 74 West Coast Road #05 |
Looking at the recent transactions, a 3-bedder is likely out of your budget so we will focus on the 2-bedders.
Rental yield
| Unit type | Average transacted price in 2023 | Average rent from Sep – Nov 2023 | Rental yield |
| 2-bedroom | $1,542,000 | $5,600 | 4.36% |
Unit layout
2-bedroom (1,033 sq ft)

The 2-bedroom units vary in size from 990 to 1,496 sq ft, all featuring 2 bathrooms and an enclosed kitchen equipped with a home shelter, yard, and WC. Some of the larger units come with 2 planter boxes or an open terrace, and some may include a sizable PES. The units are generously sized, with segregated living and dining areas. Both bedrooms offer ample space to comfortably accommodate a double bed, and even the common room can fit two single beds along with side tables and a wardrobe.
Given the layout, it may be feasible to set up a walk-in wardrobe in the master bedroom if desired. The kitchen is spacious and includes a separate yard space where the home shelter and WC are located. Considering the unit’s size, it could be suitable for a family of 3 or 4. The unit’s size and layout may contribute to the demand for both purchases and rentals in the project.
5. Clementiwoods Condominium
Clementiwoods falls within the lower range of mid-sized developments, consisting of 240 units that include a diverse range of 1 to 5-bedroom types. As a 99-year leasehold property, its lease commenced in 2006, making it 18 years old, and it obtained its TOP in 2010.
Project performance

| Year | All non-landed 99y private property (resale) | YoY | D05 non-landed 99y private property (resale) | YoY | Clementiwoods Condominium | |
| 2013 | $1,057 | – | $1,151 | – | $1,242 | – |
| 2014 | $1,029 | -2.65% | $1,074 | -6.69% | $1,056 | -14.98% |
| 2015 | $1,033 | 0.39% | $1,077 | 0.28% | $1,063 | 0.66% |
| 2016 | $1,129 | 9.29% | $1,011 | -6.13% | $1,072 | 0.85% |
| 2017 | $1,115 | -1.24% | $1,043 | 3.17% | $1,018 | -5.04% |
| 2018 | $1,153 | 3.41% | $1,140 | 9.30% | $1,118 | 9.82% |
| 2019 | $1,178 | 2.17% | $1,148 | 0.70% | $1,116 | -0.18% |
| 2020 | $1,173 | -0.42% | $1,154 | 0.52% | $1,094 | -1.97% |
| 2021 | $1,207 | 2.90% | $1,308 | 13.34% | $1,147 | 4.84% |
| 2022 | $1,337 | 10.77% | $1,442 | 10.24% | $1,317 | 14.82% |
| 2023 | $1,464 | 9.50% | $1,542 | 6.93% | $1,367 | 3.80% |
| Average | – | 3.41% | – | 3.17% | – | 1.26% |
Clementiwoods has displayed a notably lower average growth rate over the past decade compared to the overall market. Examining its year-on-year performance reveals that, although prices did experience a recovery post-2014, they remained relatively stagnant and recorded negative growth for several years until the onset of the pandemic. This is except for 2018 when the overall market witnessed an upward trend.
Recent transactions
2-bedroom units
There were no 2-bedroom transactions in 2023. The latest one was sold in October 2022.
| Date | Size (sqft) | PSF | Price | Blk & level |
| Oct 2022 | 1,055 | $1,337 | $1,410,000 | 88 West Coast Road #04 |
| Sep 2022 | 1,001 | $1,448 | $1,450,000 | 78 West Coast Road #04 |
| Sep 2022 | 1,087 | $1,361 | $1,480,000 | 80 West Coast Road #04 |
| Sep 2022 | 1,076 | $1,325 | $1,426,000 | 78 West Coast Road #04 |
Bear in mind that prices could be slightly higher now given the increase in property prices.
3-bedroom units
There was only one 3-bedder sold last year.
| Date | Size (sqft) | PSF | Price | Blk & level |
| Mar 2023 | 1,389 | $1,476 | $2,050,000 | 90 West Coast Road #02 |
Based on these transactions, a 3-bedder might be out of your budget so let’s look at the 2-bedders.
Rental yield
| Unit type | Last transacted price in Oct 2022 | Average rent from Sep – Nov 2023 | Rental yield |
| 2-bedroom | $1,410,000 | 5,075 | 4.32% |
Unit layout
2-bedroom (1,001 sq ft)

The 2-bedroom units here are generously sized, ranging from 1,001 to 1,346 sq ft. The larger units may include an additional study or feature a sizable terrace/PES. Every part of the house is decent in size and comes with an enclosed kitchen, ideal for those who engage in regular heavy cooking. The living and dining areas are thoughtfully separated, and the master bedroom is particularly spacious. Both bedrooms and bathrooms incorporate bay windows, but the unit’s size ensures that it doesn’t compromise the overall liveable space.
Will the Greater Southern Waterfront significantly benefit the West Coast area?
The West Coast area is at the edge of the Greater Southern Waterfront which we’ve highlighted here before. While it seems exciting given the increased amenities and attractions the new area would bring, the spillover benefits may not be significant enough to warrant merit.
Residents can travel to the Greater Southern Waterfront, but it’s hard to say at this point that there is a strong benefit from it such that residents would want to pay more due to the added convenience. There would be no new MRT in the area given it’s already built up. We can expect more bus services that would go through the Greater Southern Waterfront, but there’s a lot of uncertainty about the area (we have very little information on it) to put weight on this.
Thus, we wouldn’t count on this transformation to significantly bring up the value of properties in the West Coast area. Sure, it’s a value add (and given new properties in the GSW will cost more, there may be spillover effects), but not one that you should base your decision on investing in the West Coast area on.
Which project is most suitable?
Let’s do a quick summary of the 5 developments.
| Project | Lease start year | TOP | No. of units | Rental yield | Growth rate (2017 – 2023) | Growth rate of non-landed 99y private property over the same period (resale) |
| Blue Horizon | 2000 | 2005 | 616 | 2b – 3.91%3b – 4.34% | 5.13% | 4.72% |
| The Vision | 2008 | 2014 | 281 | 2b – 3.83% | 4.84% | 4.72% |
| Seahill | 2011 | 2016 | 460 | 2b – 4.06%3b – 4.05% | 1.67% | 4.72% |
| Varsity Park Condominium | 2004 | 2008 | 530 | 2b – 4.36% | 4.36% | 4.72% |
| Clementiwoods Condominium | 2006 | 2010 | 240 | 2b – 4.32% | 5.19% | 4.72% |
Considering your anticipated holding period of approximately 10 years, it would be prudent to explore younger developments. Given that these are 99-year leasehold projects, ageing properties may pose concerns related to lease decay over time.
You also mentioned the prospect of holding onto the property for a longer duration if there’s potential for an en bloc sale. We generally don’t like to count on an en-bloc sale as an exit, especially when you already know your holding period. There’s no guarantee that this will happen in that timeframe, and you may be left holding on to a property for much longer hoping for a sale.
Blue Horizon, The Vision, and Seahill are on land parcels with a plot ratio of 2.8 and a height restriction of 36 storeys. Despite this, they are already quite developed. Varsity Park and Clementiwoods occupy land plots with a plot ratio of 1.4 and a height restriction of 5 storeys.
These properties are unlikely to have significant en bloc potential, especially since they are located adjacent to areas zoned for mixed landed housing, suggesting that the neighbourhood’s characteristics are likely to remain unchanged with a low plot ratio of 1.4 (although, never say never).
The high rental yields could be attributed to demand from various educational institutions nearby, suggesting that these projects might be predominantly investor-driven, thus explaining the lower capital appreciation rates. To further gauge the degree of investor influence, let’s examine the ratio of rental transactions conducted in 2023 to the total number of units in each development.
| Project | No. of units | Units rented out the past year (Dec 2022 – Nov 2023) | % of units rented out |
| Blue Horizon | 616 | 107 | 17.37% |
| The Vision | 281 | 59 | 21.00% |
| Seahill | 460 | 127 | 27.61% |
| Varsity Park Condominium | 530 | 75 | 14.15% |
| Clementiwoods Condominium | 240 | 37 | 15.42% |
Given the possibility of some leases spanning 2-year periods and not being recorded in the past year, these figures might slightly underestimate the actual numbers. Nonetheless, according to the provided table, the proportion of investors to homeowners remains relatively balanced, with the majority of the investor count constituting less than a quarter of its total units except Seahill which has a higher proportion of investors compared to the rest.
It’s important to consider that the elevated rental yield could potentially contribute to maintaining the property’s quantum to sustain an average yield. However, the specific characteristics of each development significantly influence this dynamic.
Based on the above data, among the five projects, Clementiwoods Condominium appears to stand out among the others considering its rental yield, capital appreciation over the past five years, and the lowest investor ratio.
In terms of layout, the 2-bedders are also well-sized and will provide a comfortable living space should you decide to move in. However, its potential for en bloc is low due to its current plot ratio (unless this is revised) and maximised Gross Floor Area (GFA) but this is not an issue exclusive to Clementiwoods Condominium.
The only downside is its leasehold nature, but all 5 face this issue. Clementiwoods Condominium is already 17 years into its lease, so there could be some depreciation effects over the next 10 years.
At Stacked, we like to look beyond the headlines and surface-level numbers, and focus on how things play out in the real world.
If you’d like to discuss how this applies to your own circumstances, you can reach out for a one-to-one consultation here.
And if you simply have a question or want to share a thought, feel free to write to us at stories@stackedhomes.com — we read every message.
Read next from Editor's Pick

Property Advice We’re Upgrading From A 5-Room HDB On A Single Income At 43 — Which Condo Is Safer?
Singapore Property News We Review The February 2026 BTO Launch Sites (Bukit Merah, Toa Payoh, Tampines, Sembawang)
Singapore Property News One Segment of the Singapore Property Market Is Still Climbing — Even as the Rest Slowed in 2025
Singapore Property News Why Buying Or Refinancing Your Home Makes More Sense In 2026
Latest Posts

Pro Where HDB Flats Continue to Hold Value Despite Ageing Leases
Property Market Commentary What A Little-Noticed URA Rule Means For Future Neighbourhoods In Singapore
Pro What Happens When a “Well-Priced” Condo Hits the Resale Market

Singapore Property News Why The Rising Number Of Property Agents In 2026 Doesn’t Tell The Full Story
New Launch Condo Analysis This New Dairy Farm Condo Starts From $998K — How the Pricing Compares

Homeowner Stories We Could Walk Away With $460,000 In Cash From Our EC. Here’s Why We Didn’t Upgrade.

On The Market Here Are The Cheapest Newer 3-Bedroom Condos You Can Still Buy Under $1.7M

New Launch Condo Reviews Narra Residences Review: A New Condo in Dairy Farm Priced Close To An EC From $1,930 PSF
Property Market Commentary Why Looking at Average HDB Prices No Longer Tells the Full Story: A New Series
Singapore Property News This Latest $962 PSF Land Bid May Push Dairy Farm Homes Past $2,300 PSF — Here’s Why
On The Market Orchard Road’s Most Unlikely $250 Million Property Is Finally Up for Sale — After 20 Years
Overseas Property Investing What $940,000 Buys You in Penang Today — Inside a New Freehold Landed Estate

Singapore Property News One of Singapore’s Biggest Property Agencies Just Got Censured
New Launch Condo Analysis This New Freehold CBD Condo Starts From $1.29M — Here’s How the Pricing Compares
Singapore Property News Over 3,500 People Visit Narra Residences During First Preview Weekend


If you are looking for capital appreciation in west coast, you can consider the PARC condo! The PARC condo is freehold and the upcoming west coast mrt will be right behind it. It is pretty convenient as well- Ayer rajar hawker and ntuc are right behind the condo. You can also walk to Clementi mrt. Relatively well maintained as well