


Since publishing 2 articles recently on cash-flow positive properties that you can invest in in the OCR and the CCR, we’ve had a couple of readers asking:
Is it worth investing in an old leasehold property to achieve positive rental gains?
Investing in old leasehold properties can be alluring mainly due its affordable quantum. This puts it within reach of more property investors, and these are generally the more cash-flow positive investments you can make given the higher rental yields.
To answer this question, we turn our attention to a 60-year leasehold property.
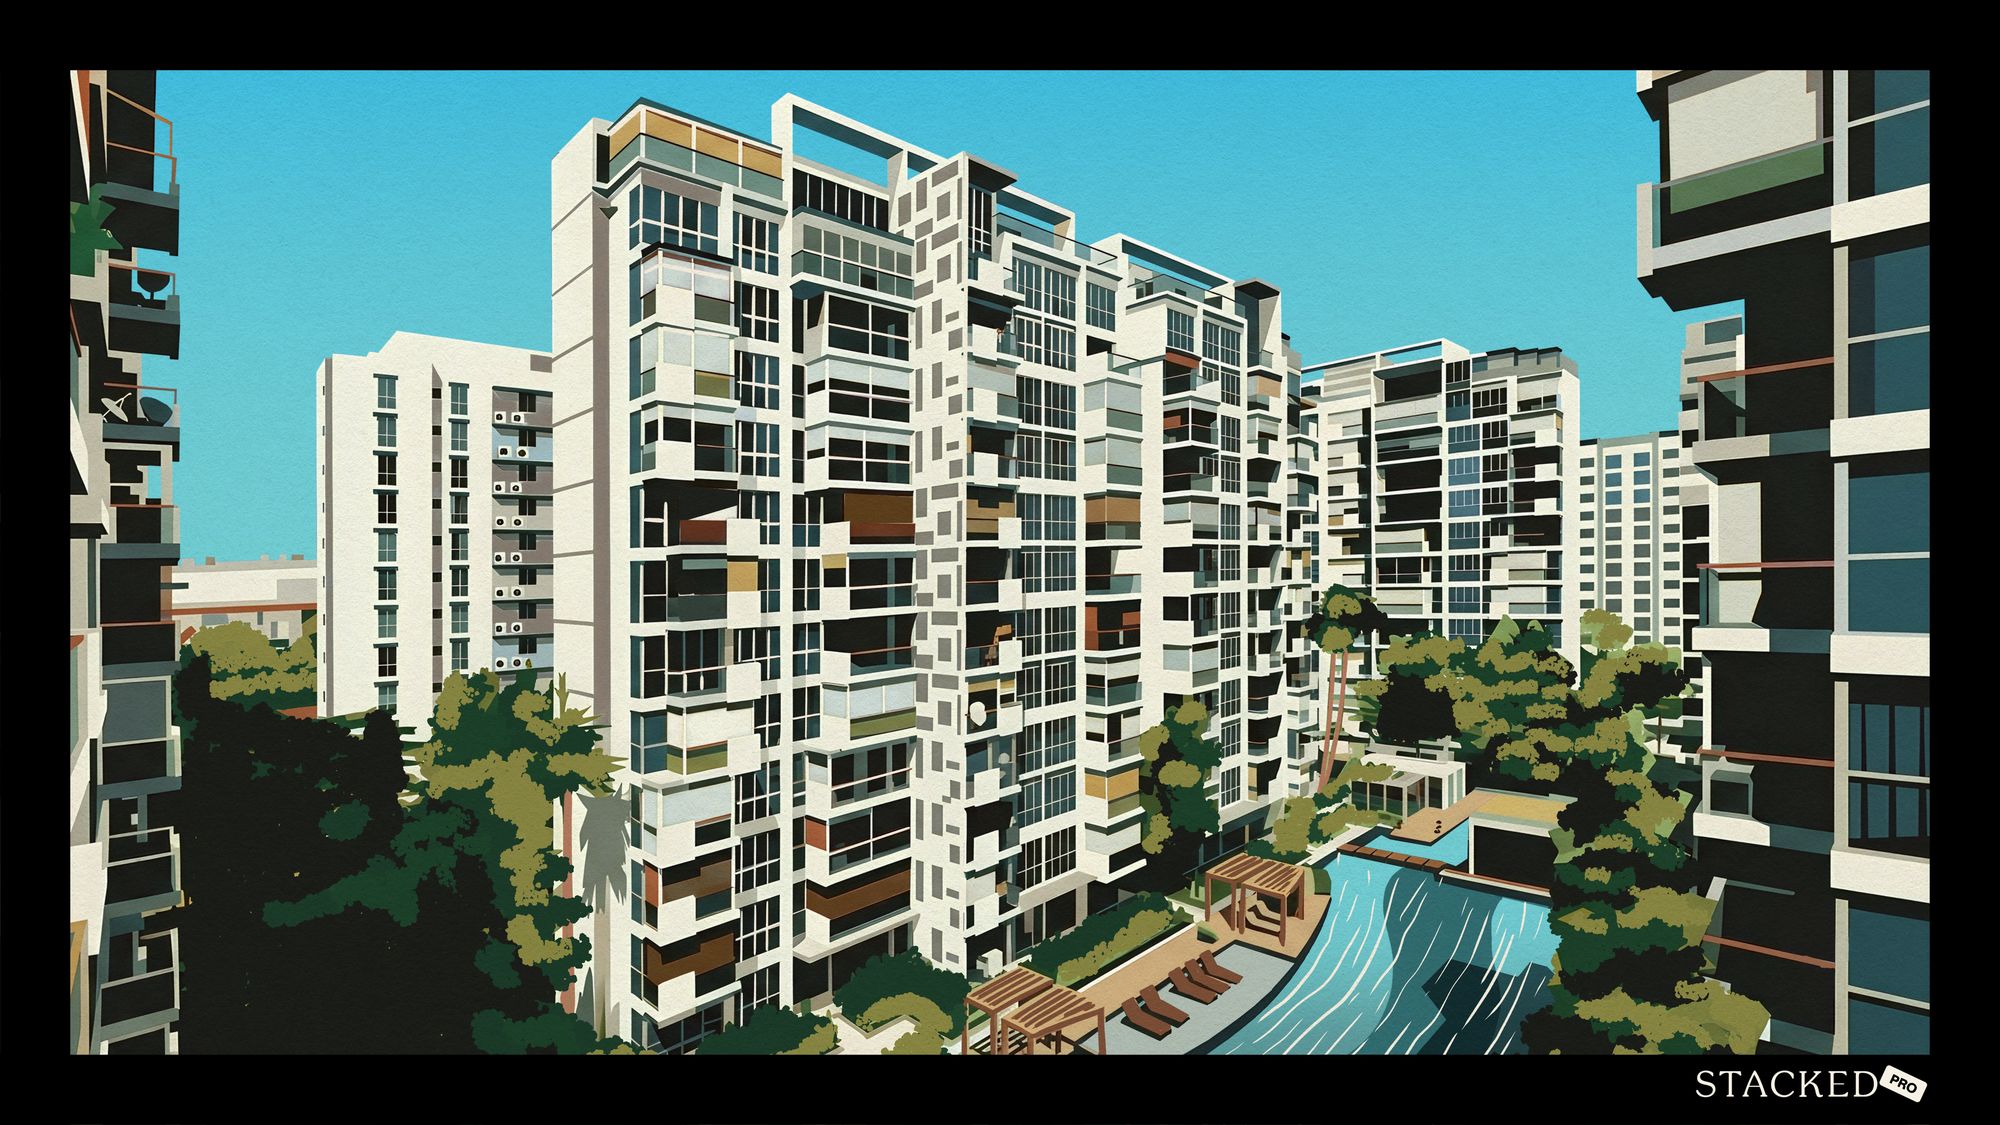
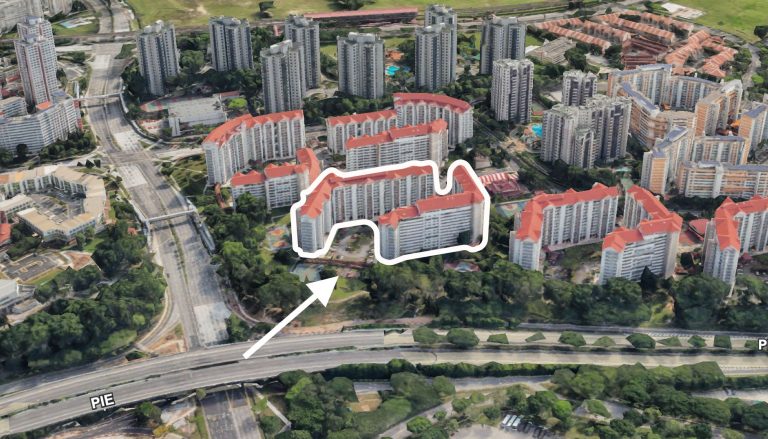
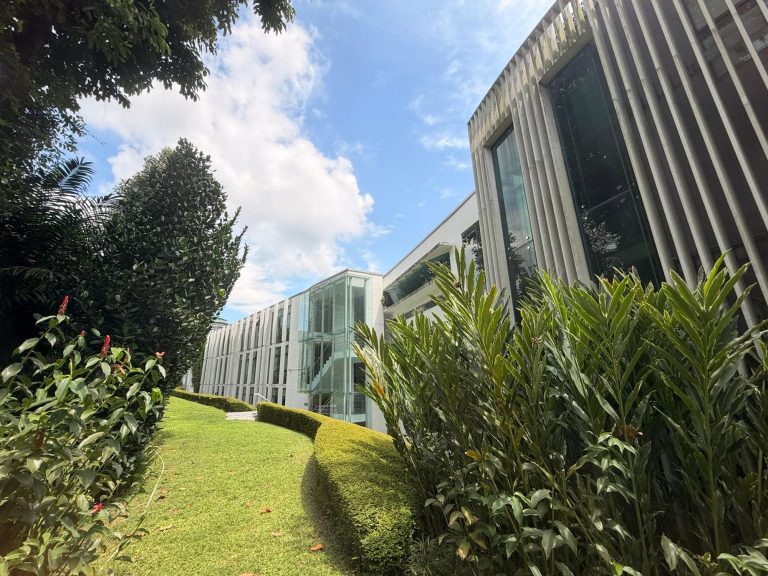
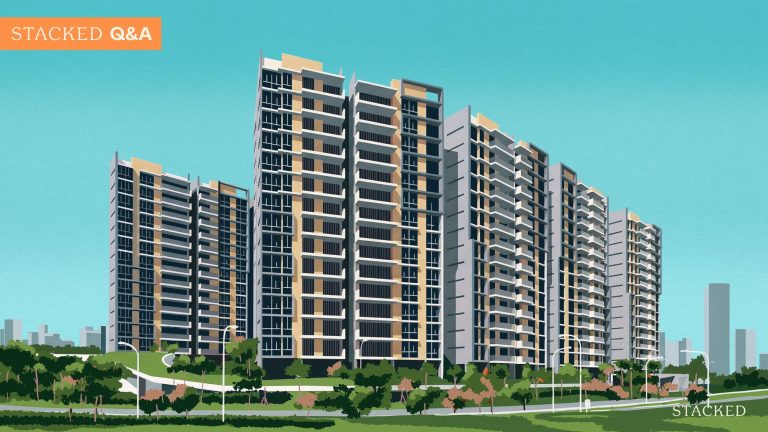
This property is The Hillford – which we featured in our previous article on cash-flow positive properties in the OCR (note: The Hillford is actually in RCR, but its just a few metres away from the OCR).
The Hillford’s claim to fame is its 60-year leasehold status. That, or the fact that the property is touted as a retirement village – take your pick.
It definitely did have its fair share of doubters when it was first announced, but it proved all its naysayers wrong when the 60-year leasehold property was fully sold within the day!
Undeniably (as a result of the lower lease) the overall quantum of units here costs significantly less than other properties, which results in a higher rental yield – hence the attraction.
So the question that we are looking to answer here today is – is it worth investing in a short-lease residential property such as The Hillford for the rental gains?
A word of caution: the analysis ahead relies on several assumptions and should not be taken as investment advice. It is only for educational purposes.
The challenge for many buyers today isn't access to information.
It's interpreting that information in a way that makes sense for their finances, goals, and stage of life.
Over time, that's also why we decided to work with agents who shared the same data-driven and advisory-led approach behind our editorial, consultants who could help readers think through decisions more objectively, rather than simply push transactions.
Today, the team has worked with more than 2,000 clients across over $5B in property transactions.
Determining the depreciation
The first thing we need to determine is the depreciation.
The Hillford’s lease began in 2013, and its first sale occured in 2014. As at the time of writing, The Hillford has 53 years lease remaining.
Naturally if you’re going to invest in The Hillford and hold it until the lease remaining runs to 0, then your depreciation is the full amount paid.
The problem occurs when you’re trying to find out what is your net income if you choose to exit your investment before the lease runs down to 0. E.g. 5, 10 or 20 years later.
If you’ve read our leasehold vs. freehold article, you’ll see that the depreciation of any leasehold property is actually curved and not a straight line – which the Bala’s Curve illustrates.
This non-linear nature of the curve is due to the time value of money. Money on hand today is worth more than money years down the road. So when it comes to buying a property, the rental returns received this year is worth more than the rent received 10 years later – since over time, the cash you have on hand today can be used to earn interest.
This means that a leasehold property is worth more earlier, and much less later on, and an appropriate discount rate is applied to reflect this “time value of money”.
So what’s the depreciation each year?
As the Bala’s Curve assumes a 99-year leasehold tenure, I had to make some adjustments to account for a 60-year tenure instead.
To determine the time value of money, I assumed a 3.5% discount rate. This discount rate is chosen as it is the medium-term interest rate as determined by the Monetary Authority of Singapore.
This is the discount factor that is used to determine the leasehold value of The Hillford over its 60-year lease.
As you might expect, over time the depreciation of the property will accelerate.
| Actual Year | Lease Remaining | % Leasehold value compared to Freehold | % Depreciation |
| 2013 | 60 | 87% | |
| 2014 | 59 | 87% | 99% |
| 2015 | 58 | 86% | 99% |
| 2016 | 57 | 86% | 99% |
| 2017 | 56 | 85% | 99% |
| 2018 | 55 | 85% | 99% |
| 2019 | 54 | 84% | 99% |
| 2020 | 53 | 84% | 99% |
| 2021 | 52 | 83% | 99% |
| 2022 | 51 | 83% | 99% |
| 2023 | 50 | 82% | 99% |
| 2024 | 49 | 81% | 99% |
| 2025 | 48 | 81% | 99% |
| 2026 | 47 | 80% | 99% |
| 2027 | 46 | 79% | 99% |
| 2028 | 45 | 79% | 99% |
| 2029 | 44 | 78% | 99% |
| 2030 | 43 | 77% | 99% |
| 2031 | 42 | 76% | 99% |
| 2032 | 41 | 76% | 99% |
| 2033 | 40 | 75% | 99% |
| 2034 | 39 | 74% | 99% |
| 2035 | 38 | 73% | 99% |
| 2036 | 37 | 72% | 99% |
| 2037 | 36 | 71% | 99% |
| 2038 | 35 | 70% | 99% |
| 2039 | 34 | 69% | 99% |
| 2040 | 33 | 68% | 98% |
| 2041 | 32 | 67% | 98% |
| 2042 | 31 | 66% | 98% |
| 2043 | 30 | 64% | 98% |
| 2044 | 29 | 63% | 98% |
| 2045 | 28 | 62% | 98% |
| 2046 | 27 | 60% | 98% |
| 2047 | 26 | 59% | 98% |
| 2048 | 25 | 58% | 98% |
| 2049 | 24 | 56% | 97% |
| 2050 | 23 | 55% | 97% |
| 2051 | 22 | 53% | 97% |
| 2052 | 21 | 51% | 97% |
| 2053 | 20 | 50% | 97% |
| 2054 | 19 | 48% | 96% |
| 2055 | 18 | 46% | 96% |
| 2056 | 17 | 44% | 96% |
| 2057 | 16 | 42% | 96% |
| 2058 | 15 | 40% | 95% |
| 2059 | 14 | 38% | 95% |
| 2060 | 13 | 36% | 94% |
| 2061 | 12 | 34% | 94% |
| 2062 | 11 | 32% | 93% |
| 2063 | 10 | 29% | 92% |
| 2064 | 9 | 27% | 91% |
| 2065 | 8 | 24% | 90% |
| 2066 | 7 | 21% | 89% |
| 2067 | 6 | 19% | 87% |
| 2068 | 5 | 16% | 85% |
| 2069 | 4 | 13% | 81% |
| 2070 | 3 | 10% | 76% |
| 2071 | 2 | 7% | 68% |
| 2072 | 1 | 3% | 51% |
| 2073 | 0 | 0 | 0 |
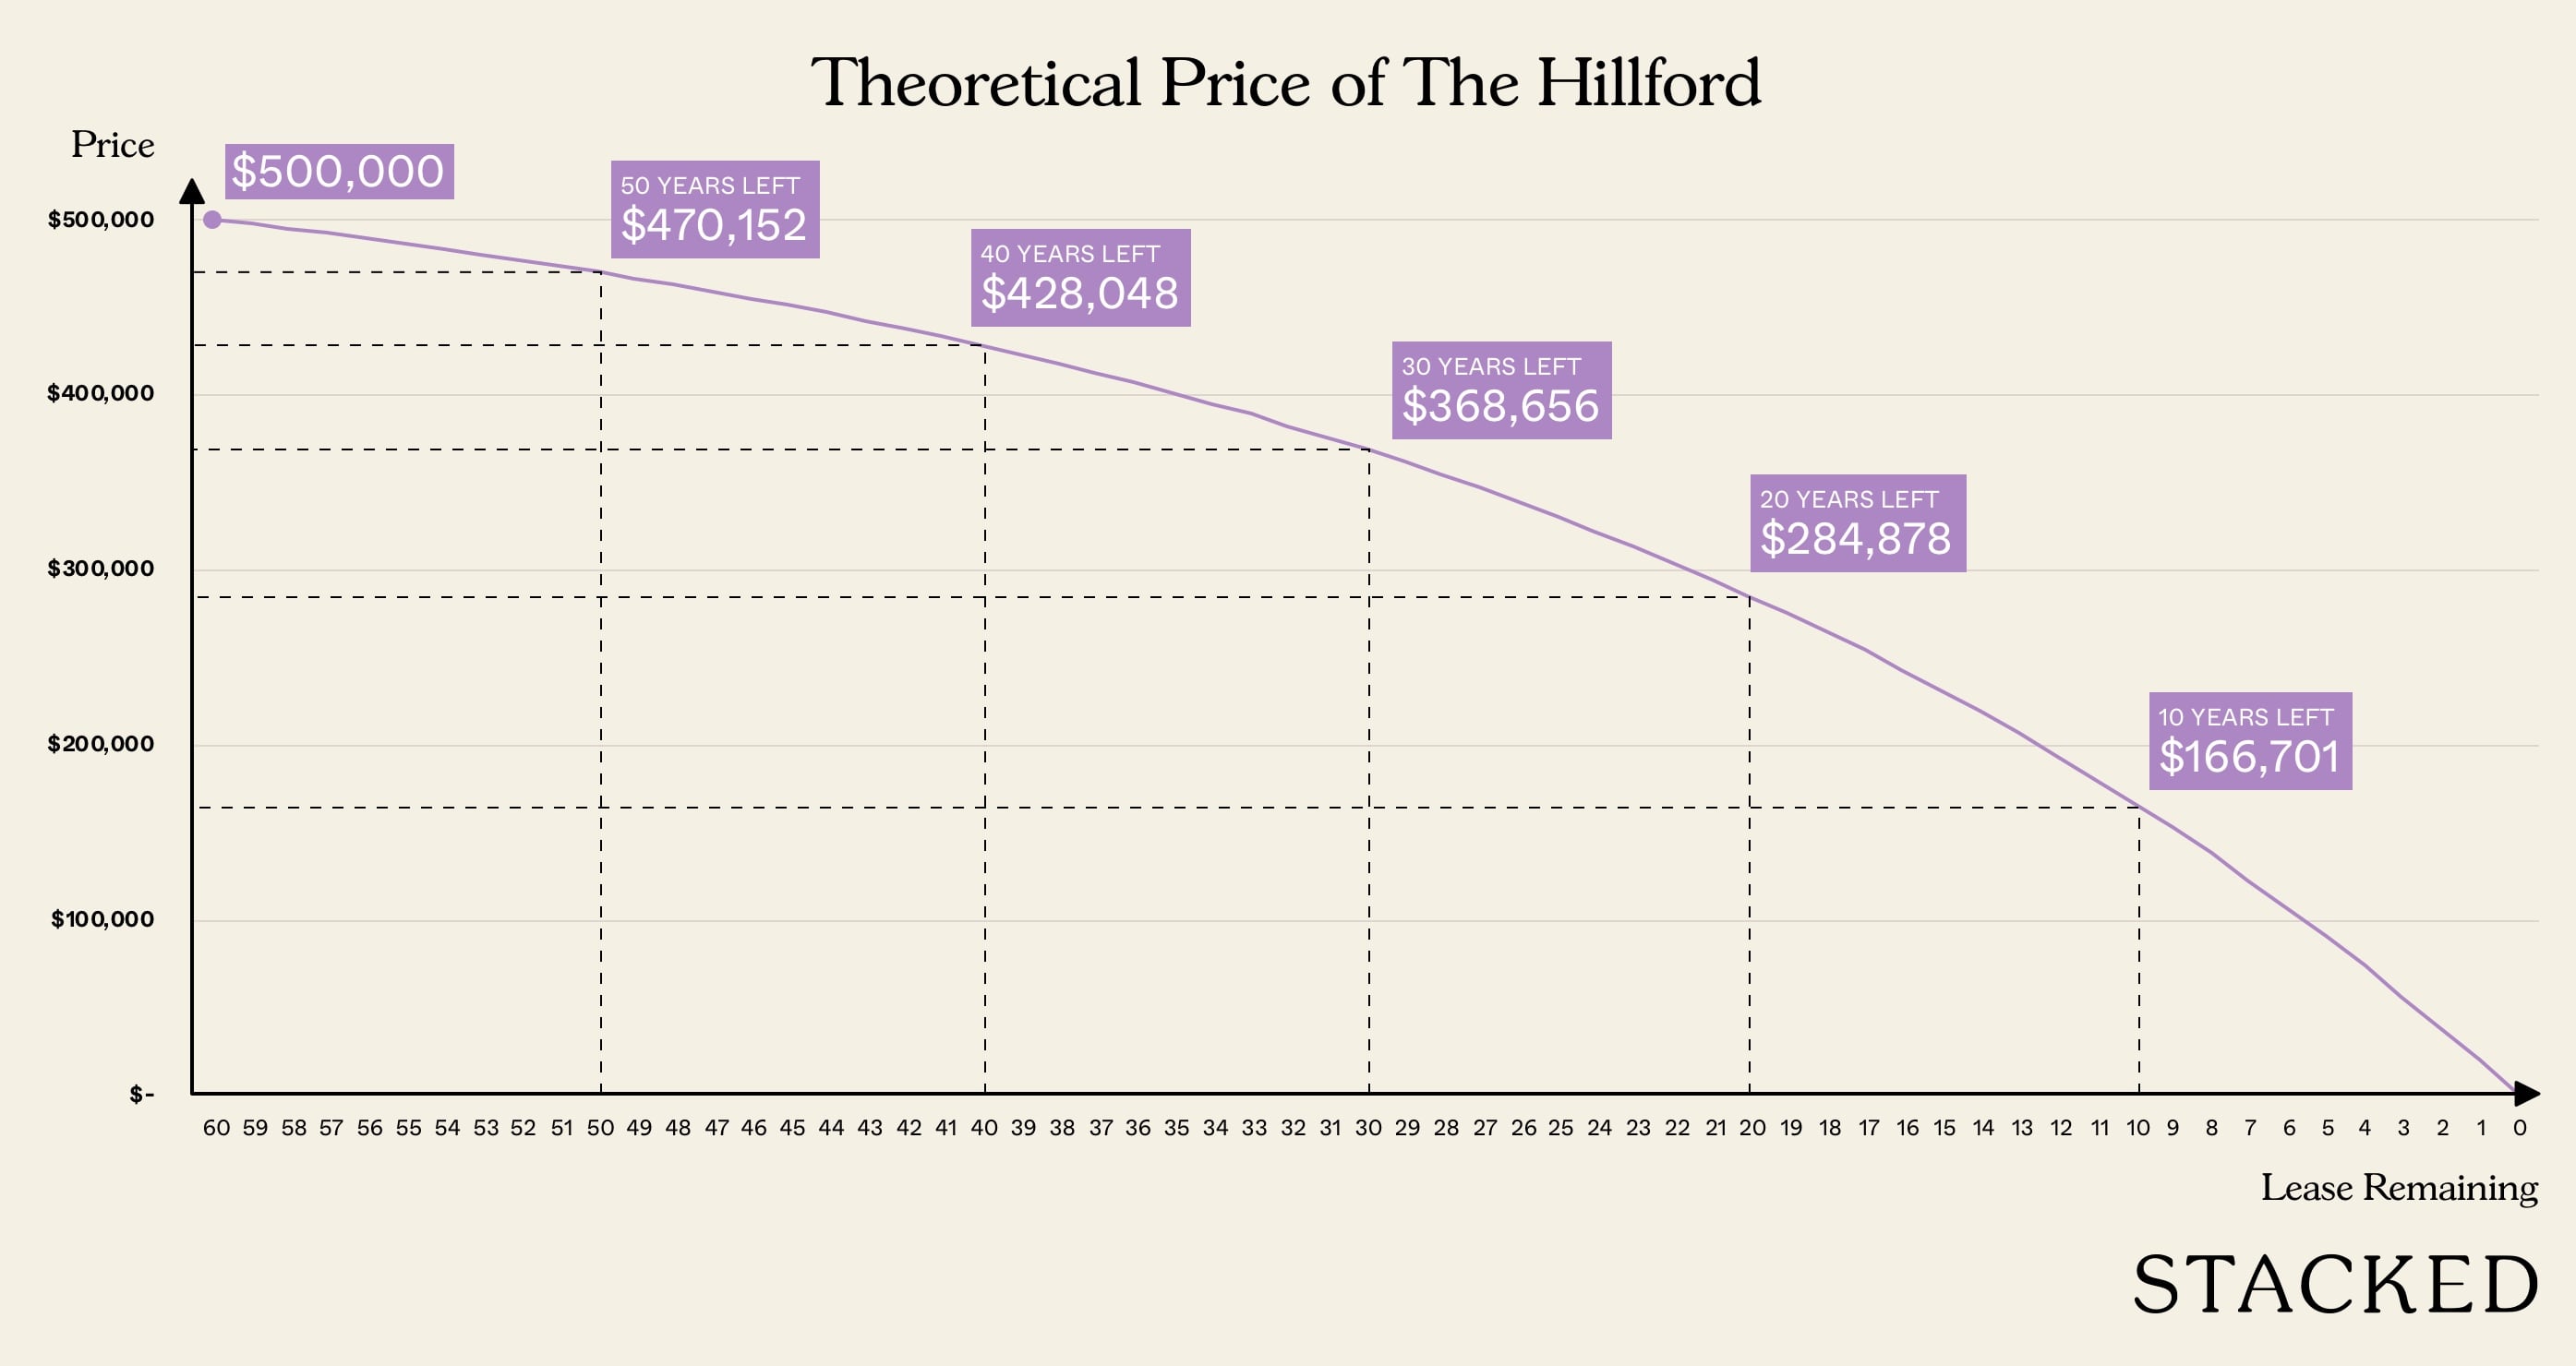
Here’s how the prices look like over time assuming a starting price of $500,000.
The Hillford: Costs vs Income
I will be assuming the smallest unit here is purchased for investment given its low quantum and ease of renting it out.
In this case the smallest unit at The Hillford is 398 sq ft, and data from URA indicates that the median price for such a unit is $475,000 in 2020.
So $475,000 will be used as the starting price to extrapolate the price as the lease runs down.
Using the depreciation table above, this means the 2021 prices would be $471,798. In 2022, it would be $465,054 and so on until $0 in 2073 when the lease runs to 0.
| Costs | Income | ||||||||
| Year | Lease Remaining | Price | Depreciation | Interest Cost | Property Tax | Maintenance Cost | Stamp Duty + Legal Fees | Rental Income | Net Income |
| 2021 | 52 | $471,798 | $6,998 | $888 | $3,600 | $11,754 | $22,200 | -$1,039 | |
| 2022 | 51 | $468,484 | $3,314 | $6,822 | $888 | $3,600 | $22,200 | $7,576 | |
| 2023 | 50 | $465,054 | $3,430 | $6,643 | $888 | $3,600 | $22,200 | $7,639 | |
| 2024 | 49 | $461,504 | $3,550 | $6,460 | $888 | $3,600 | $22,200 | $7,702 | |
| 2025 | 48 | $457,830 | $3,674 | $6,274 | $888 | $3,600 | $22,200 | $7,764 | |
| 2026 | 47 | $454,027 | $3,803 | $6,084 | $888 | $3,600 | $22,200 | $7,825 | |
| 2027 | 46 | $450,091 | $3,936 | $5,890 | $888 | $3,600 | $22,200 | $7,886 | |
| 2028 | 45 | $446,017 | $4,074 | $5,692 | $888 | $3,600 | $22,200 | $7,946 | |
| 2029 | 44 | $441,800 | $4,216 | $5,490 | $888 | $3,600 | $22,200 | $8,006 | |
| 2030 | 43 | $437,436 | $4,364 | $5,284 | $888 | $3,600 | $22,200 | $8,064 | |
| 2031 | 42 | $432,920 | $4,517 | $5,074 | $888 | $3,600 | $22,200 | $8,122 | |
| 2032 | 41 | $428,245 | $4,675 | $4,859 | $888 | $3,600 | $22,200 | $8,178 | |
| 2033 | 40 | $423,406 | $4,838 | $4,641 | $888 | $3,600 | $22,200 | $8,233 | |
| 2034 | 39 | $418,399 | $5,008 | $4,418 | $888 | $3,600 | $22,200 | $8,287 | |
| 2035 | 38 | $413,216 | $5,183 | $4,190 | $888 | $3,600 | $22,200 | $8,339 | |
| 2036 | 37 | $407,851 | $5,364 | $3,958 | $888 | $3,600 | $22,200 | $8,390 | |
| 2037 | 36 | $402,299 | $5,552 | $3,721 | $888 | $3,600 | $22,200 | $8,439 | |
| 2038 | 35 | $396,553 | $5,747 | $3,479 | $888 | $3,600 | $22,200 | $8,486 | |
| 2039 | 34 | $390,605 | $5,948 | $3,233 | $888 | $3,600 | $22,200 | $8,532 | |
| 2040 | 33 | $384,449 | $6,156 | $2,981 | $888 | $3,600 | $22,200 | $8,575 | |
| 2041 | 32 | $378,078 | $6,371 | $2,724 | $888 | $3,600 | $22,200 | $8,616 | |
| 2042 | 31 | $371,484 | $6,594 | $2,463 | $888 | $3,600 | $22,200 | $8,655 | |
| 2043 | 30 | $364,659 | $6,825 | $2,195 | $888 | $3,600 | $22,200 | $8,691 | |
| 2044 | 29 | $357,595 | $7,064 | $1,923 | $888 | $3,600 | $22,200 | $8,725 | |
| 2045 | 28 | $350,284 | $7,311 | $1,645 | $888 | $3,600 | $22,200 | $8,756 | |
| 2046 | 27 | $342,716 | $7,567 | $1,361 | $888 | $3,600 | $22,200 | $8,783 | |
| 2047 | 26 | $334,885 | $7,832 | $1,072 | $888 | $3,600 | $22,200 | $8,808 | |
| 2048 | 25 | $326,779 | $8,106 | $777 | $888 | $3,600 | $22,200 | $8,829 | |
| 2049 | 24 | $318,389 | $8,390 | $476 | $888 | $3,600 | $22,200 | $8,846 | |
| 2050 | 23 | $309,705 | $8,683 | $169 | $888 | $3,600 | $22,200 | $8,860 | |
| 2051 | 22 | $300,718 | $8,987 | $888 | $3,600 | $22,200 | $8,725 | ||
| 2052 | 21 | $291,416 | $9,302 | $888 | $3,600 | $22,200 | $8,410 | ||
| 2053 | 20 | $281,789 | $9,627 | $888 | $3,600 | $22,200 | $8,085 | ||
| 2054 | 19 | $271,825 | $9,964 | $888 | $3,600 | $22,200 | $7,748 | ||
| 2055 | 18 | $261,511 | $10,313 | $888 | $3,600 | $22,200 | $7,399 | ||
| 2056 | 17 | $250,837 | $10,674 | $888 | $3,600 | $22,200 | $7,038 | ||
| 2057 | 16 | $239,790 | $11,048 | $888 | $3,600 | $22,200 | $6,664 | ||
| 2058 | 15 | $228,355 | $11,434 | $888 | $3,600 | $22,200 | $6,278 | ||
| 2059 | 14 | $216,521 | $11,835 | $888 | $3,600 | $22,200 | $5,877 | ||
| 2060 | 13 | $204,272 | $12,249 | $888 | $3,600 | $22,200 | $5,463 | ||
| 2061 | 12 | $191,595 | $12,677 | $888 | $3,600 | $22,200 | $5,035 | ||
| 2062 | 11 | $178,474 | $13,121 | $888 | $3,600 | $22,200 | $4,591 | ||
| 2063 | 10 | $164,893 | $13,580 | $888 | $3,600 | $22,200 | $4,132 | ||
| 2064 | 9 | $150,837 | $14,056 | $888 | $3,600 | $22,200 | $3,656 | ||
| 2065 | 8 | $136,290 | $14,548 | $888 | $3,600 | $22,200 | $3,164 | ||
| 2066 | 7 | $121,233 | $15,057 | $888 | $3,600 | $22,200 | $2,655 | ||
| 2067 | 6 | $105,649 | $15,584 | $888 | $3,600 | $22,200 | $2,128 | ||
| 2068 | 5 | $89,520 | $16,129 | $888 | $3,600 | $22,200 | $1,583 | ||
| 2069 | 4 | $72,826 | $16,694 | $888 | $3,600 | $22,200 | $1,018 | ||
| 2070 | 3 | $55,548 | $17,278 | $888 | $3,600 | $22,200 | $434 | ||
| 2071 | 2 | $37,665 | $17,883 | $888 | $3,600 | $22,200 | -$171 | ||
| 2072 | 1 | $19,156 | $18,509 | $888 | $3,600 | $22,200 | -$797 | ||
| 2073 | 0 | $0 | $19,156 | $888 | $3,600 | $22,200 | -$1,444 | ||
| Total | $471,798 | $116,993 | $47,064 | $190,800 | $1,176,600 | $338,191 | |||
Breakdown of costs:
Depreciation – based on a discount factor of 3.5% as shown in the table above. Total depreciation amounts to $471,798.
Interest cost – I assume that the investment is made up of a 75% loan, and a 25% downpayment. A 2% interest rate is applied over a 30-year loan. Total interest amounts to $116,993.
Property tax – 4% of the rental income of $22,200 which I assume to be the Annual Value of the property. Total tax amounts to $47,064. Note: this is just an estimate.
Maintenance – $300 per month multiplied for the year which is $3600 per year. Total maintenance amounts to $190,800.
Stamp Duty & Legal Fees – The standard Buyer Stamp Duty required to purchase the property is taken into account here ($8,754) plus legal fees of $3,000 for a total of $11,754.
Rental income:
The median monthly rental earned in 2020 for a 398 sq ft unit is $1,850. Each year, this equates to $22,200 for a total of $1,176,600 over 53 years.
Do note that for simplicity, I did not consider CPF being used for the property – more so because of the restrictions that CPF have on low-lease properties as well.

So what does the table tell us?
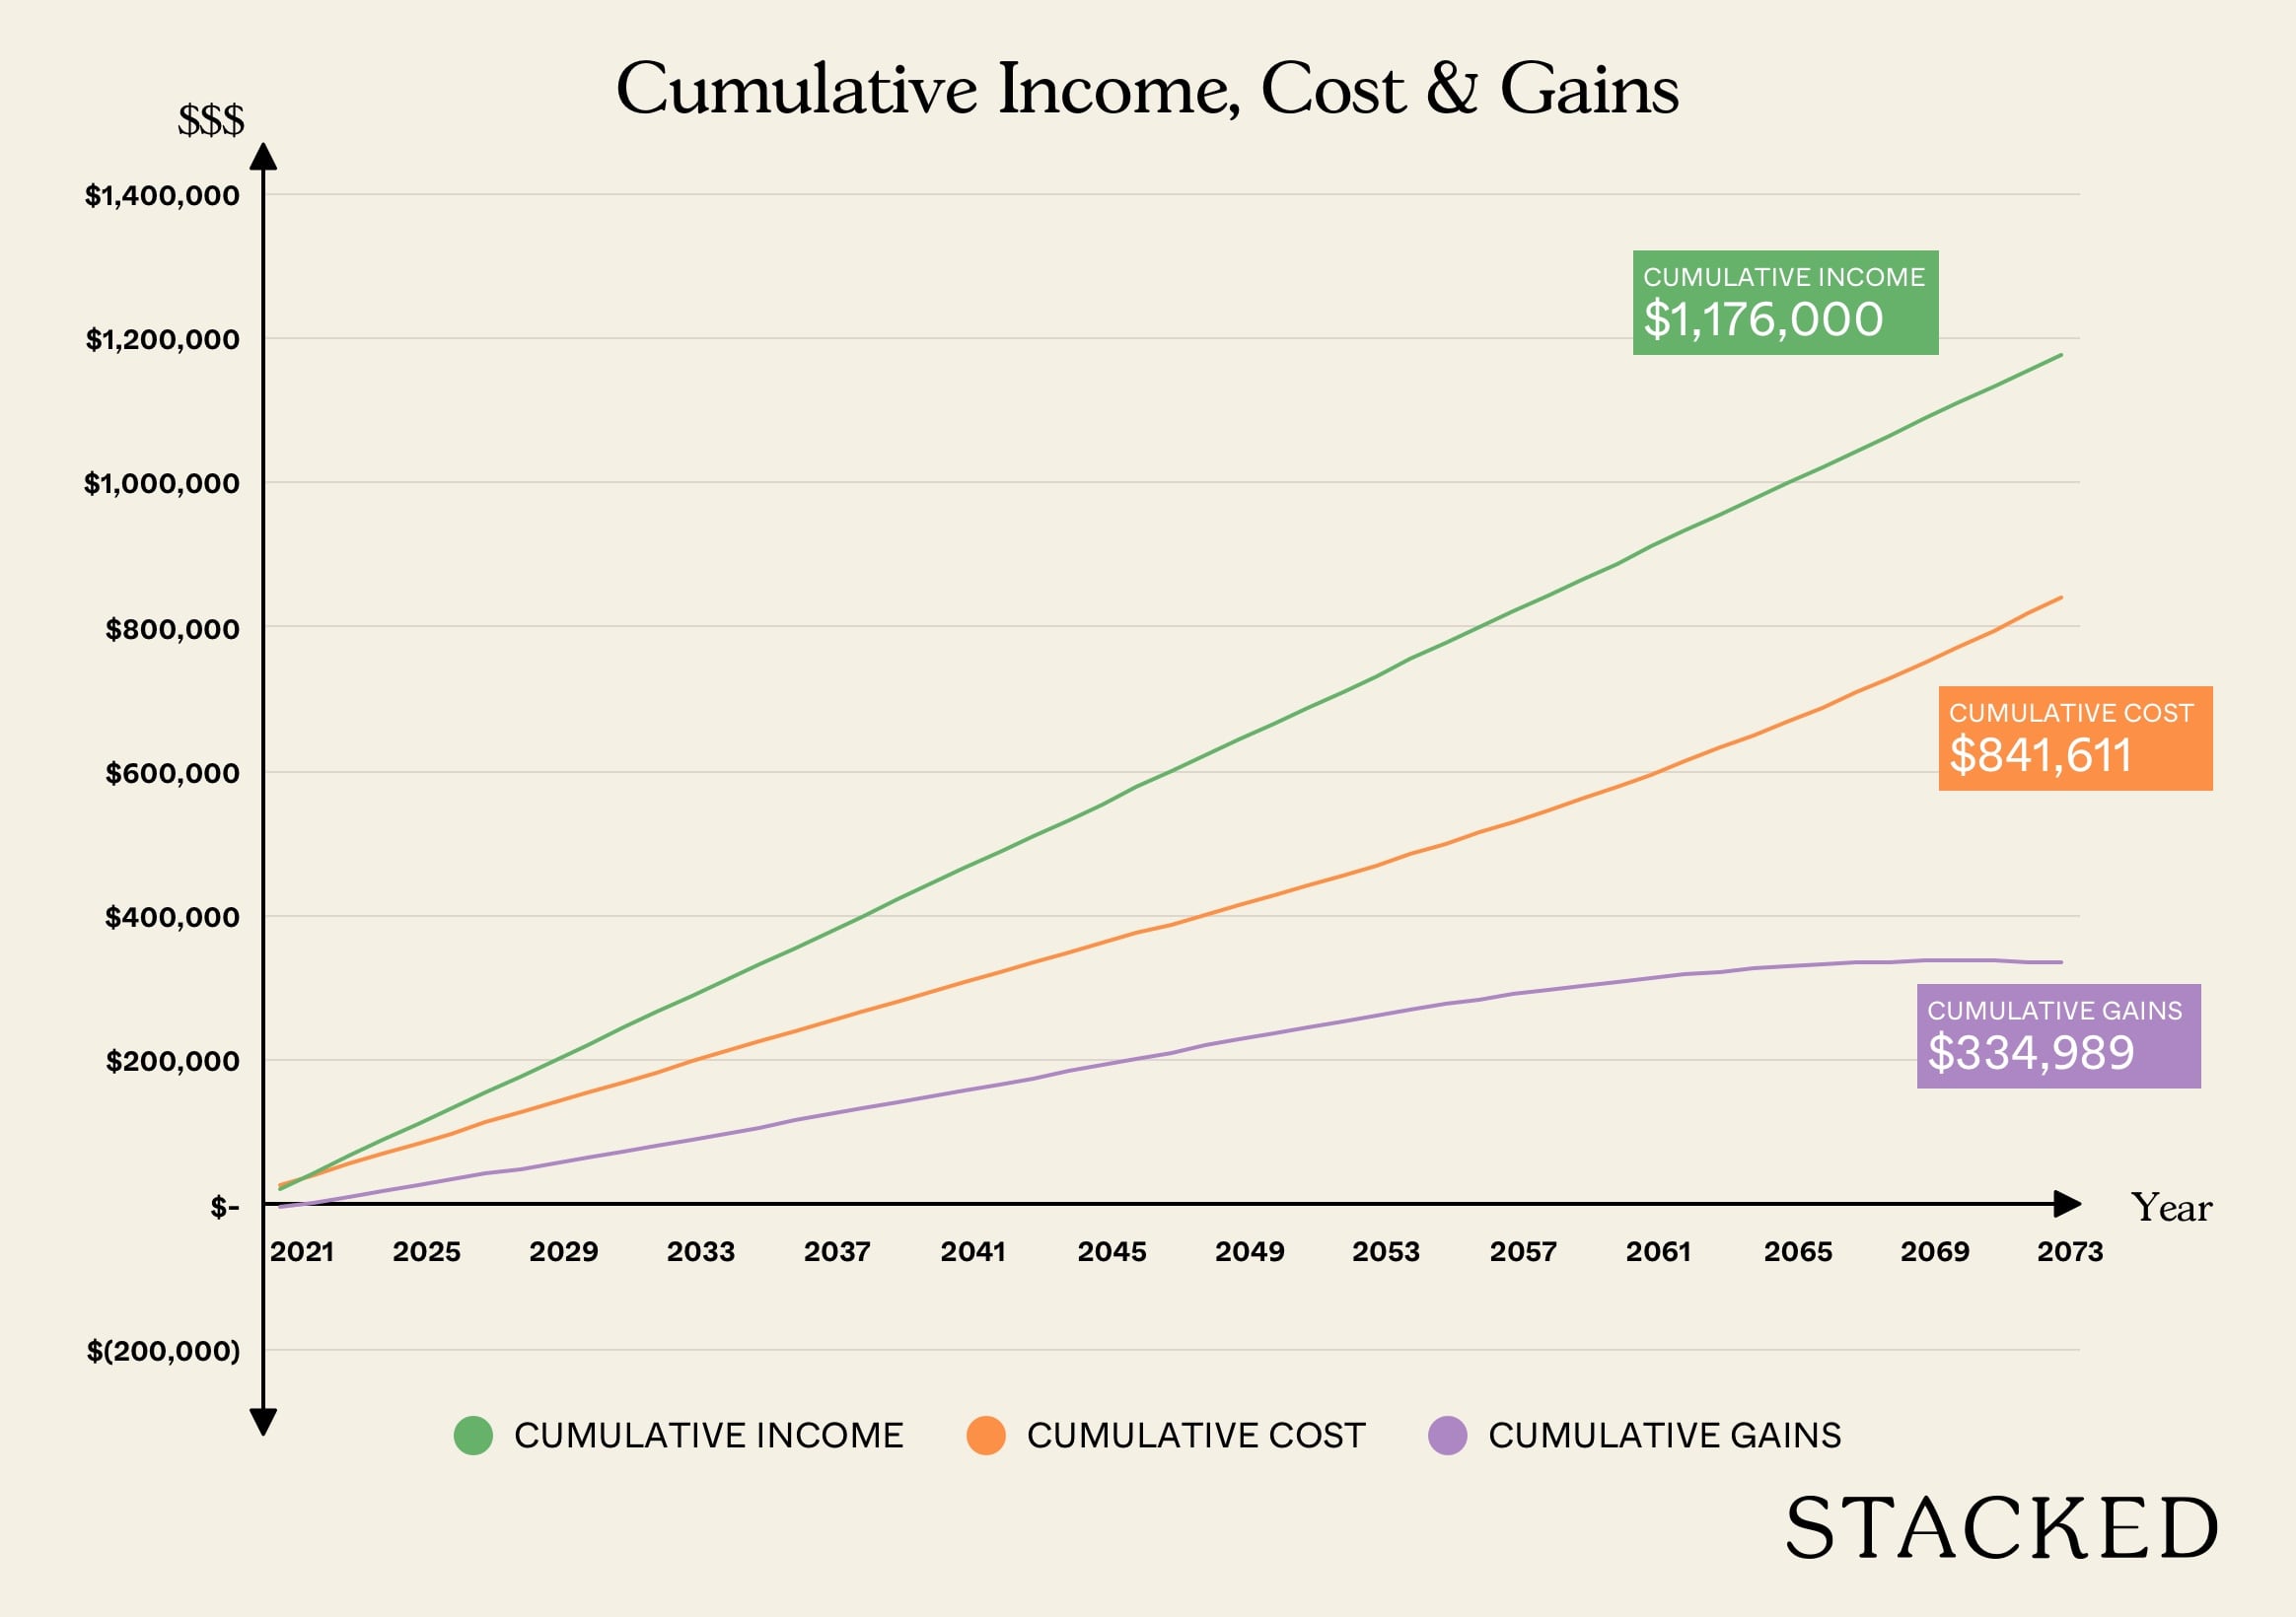
At the end of 53 years, the net income from all the hard work of renting it out, paying income tax, maintainence and interest cost leads to a $338,191 return. This is excluding the initial downpayment made.
So if you tie up your capital of $117,949.51 as part of the downpayment, you’ll earn $338,191 at the end of 53 years – a 189% return over 53 years.
Here’s an illustration of the total income, costs and net gains over time.
While the number sounds impressive, the returns are really paltry for the amount of time it took.
Over 53 years, the annualised return is just 2.01% per annum – even less than what the CPF Ordinary account gives you!
Not to mention the emotional turmoil you’ll have to go through to ensure your vacancy rate is at its lowest possible – or you’ll be facing returns of even less than 2.01%.
Thus far, investing in The Hillford doesn’t seem like a good idea
If you look at the opportunity cost of not investing in The Hillford and perhaps consider an investment portfolio that returns an average of 5%, then you’d be much better off.
Here’s a look at the cumulative gains from investing in The Hillford over 53 years versus an investment portfolio with a yearly return of 5%.
| Year | Property Gains (Yearly Income) (A) | Property Gains (Cumulative Income) (B) | Investment Portfolio Value (C) | Investment (Cumulative Gains) (D) | Difference (B-D) |
| 2021 | -$4,241 | -$4,241 | $123,847 | $5,897 | -$10,139 |
| 2022 | $7,576 | $3,335 | $130,039 | $12,090 | -$8,755 |
| 2023 | $7,639 | $10,974 | $136,541 | $18,592 | -$7,618 |
| 2024 | $7,702 | $18,675 | $143,368 | $25,419 | -$6,744 |
| 2025 | $7,764 | $26,439 | $150,537 | $32,587 | -$6,148 |
| 2026 | $7,825 | $34,265 | $158,064 | $40,114 | -$5,850 |
| 2027 | $7,886 | $42,151 | $165,967 | $48,017 | -$5,866 |
| 2028 | $7,946 | $50,097 | $174,265 | $56,316 | -$6,218 |
| 2029 | $8,006 | $58,103 | $182,978 | $65,029 | -$6,926 |
| 2030 | $8,064 | $66,167 | $192,127 | $74,178 | -$8,011 |
| 2031 | $8,122 | $74,289 | $201,734 | $83,784 | -$9,495 |
| 2032 | $8,178 | $82,467 | $211,820 | $93,871 | -$11,404 |
| 2033 | $8,233 | $90,700 | $222,411 | $104,462 | -$13,762 |
| 2034 | $8,287 | $98,986 | $233,532 | $115,582 | -$16,596 |
| 2035 | $8,339 | $107,325 | $245,209 | $127,259 | -$19,934 |
| 2036 | $8,390 | $115,715 | $257,469 | $139,519 | -$23,804 |
| 2037 | $8,439 | $124,154 | $270,342 | $152,393 | -$28,239 |
| 2038 | $8,486 | $132,641 | $283,860 | $165,910 | -$33,269 |
| 2039 | $8,532 | $141,173 | $298,053 | $180,103 | -$38,930 |
| 2040 | $8,575 | $149,748 | $312,955 | $195,006 | -$45,258 |
| 2041 | $8,616 | $158,364 | $328,603 | $210,653 | -$52,289 |
| 2042 | $8,655 | $167,019 | $345,033 | $227,084 | -$60,064 |
| 2043 | $8,691 | $175,711 | $362,285 | $244,335 | -$68,624 |
| 2044 | $8,725 | $184,436 | $380,399 | $262,449 | -$78,014 |
| 2045 | $8,756 | $193,192 | $399,419 | $281,469 | -$88,278 |
| 2046 | $8,783 | $201,975 | $419,390 | $301,440 | -$99,465 |
| 2047 | $8,808 | $210,783 | $440,359 | $322,410 | -$111,627 |
| 2048 | $8,829 | $219,612 | $462,377 | $344,428 | -$124,816 |
| 2049 | $8,846 | $228,458 | $485,496 | $367,547 | -$139,088 |
| 2050 | $8,860 | $237,318 | $509,771 | $391,821 | -$154,503 |
| 2051 | $8,725 | $246,043 | $535,260 | $417,310 | -$171,267 |
| 2052 | $8,410 | $254,453 | $562,022 | $444,073 | -$189,620 |
| 2053 | $8,085 | $262,538 | $590,124 | $472,174 | -$209,636 |
| 2054 | $7,748 | $270,285 | $619,630 | $501,680 | -$231,395 |
| 2055 | $7,399 | $277,684 | $650,611 | $532,662 | -$254,978 |
| 2056 | $7,038 | $284,722 | $683,142 | $565,192 | -$280,470 |
| 2057 | $6,664 | $291,387 | $717,299 | $599,349 | -$307,963 |
| 2058 | $6,278 | $297,664 | $753,164 | $635,214 | -$337,550 |
| 2059 | $5,877 | $303,542 | $790,822 | $672,873 | -$369,331 |
| 2060 | $5,463 | $309,005 | $830,363 | $712,414 | -$403,409 |
| 2061 | $5,035 | $314,039 | $871,881 | $753,932 | -$439,892 |
| 2062 | $4,591 | $318,630 | $915,475 | $797,526 | -$478,896 |
| 2063 | $4,132 | $322,762 | $961,249 | $843,300 | -$520,538 |
| 2064 | $3,656 | $326,418 | $1,009,312 | $891,362 | -$564,944 |
| 2065 | $3,164 | $329,583 | $1,059,777 | $941,828 | -$612,245 |
| 2066 | $2,655 | $332,238 | $1,112,766 | $994,817 | -$662,579 |
| 2067 | $2,128 | $334,366 | $1,168,404 | $1,050,455 | -$716,089 |
| 2068 | $1,583 | $335,949 | $1,226,825 | $1,108,875 | -$772,926 |
| 2069 | $1,018 | $336,967 | $1,288,166 | $1,170,216 | -$833,250 |
| 2070 | $434 | $337,401 | $1,352,574 | $1,234,625 | -$897,224 |
| 2071 | -$171 | $337,230 | $1,420,203 | $1,302,253 | -$965,023 |
| 2072 | -$797 | $336,433 | $1,491,213 | $1,373,263 | -$1,036,830 |
| 2073 | -$1,444 | $334,989 | $1,565,774 | $1,447,824 | -$1,112,835 |
Of particular interest is the last column (“difference”) which is calculated by taking the total gains from investing in The Hillford less the gains from investing the downpayment into a portfolio that returns 5% on average.
A positive number in this column means that the gains from property outweighs the gains from investing it at a 5% return and vice-versa.
As you can see, the difference starts to narrow from year 1 all the way to year 7, implying that the net income from investing in the property is actually better during this time.
But from year 7, this gap widens – due to both the increasing cost of depreciation and and more so the fact that a 5% return on an ever increasing portfolio trumps the gains from an investment in The Hillford.
At no point is the number positive, indicating that at any time, it would be better, on average, to invest your monies in the 5% portfolio.
Here’s a chart to illustrate this clearer.
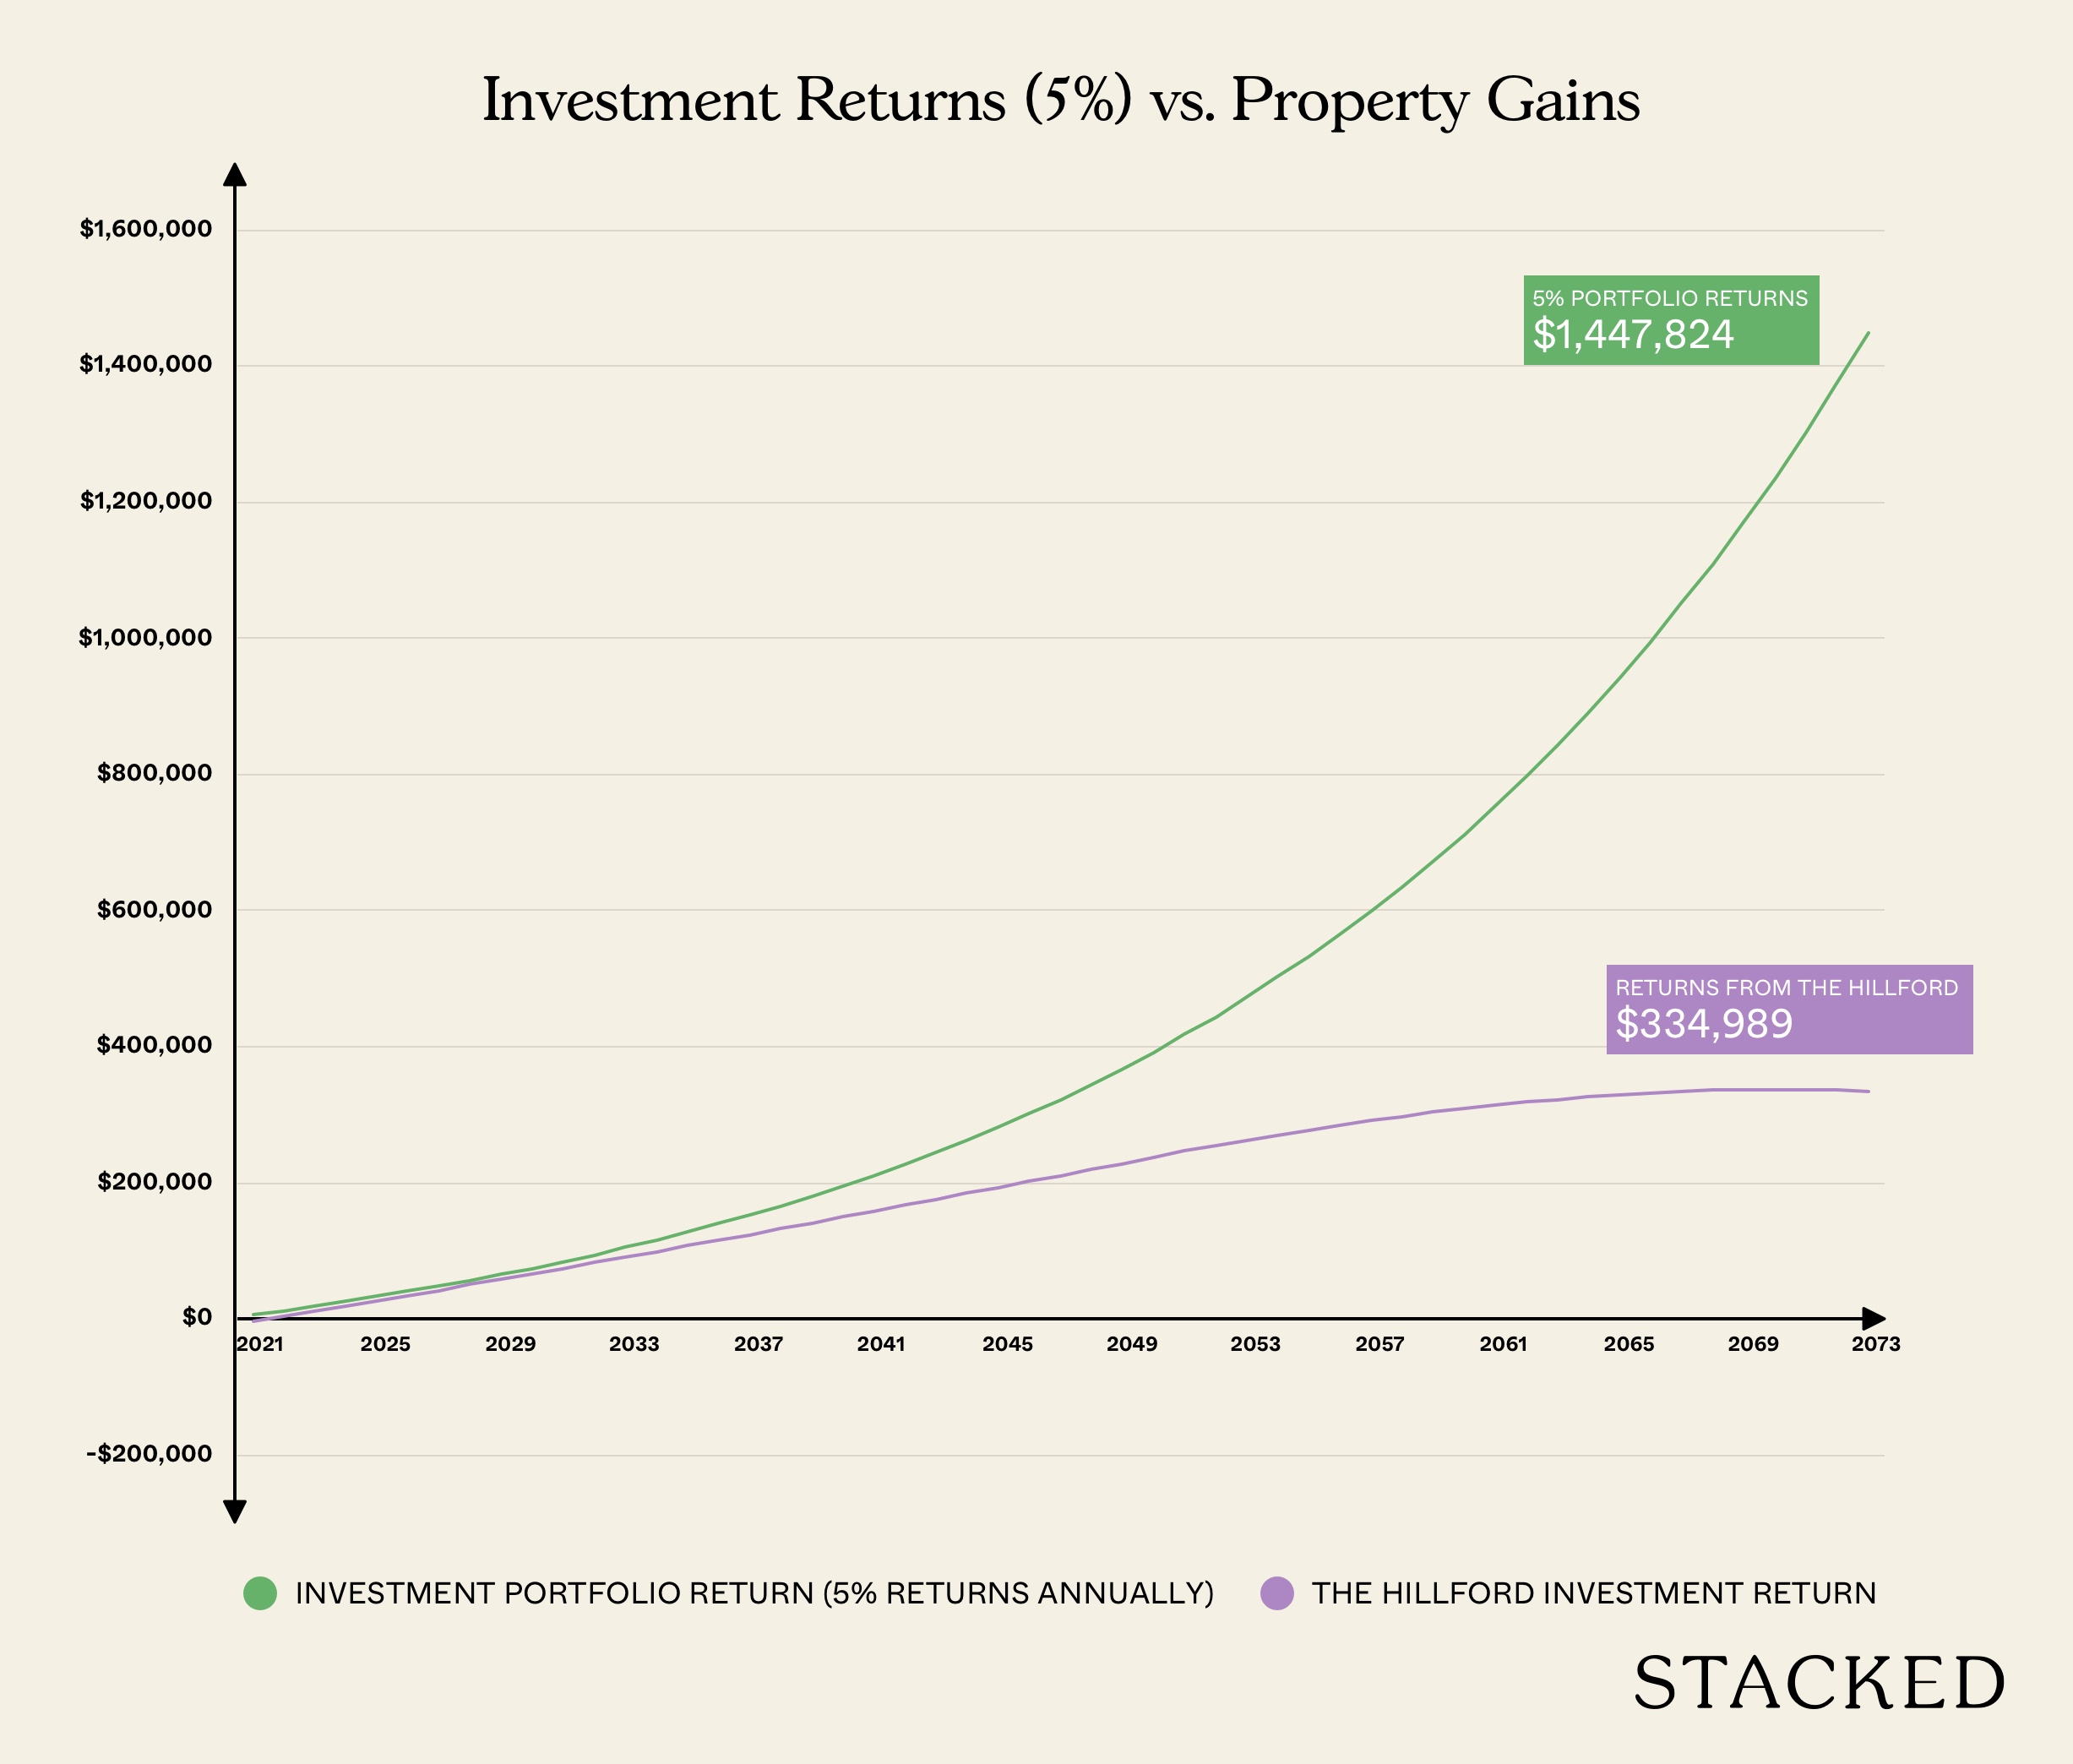
This occurs because despite an implied yield of over 4+% for The Hillford, there are other costs such as interest costs, maintenance and tax that eat into your returns.
Moreover, a short lease of 60 years means that the depreciation would eventually eat up most of your agains over time.
The investment portfolio on the other hand, behaves like a freehold property in that the fundamental value of the investment does not disappear (I’m assuming you diversify your portfolio here).
So… don’t invest in The Hillford?
At this juncture, it’s worth mentioning that not all is gloomy with The Hillford.
The entire premise of why such an investment would be of poor judgement assumes the theoretical depreciation is a reality – but the two are usually worlds apart (like the old leasehold D15 condos that have soared in values).
Our calculation so far assumed two things:
- Property inflation is non-existent
- Rental income is constant
Property inflation is non-existent
During the period of 2007-13, property prices essentially doubled, and while incomes and general inflation grew, it wasn’t to the extent of the property market.
An investment in The Hillford may not see such a strong depreciation if the overall property market grows.
While The Hillford looks like an affordable entry into the property market, anyone looking at a capital appreciation play here should be wary of the lease. For that, a young 99-year leasehold property or freehold property is preferred.
Moreover, the real gains from property comes from leverage. Given the small property value, the amount of leverage you can take here is low. Property market investing should also encompass a long-term view here, one that cannot be afforded with such a short tenure.
Rental income is constant
Our calculations also assumed rental income remains constant – but what if the rental you can command per year grows over time?
If so, then the implied yields would grow to the point where investors would start eyeing the property. Such a demand would drive prices up, which in turn helps to reduce the loss from depreciation.
Being cash-flow positive is not necessarily a good thing
From the calculations made, you can see that an investor who puts their money in The Hillford would see some cash coming in, even after accounting for cost.
But over time, the gains are eroded by the property’s depreciation.
Of course, The Hillford is an extreme example – and an initial investment in younger leasehold properties would tell a different story.
This means that those considering purchasing old leasehold properties for a positive cashflow – be sure to conduct careful analysis to ensure that the depreciation does not outstrip your gains as the depreciation is non-linear and accelerates as time goes by.
Hence it’s always important to know when to liquidate an old leasehold property for a new one and not get too attached to the property.
As always, if you are looking for advice on whether you should let go of your old property, or just property advice in general, feel free to contact us, or drop us an email at stories@stackedhomes.com!
At Stacked, we like to look beyond the headlines and surface-level numbers, and focus on how things play out in the real world.
If you’d like to discuss how this applies to your own circumstances, you can reach out for a one-to-one consultation here.
And if you simply have a question or want to share a thought, feel free to write to us at stories@stackedhomes.com — we read every message.
6 Comments
Hi Ryan,
Can you perform this same calculation for a HBD 5-room flat with remaining 60 years of lease based on the same purpose ?
Aiyoyo! No need all that data laaar. Can buy lar. If cheap, rental OK, just buy. No problem. This is NOT JURONG , it’s jurong kechil, D21 property. No problem. 🙂
Oh but xxxx, forgot to mention, this Hillford, the quality/ workmanship is a bit poor. That’s an issue as it gets a bit old. Overall, if price OK, I think it’s an OK property to invest in.